. 2022 Oct 7;18(10):e1010611.
doi: 10.1371/journal.pcbi.1010611. eCollection 2022 Oct.

Understanding molecular mechanisms and predicting phenotypic effects of pathogenic tubulin mutations

Affiliations

Understanding molecular mechanisms and predicting phenotypic effects of pathogenic tubulin mutations

Thomas J Attard et al. PLoS Comput Biol. .

Abstract

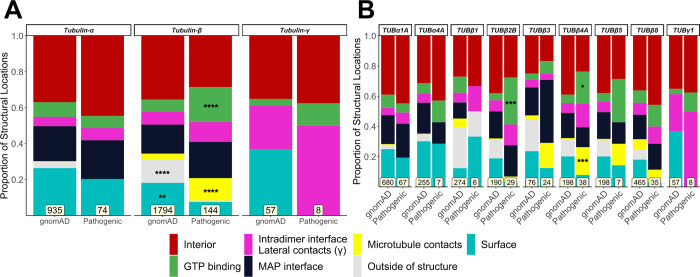
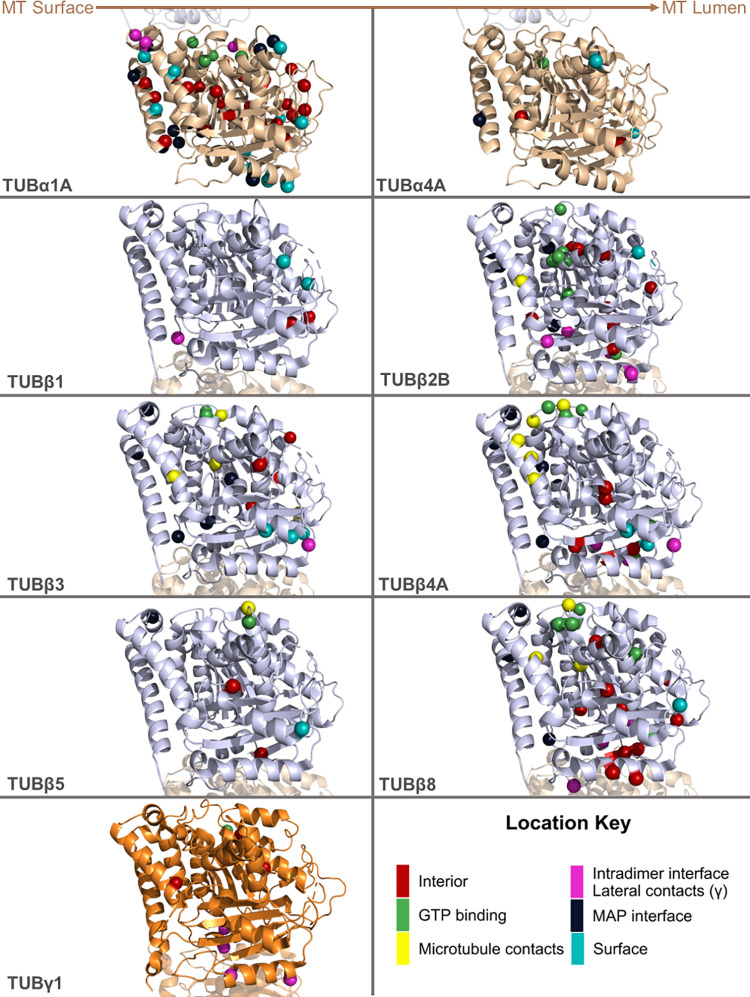
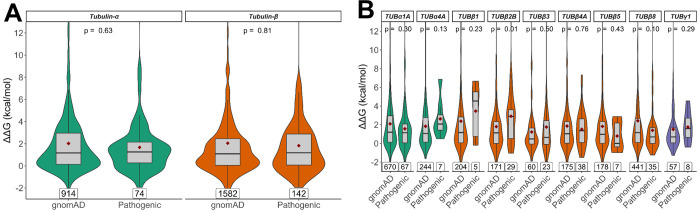
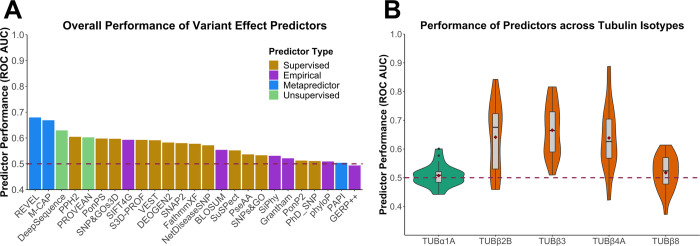
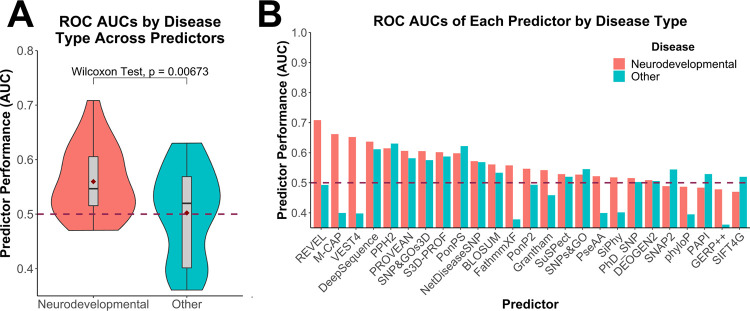
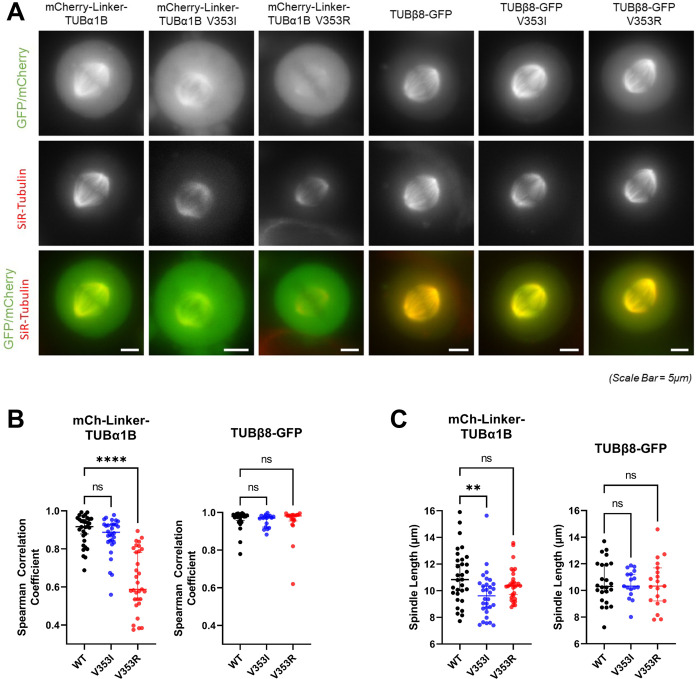
Cells rely heavily on microtubules for several processes, including cell division and molecular trafficking. Mutations in the different tubulin-α and -β proteins that comprise microtubules have been associated with various diseases and are often dominant, sporadic and congenital. While the earliest reported tubulin mutations affect neurodevelopment, mutations are also associated with other disorders such as bleeding disorders and infertility. We performed a systematic survey of tubulin mutations across all isotypes in order to improve our understanding of how they cause disease, and increase our ability to predict their phenotypic effects. Both protein structural analyses and computational variant effect predictors were very limited in their utility for differentiating between pathogenic and benign mutations. This was even worse for those genes associated with non-neurodevelopmental disorders. We selected tubulin-α and -β disease mutations that were most poorly predicted for experimental characterisation. These mutants co-localise to the mitotic spindle in HeLa cells, suggesting they may exert dominant-negative effects by altering microtubule properties. Our results show that tubulin mutations represent a blind spot for current computational approaches, being much more poorly predicted than mutations in most human disease genes. We suggest that this is likely due to their strong association with dominant-negative and gain-of-function mechanisms.


Conflict of interest statement

The authors have declared that no competing interests exist.

Figures

Fig 1
Fig 1. Comparison of the distribution of structural locations between pathogenic and putatively benign tubulin variants.
The proportion of pathogenic and putatively benign gnomAD mutations in each location type for tubulin-α, β and γ globally (A) and for individual isotypes (B). Mutation totals for each group are shown at the bottom, and only isotypes with at least five pathogenic mutations were included. Fisher’s exact tests were used to compare frequencies between gnomAD and pathogenic mutations considering each family and isotype separately. Asterisks indicate a location class with a significantly higher proportion of mutations compared to its corresponding group, where * p < 0.05, ** p < 0.01, *** p < 0.001, **** p < 0.0001.
Fig 2
Fig 2. Visualisation of pathogenic tubulin mutations on three-dimensional structures of tubulin heterodimers.
Structures of tubulin isotypes with at least five identified pathogenic mutations. Coloured residues indicate pathogenic mutations according to their location. The position of the tubulin subunit in relation to the microtubule (MT) is noted at the top. Residues in red denote mutations buried in the protein interior, while light cyan residues are on the surface. Green residues indicate mutations occurring at GTP binding interfaces, while ones in magenta highlight residues on intradimer interfaces. Navy blue and yellow residues mark mutations on residues interacting with microtubule associating proteins (MAPs) and other tubulin dimers, respectively. PDB IDs: 6s8k (for all tubulin-α and β isotypes) and 3cb2 (for TUBγ1). Alternate versions of this figure with the structures rotated 90° and 180° around the y-axis are provided in Figs C and D in S1 Text.
Fig 3
Fig 3. Comparison of predicted changes in protein stability between pathogenic and putatively benign tubulin mutaitons.
ΔΔG values representing the predicted change in free energy of folding were calculated with FoldX considering the structure of the monomeric subunit only. Scores are shown for tubulin-α and -β families globally (A) and in isotypes with at least five identified pathogenic mutations (B). Maroon diamonds indicate the mean ΔΔG values, and mutation totals for each group are also shown at the bottom. The p-values displayed were obtained via unpaired Wilcoxon tests.
Fig 4
Fig 4. Assessment of VEP performance for identification of pathogenic tubulin mutations.
(A) ROC AUC values for each VEP across all tubulin-α and -β isotypes with at least one identified pathogenic mutation, colour coded according to predictor category. (B) Distribution of ROC AUC values across all VEPs for isotypes with at least 10 identified pathogenic missense mutations. Dashed line indicates the performance of a random predictor. Maroon diamonds indicate the mean area.
Fig 5
Fig 5. Comparison of VEP performance on pathogenic mutations in tubulin genes associated with neurodevelopmental vs other disease phenotypes.
(A) Distribution of ROC AUC values across all VEPs for isotypes with mutations linked with neurodevelopmental or other disease phenotypes. The p-value stated was obtained via a paired Wilcoxon test. Maroon diamonds indicate the mean area. (B) ROC AUC values for each VEP in isotypes with mutations associated with neurodevelopmental or other disease phenotypes. Dashed line indicates the performance of a random predictor.
Fig 6
Fig 6. Effects of V353 mutants on microtubules and mitotic spindles in cells.
(A) Representative live-cell images of mitotic HeLa cells after being transfected with fluorescently tagged wild type and mutant tubulin-α1B and tubulin-β8 constructs (green) and incubated with SiR-tubulin (red) (B) Wide linescans across the whole mitotic spindle were taken to measure fluorescence intensity of tubulin across the mitotic spindle compared to total tubulin. For each cell, two-sided Spearman correlations were calculated between both signal intensities. (C) Spindle length measurements for the cells transfected with fluorescently tagged wild-type and mutant tubulin-α1B and tubulin-β8 and measured in (B). For each construct, median values are displayed with 95% confidence intervals. Asterisks indicate Kruskal-Wallis test (with post-hoc Dunn) significance values, ***, P < 0.001; ****, P < 0.0001. Bars, 5μm.

References

    1. Brouhard GJ, Rice LM. Microtubule dynamics: an interplay of biochemistry and mechanics. Nat Rev Mol Cell Bio. 2018;19(7):451–63. doi: 10.1038/s41580-018-0009-y - DOI - PMC - PubMed
    1. Janke C, Magiera MM. The tubulin code and its role in controlling microtubule properties and functions. Nat Rev Mol Cell Biol. 2020;21(6):307–26. doi: 10.1038/s41580-020-0214-3 - DOI - PubMed
    1. Mitchison T, Kirschner M. Dynamic Instability of Microtubule Growth. Nature. 1984;312(5991):237–42. doi: 10.1038/312237a0 - DOI - PubMed
    1. Battaje RR, Panda D. Lessons from bacterial homolog of tubulin, FtsZ for microtubule dynamics. Endocr Relat Cancer. 2017;24(9):T1–T21. doi: 10.1530/ERC-17-0118 - DOI - PubMed
    1. Dyer N. Tubulin and its prokaryotic homologue FtsZ: a structural and functional comparison. Sci Prog. 2009;92(Pt 2):113–37. doi: 10.3184/003685009X461431 - DOI - PMC - PubMed

Publication types