. 2022 Oct 6;29(10):1475-1490.e6.
doi: 10.1016/j.stem.2022.09.008.

A human iPSC-array-based GWAS identifies a virus susceptibility locus in the NDUFA4 gene and functional variants

Affiliations

A human iPSC-array-based GWAS identifies a virus susceptibility locus in the NDUFA4 gene and functional variants

Yuling Han et al. Cell Stem Cell. .

Abstract

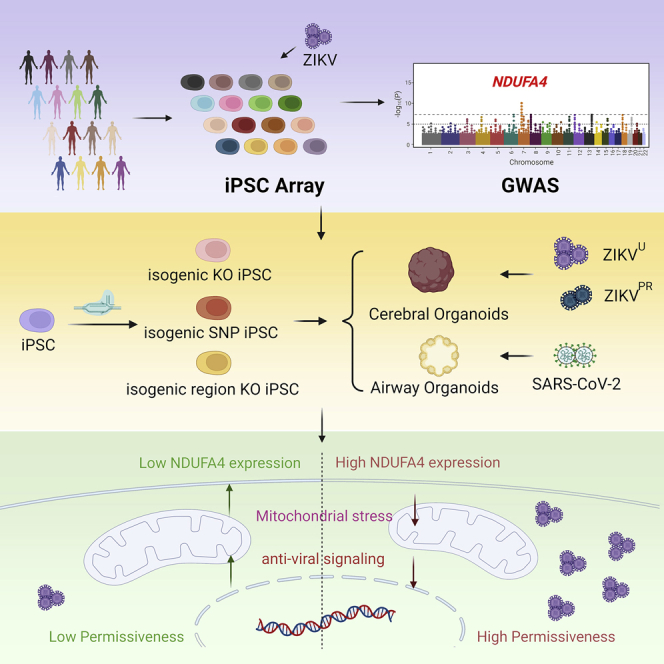
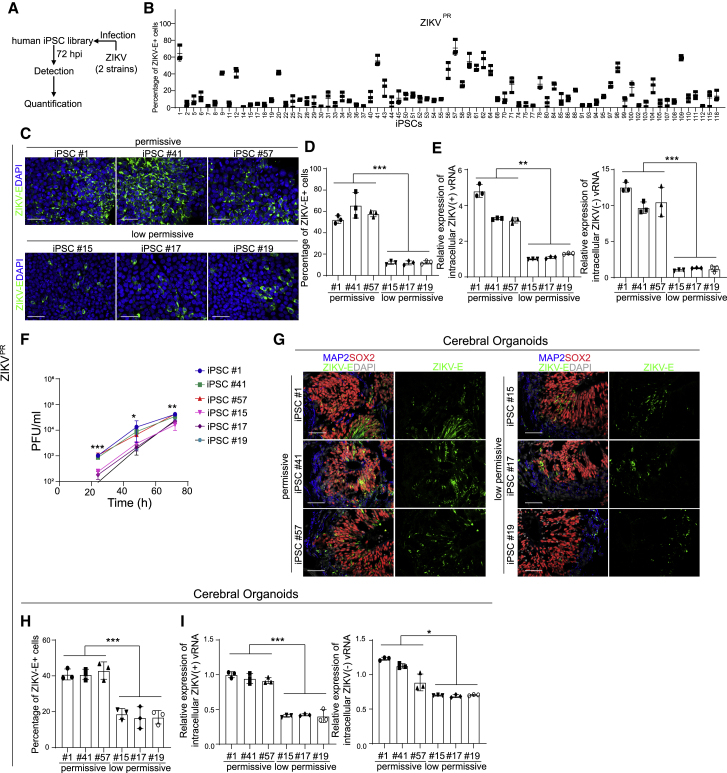
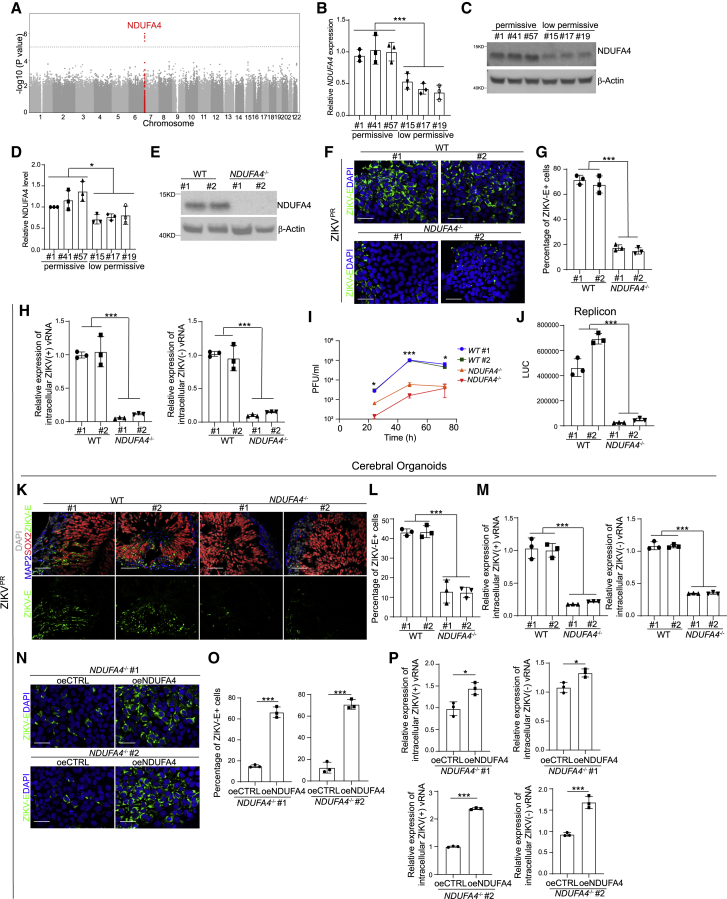
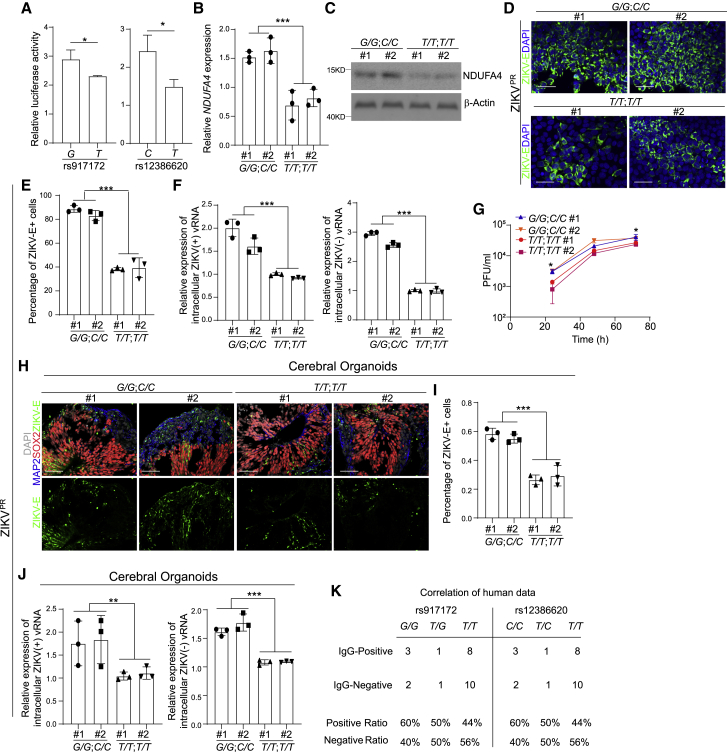
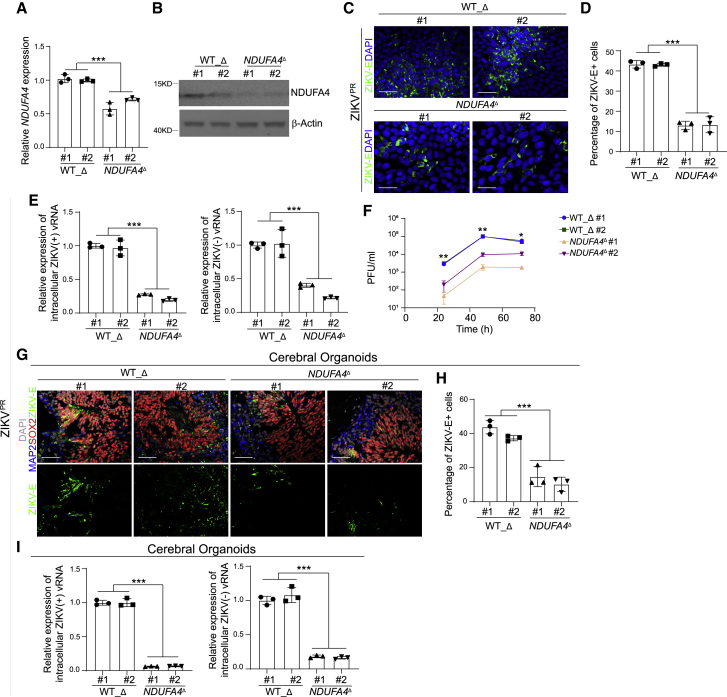
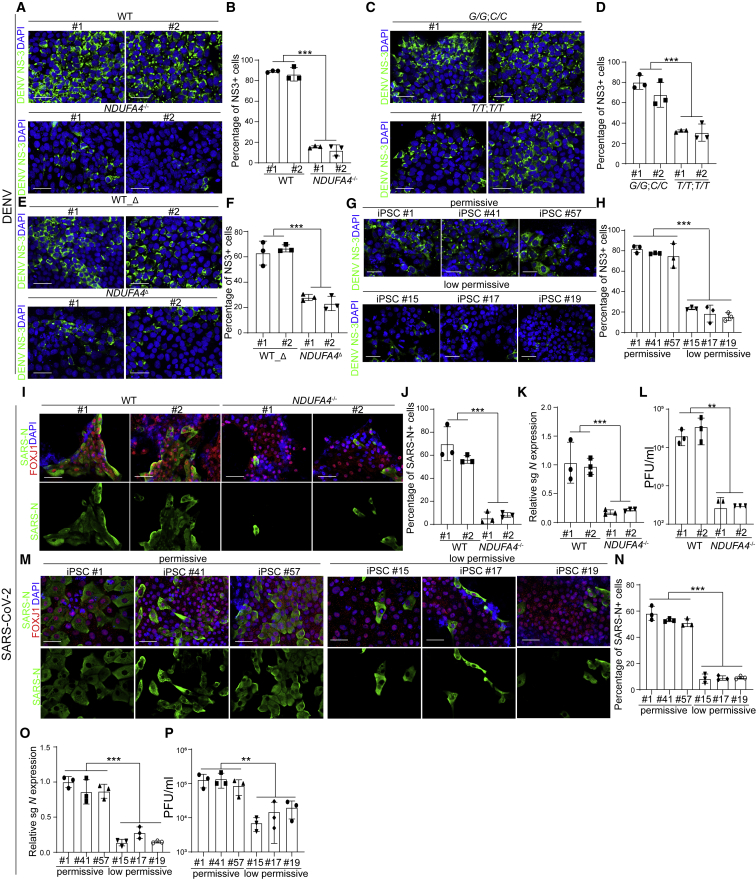
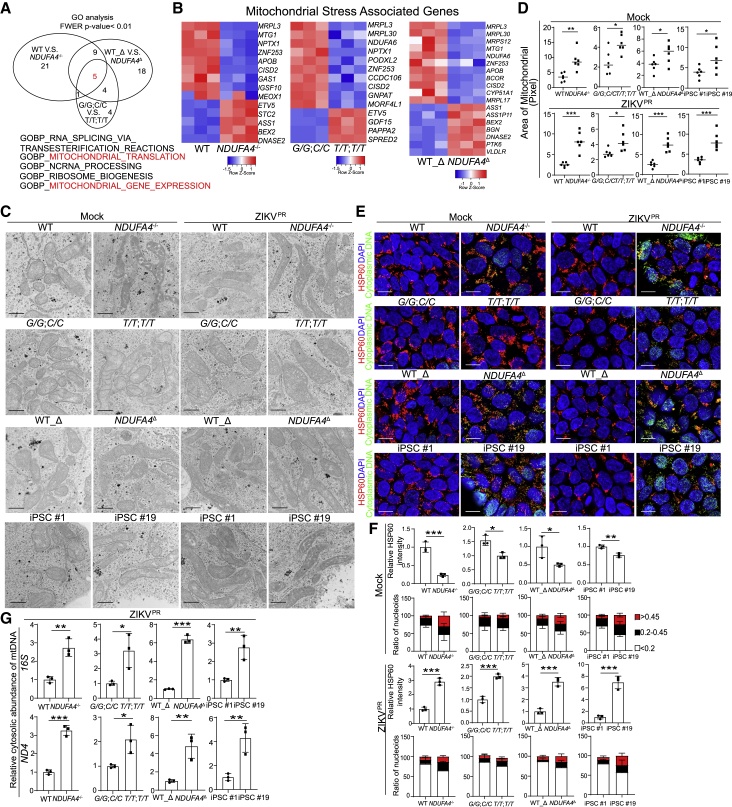
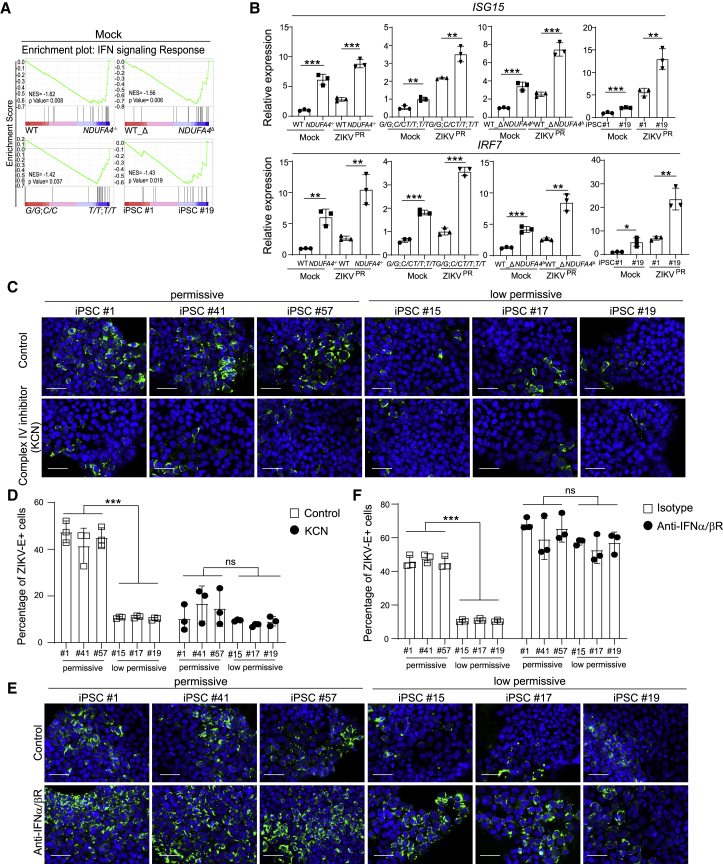
Population-based studies to identify disease-associated risk alleles typically require samples from a large number of individuals. Here, we report a human-induced pluripotent stem cell (hiPSC)-based screening strategy to link human genetics with viral infectivity. A genome-wide association study (GWAS) identified a cluster of single-nucleotide polymorphisms (SNPs) in a cis-regulatory region of the NDUFA4 gene, which was associated with susceptibility to Zika virus (ZIKV) infection. Loss of NDUFA4 led to decreased sensitivity to ZIKV, dengue virus, and SARS-CoV-2 infection. Isogenic hiPSC lines carrying non-risk alleles of SNPs or deletion of the cis-regulatory region lower sensitivity to viral infection. Mechanistic studies indicated that loss/reduction of NDUFA4 causes mitochondrial stress, which leads to the leakage of mtDNA and thereby upregulation of type I interferon signaling. This study provides proof-of-principle for the application of iPSC arrays in GWAS and identifies NDUFA4 as a previously unknown susceptibility locus for viral infection.

Keywords: Dengue Virus; NDUFA4; SARS-CoV-2; genome-wide association study; iPSC array; isogenic hiPSC lines; mtDNA; risk allele; single-nucleotide polymorphism; type I interferon.


Conflict of interest statement

Declaration of interests R.E.S. is on the scientific advisory board of Miromatrix, Inc and Lime Therapeutics and is a paid consultant and speaker for Alnylam, Inc. S.C. and T.E. are the co-founders of OncoBeat, LLC. S.C. is a consultant of Vesaliustx Therapeutics.

Figures

None
Graphical abstract
Figure 1
Figure 1
An iPSC-array-based screen of ZIKV infection (A) Scheme of the iPSC screening. (B) The percentage of ZIKV-E positive cells of all iPSC lines upon ZIKVPR infection (ZIKVPR, Multiplicity of infection [MOI] = 1). Three biological replicates (each replicate includes one well of 96-well plate) were used to calculate the infectivity. (C and D) Representative confocal images (C) and the quantification (D) of ZIKV-E staining of permissive cell lines iPSC #1, iPSC #41, and iPSC #57 and low-permissive cell lines iPSC #15, iPSC #17, and iPSC #19 at 72 hpi (ZIKVPR, MOI = 1). Scale bar, 50 μm. (E) qRT-PCR analysis of (+) and (−) ZIKV vRNA strands of permissive cell lines iPSC #1, iPSC #41, and iPSC #57 and low-permissive cell lines iPSC #15, iPSC #17, and iPSC #19 at 72 hpi (ZIKVPR, MOI = 1). The data was normalized to actin beta (ACTB). (F) Multiple step growth curve of ZIKV in the supernatant of permissive cell lines iPSC #1, iPSC #41, and iPSC #57 and low-permissive cell lines iPSC #15, iPSC #17, and iPSC #19 (ZIKVPR, MOI = 1). (G and H) Representative confocal images (G) and the quantification (H) of ZIKV-E staining in cerebral organoids derived from permissive cell lines iPSC #1, iPSC #41, and iPSC #57 and low-permissive cell lines iPSC #15, iPSC #17, and iPSC #19 (ZIKVPR, 3 × 106 plaque-forming unit [PFU]/mL). Cerebral organoids were age-matched and collected at day 20, then infected with ZIKV for 24 h. After removal of virus-containing medium, organoids were maintained in organoid medium for an additional 3 days. Scale bar, 50 μm. (I) qRT-PCR analysis of (+) and (−) ZIKV vRNA strands in cerebral organoids derived from permissive cell lines iPSC #1, iPSC #41, and iPSC #57 and low-permissive cell lines iPSC #15, iPSC #17, and iPSC #19 (ZIKVPR, 3 × 106 PFU/mL). Cerebral organoids were age-matched and collected at day 20, then infected with ZIKV for 24 h. After removal of virus-containing medium, organoids were maintained in organoid medium for an additional 3 days. The value was normalized to ACTB. Data are representative of at least three independent experiments. Data are shown as mean ± SD. p values were calculated by unpaired two-tailed Student’s t test; p < 0.05, ∗∗p < 0.01, and ∗∗∗p < 0.001. See also Figure S1.
Figure 2
Figure 2
Loss or reduction of NDUFA4 impairs ZIKV replication in vitro and in vivo (A) Manhattan plot with highlighted risk locus. (B) qRT-PCR analysis of NDUFA4 mRNA expression levels in permissive iPSC lines iPSC #1, iPSC #41, and iPSC #57 and low-permissive cell lines iPSC #15, iPSC #17, and iPSC #19. The value was normalized to ACTB. (C and D) Western blotting analysis (C) and the quantification (D) of NDUFA4 protein expression levels in permissive iPSC lines iPSC #1, iPSC #41, and iPSC #57 and low-permissive cell lines iPSC #15, iPSC #17, and iPSC #19. β-Actin was used as a loading control. (E) Western blotting analysis of NDUFA4 expression levels in WT or NDUFA4−/− hiPSCs. β-Actin was used as a loading control. (F and G) Representative confocal images (F) and the quantification (G) of ZIKV-E staining in ZIKV-infected WT or NDUFA4−/− hiPSCs at 72 hpi (ZIKVPR, MOI = 1). Scale bar, 50 μm. (H) qRT-PCR analysis of (+) and (−) ZIKV vRNA strands in ZIKV-infected WT or NDUFA4−/− hiPSCs at 72 hpi (ZIKVPR, MOI = 1). The value was normalized to ACTB. (I) Multiple step growth curve of ZIKV virus in the supernatant of ZIKV-infected WT or NDUFA4−/− hiPSCs (ZIKVPR, MOI = 1). (J) Luciferase activity of WT or NDUFA4−/− hiPSCs at 24 h after transfection with ZIKV replicon. (K and L) Representative confocal images (K) and the quantification (L) of ZIKV-E staining in cerebral organoids derived from WT or NDUFA4−/− hiPSCs (ZIKVPR, 3 × 106 PFU/mL). Cerebral organoids were age-matched and collected at day 20, then infected with ZIKV for 24 h. After removal of virus-containing medium, organoids were maintained in organoid medium for an additional 3 days. Scale bar, 50 μm. (M) qRT-PCR analysis of (+) and (−) ZIKV vRNA strands in cerebral organoids derived from WT or NDUFA4−/− hiPSCs at 72 hpi (ZIKVPR, 3 × 106 PFU/mL). Cerebral organoids were age-matched and collected at day 20, then infected with ZIKV for 24 h. After removal of virus-containing medium, organoids were maintained in organoid medium for an additional 3 days. The value was normalized to ACTB. (N and O) Representative images (N) and the quantification (O) of ZIKV-E staining in ZIKV-infected NDUFA4−/−-oeCTRL and NDUFA4−/−-oeNDUFA4 hiPSCs at 72 hpi (ZIKVPR, MOI = 1). Scale bar, 50 μm. (P) qRT-PCR analysis of (+) and (−) ZIKV vRNA strands in ZIKV-infected NDUFA4−/−-oeCTRL and NDUFA4−/−-oeNDUFA4 hiPSCs at 72 hpi (ZIKVPR, MOI = 1). The value was normalized to ACTB. Data are representative of at least three independent experiments. Data are shown as mean ± SD. For comparison of permissive and low-permissive lines, p values were calculated by unpaired two-tailed Student’s t test. For comparison of WT and KO lines, p values were calculated by two-way ANOVA analysis. For comparison of control and overexpression groups, p values were calculated by unpaired two-tailed Student’s t test; p < 0.05, ∗∗∗p < 0.001. See also Figure S2.
Figure 3
Figure 3
Risk alleles of rs917172 and rs12386620 cause increased sensitivity to ZIKV infection (A) Relative luciferase activity of rs917172 (risk: G, non-risk: T) and rs12386620 (risk: C, non-risk: T) in 293T cells. (B) Relative NDUFA4 mRNA expression in hiPSCs carrying risk (G/G; C/C) and non-risk (T/T; T/T) alleles. The value was normalized to ACTB. (C) Western blotting analysis of NDUFA4 protein expression levels in hiPSCs carrying risk (G/G; C/C) and non-risk (T/T; T/T) alleles. β-Actin was used as a loading control. (D and E) Representative confocal images (D) and the quantification (E) of ZIKV-E staining in ZIKV-infected hiPSCs carrying risk (G/G; C/C) and non-risk (T/T; T/T) alleles at 72 hpi (ZIKVPR, MOI = 1). Scale bar, 50 μm. (F) qRT-PCR analysis of (+) and (−) ZIKV vRNA strands in ZIKV-infected hiPSCs carrying risk (G/G; C/C) and non-risk (T/T; T/T) alleles at 72 hpi (ZIKVPR, MOI = 1). The value was normalized to ACTB. (G) Multiple step growth curve of ZIKV in the supernatant of ZIKV-infected hiPSCs carrying risk (G/G; C/C) and non-risk (T/T; T/T) alleles (ZIKVPR, MOI = 1). (H and I) Representative confocal images (H) and the quantification (I) of ZIKV-E staining in cerebral organoids derived from hiPSCs carrying risk (G/G; C/C) and non-risk (T/T; T/T) alleles (ZIKVPR, 3 × 106 PFU/mL). Cerebral organoids were age-matched and collected at day 20, then infected with ZIKV for 24 h. After removal of virus-containing medium, organoids were maintained in organoid medium for an additional 3 days. Scale bar = 50 μm. (J) qRT-PCR analysis of (+) and (−) ZIKV vRNA strands of cerebral organoids derived from hiPSCs carrying risk (G/G; C/C) and non-risk (T/T; T/T) alleles (ZIKVPR, 3 × 106 PFU/mL). Cerebral organoids were age-matched and collected at day 20, then infected with ZIKV for 24 h. After removal of virus-containing medium, organoids were maintained in organoid medium for an additional 3 days. The value was normalized to ACTB. (K) The percentage of IgG+ or IgM+ patients carrying risk or non-risk allele of rs917172 and rs12386620. Data are representative of at least three independent experiments. Data are shown as mean ± SD. For comparison with more than two samples, p values were calculated by two-way ANOVA analysis. For comparison with two samples, p values were calculated by unpaired two-tailed Student’s t test; p < 0.05, ∗∗p < 0.01 and ∗∗∗p < 0.001. See also Figure S3.
Figure 4
Figure 4
Deletion of a cis-regulatory region of NDUFA4 decreased the infection of ZIKV infection (A) qRT-PCR analysis of NDUFA4 mRNA expression levels in WT_Δ and NDUFA4Δ hiPSCs. The value was normalized to ACTB. (B) Western blotting analysis of NDUFA4 protein expression levels in WT_Δ and NDUFA4Δ hiPSCs. β-Actin was used as a loading control. (C and D) Representative confocal images (C) and the quantification (D) of ZIKV-E staining in ZIKV-infected WT_Δ and NDUFA4Δ hiPSCs at 72 hpi (ZIKVPR, MOI = 1). Scale bar, 50 μm. (E) qRT-PCR analysis of (+) and (−) ZIKV vRNA strands in ZIKV-infected WT_Δ and NDUFA4Δ hiPSCs at 72 hpi (ZIKVPR, MOI = 1). The value was normalized to ACTB. (F) Multiple step growth curve of ZIKV in the supernatant of ZIKV-infected WT_Δ and NDUFA4Δ hiPSCs (ZIKVPR, MOI = 1). (G and H) Representative images (G) and the quantification (H) of ZIKV-E staining in cerebral organoids derived from WT_Δ and NDUFA4Δ hiPSCs (ZIKVPR, 3 × 106 PFU/mL). Cerebral organoids were age-matched and collected at day 20, then infected with ZIKV for 24 h. After removal of virus-containing medium, organoids were maintained in organoid medium for an additional 3 days. Scale bar, 50 μm. (I) qRT-PCR analysis of (+) and (−) ZIKV vRNA strands in cerebral organoids derived from WT_Δ and NDUFA4Δ hiPSCs (ZIKVPR, 3 × 106 PFU/mL). Cerebral organoids were age-matched and collected at day 20, then infected with ZIKV for 24 h. After removal of virus-containing medium, organoids were maintained in organoid medium for an additional 3 days. The value was normalized to ACTB. Data are representative of at least three independent experiments. Data are shown as mean ± SD. p values were calculated by two-way ANOVA analysis; p < 0.05, ∗∗p < 0.01 and ∗∗∗p < 0.001. See also Figure S4.
Figure 5
Figure 5
NDUFA4 is associated with DENV and SARS-CoV-2 infection (A and B) Representative confocal images (A) and the quantification (B) of DENV NS3 staining in ZIKV-infected WT or NDUFA4−/− hiPSCs at 72 hpi (DENV, MOI = 1). Scale bar, 50 μm. (C and D) Representative confocal images (C) and the quantification (D) of DENV NS3 staining in hiPSCs carrying risk (G/G; C/C) or non-risk (T/T; T/T) alleles at 72 hpi (DENV, MOI = 1). Scale bar, 50 μm. (E and F) Representative confocal images (E) and the quantification (F) of DENV NS3 staining in DENV-infected WT_Δ or NDUFA4Δ hiPSCs at 72 hpi (DENV, MOI = 1). Scale bar, 50 μm. (G and H) Representative confocal images (G) and the quantification (H) of DENV NS3 staining in DENV-infected permissive cell lines iPSC #1, iPSC #41, and iPSC #57 or low-permissive cell lines iPSC #15, iPSC #17, and iPSC #19 at 72 hpi (DENV, MOI = 1). Scale bar, 50 μm. (I and J) Representative confocal images (I) and the quantification (J) of SARS-N in FOXJ1+ ciliated cells in airway organoids derived from WT or NDUFA4−/− hiPSCs at 24 hpi (SARS-CoV-2, MOI = 0.1). (K) Relative expression of viral subgenomic RNA (N) transcription in SARS-CoV-2-infected airway organoids derived from WT or NDUFA4−/− hiPSCs at 24 hpi (SARS-CoV-2, MOI = 0.1). The value was normalized to ACTB. (L) Viral titers of SARS-CoV-2 infected airway organoids derived from WT or NDUFA4−/− hiPSCs at 24 hpi (SARS-CoV-2, MOI = 0.05). (M and N) Representative confocal images (M) and the quantification (N) of SARS-N in FOXJ1+ ciliated cells in airway organoids derived from permissive cell lines iPSC #1, iPSC #41, or iPSC #57 and low-permissive cell lines iPSC #15, iPSC #17, and iPSC #19 at 24 hpi (SARS-CoV-2, MOI = 0.1). (O) Relative expression level of viral subgenomic RNA (N) transcripts in SARS-CoV-2-infected airway organoids derived from permissive cell lines iPSC #1, iPSC #41, and iPSC #57 or low-permissive cell lines: iPSC #15, iPSC #17, and iPSC #19 at 24 hpi (SARS-CoV-2, MOI = 0.1). The value was normalized to ACTB. (P) Viral titers of SARS-CoV-2-infected airway organoids derived from permissive cell lines iPSC #1, iPSC #41, and iPSC #57 or low-permissive cell lines iPSC #15, iPSC #17, and iPSC #19 at 24 hpi (SARS-CoV-2, MOI = 0.05). Data are representative of at least three independent experiments. Data are shown as mean ± SD. For permissive and low-permissive cell lines, p values were calculated by unpaired two-tailed Student’s t test. For other figure panels, p values were calculated by two-way ANOVA analysis; ∗∗p < 0.01, and ∗∗∗p < 0.001. See also Figure S5.
Figure 6
Figure 6
Loss or reduction of NDUFA4 causes mitochondrial DNA leakage (A) Correlation of pathways analyzed by Gene Ontology analysis of hiPSCs. Five pathways are enriched in all 3 groups: WT versus NDUFA4−/−, risk (G/G; C/C) versus non-risk (T/T; T/T), and WT_Δ versus NDUFA4Δ. (B) Heatmap of mitochondrial stress signature genes in 3 groups of hiPSCs. 3 groups: WT versus NDUFA4−/−, risk (G/G; C/C) versus non-risk (T/T; T/T), and WT_Δ versus NDUFA4Δ. (C and D) Representative electron microscopy images (C) and the quantification of mitochondrial size (D) of iPSC lines with mock or ZIKV infection at 48 hpi (ZIKVPR, MOI = 1). 4 groups: WT versus NDUFA4−/−, risk (G/G; C/C) versus non-risk (T/T; T/T), WT_Δ versus NDUFA4Δ, and iPSC #1 versus iPSC #19. Scale bars, 500 nm. (E) Representative confocal images of hiPSCs at 48 hpi with mock or ZIKV infection stained with anti-HSP60 or anti-DNA antibodies (ZIKVPR, MOI = 1). 4 groups: WT versus NDUFA4−/−, risk (G/G; C/C) versus non-risk (T/T; T/T), WT_Δ versus NDUFA4Δ, and iPSC #1 versus iPSC #19. Scale bar, 10 μm. (F) Quantification of HSP60 staining intensity and nucleoid area in (E) in mock or infected conditions (ZIKVPR, MOI = 1). (G) qPCR analysis of mitochondrial DNA leakage in cytoplasm after ZIKV infection in hiPSCs at 48 hpi (ZIKVPR, MOI = 1). 4 groups: WT versus NDUFA4−/−, risk (G/G; C/C) versus non-risk (T/T; T/T), WT_Δ versus NDUFA4Δ, and iPSC #1 versus iPSC #19. Data are representative of at least three independent experiments. Data are shown as mean ± SD. p values were calculated by unpaired two-tailed Student’s t test; p < 0.05, ∗∗p < 0.01, and ∗∗∗p < 0.001. See also Figure S6.
Figure 7
Figure 7
Loss or reduction of NDUFA4 triggers type I interferon signaling (A) Gene Set Enrichment Analysis of type I interferon signal pathway in 4 groups of hiPSCs. 4 groups: WT versus NDUFA4−/−, risk (G/G; C/C) versus non-risk (T/TT/T), WT_Δ versus NDUFA4Δ, and iPSC #1 versus iPSC #19. (B) qRT-PCR analysis of ISG15 and IRF7 mRNA expression levels with mock or ZIKV infection at 72 hpi (ZIKVPR, MOI = 1). 4 groups: WT versus NDUFA4−/−, risk (G/G; C/C) versus non-risk (T/T; T/T), WT_Δ versus NDUFA4Δ, and iPSC #1 versus iPSC #19. The value was normalized to ACTB. (C and D) Representative confocal images (C) and the quantification (D) of ZIKV-E staining of permissive cell lines iPSC #1, iPSC #41, and iPSC #57 and low-permissive cell lines iPSC #15, iPSC #17, and iPSC #19 treated with potassium cyanide (KCN) at 72 hpi (ZIKVPR, MOI = 1). Scale bar, 50 μm. (E and F) Representative confocal images (E) and the quantification (F) of ZIKV-E staining of permissive cell lines iPSC #1, iPSC #41, and iPSC #57 and low-permissive cell lines: iPSC #15, iPSC #17, and iPSC #19 treated with blocking antibodies of IFNAR at 72 hpi (ZIKVPR, MOI = 1). Scale bar, 50 μm. Data are representative of at least three independent experiments. Data are shown as mean ± SD. p values were calculated by unpaired two-tailed Student’s t test; p < 0.05, ∗∗p < 0.01, and ∗∗∗p < 0.001. See also Figure S7.

References

    1. Abdulrahman A., Mallah S.I., Alqahtani M. COVID-19 viral load not associated with disease severity: findings from a retrospective cohort study. BMC Infect. Dis. 2021;21:688. doi: 10.1186/s12879-021-06376-1. - DOI - PMC - PubMed
    1. Balsa E., Marco R., Perales-Clemente E., Szklarczyk R., Calvo E., Landázuri M., Enríquez J. NDUFA4 is a subunit of complex IV of the mammalian electron transport chain. Cell Metab. 2012;16:378–386. doi: 10.1016/j.cmet.2012.07.015. - DOI - PubMed
    1. Blanco-Melo D., Nilsson-Payant B.E., Liu W.C., Uhl S., Hoagland D., Moller R., Jordan T.X., Oishi K., Panis M., Sachs D., et al. Imbalanced Host Response to SARS-CoV-2 Drives Development of COVID-19. Cell. 2020;181:1036–1045. - PMC - PubMed
    1. Duan X., Tang X., Nair M.S., Zhang T., Qiu Y., Zhang W., Wang P., Huang Y., Xiang J., Wang H., et al. An airway organoid-based screen identifies a role for the HIF1α-glycolysis axis in SARS-CoV-2 infection. Cell Rep. 2021;37 doi: 10.1016/j.celrep.2021.109920. - DOI - PMC - PubMed
    1. Butler A., Hoffman P., Smibert P., Papalexi E., Satija R. Integrating single-cell transcriptomic data across different conditions, technologies, and species. Nat Biotechnol. 2018;36:411–420. - PMC - PubMed

Publication types