. 2022 Oct 20;29(10):1517-1531.e7.
doi: 10.1016/j.chembiol.2022.09.002. Epub 2022 Oct 6.

Targeting telomerase reverse transcriptase with the covalent inhibitor NU-1 confers immunogenic radiation sensitization

Affiliations

Targeting telomerase reverse transcriptase with the covalent inhibitor NU-1 confers immunogenic radiation sensitization

Yue Liu et al. Cell Chem Biol. .

Abstract

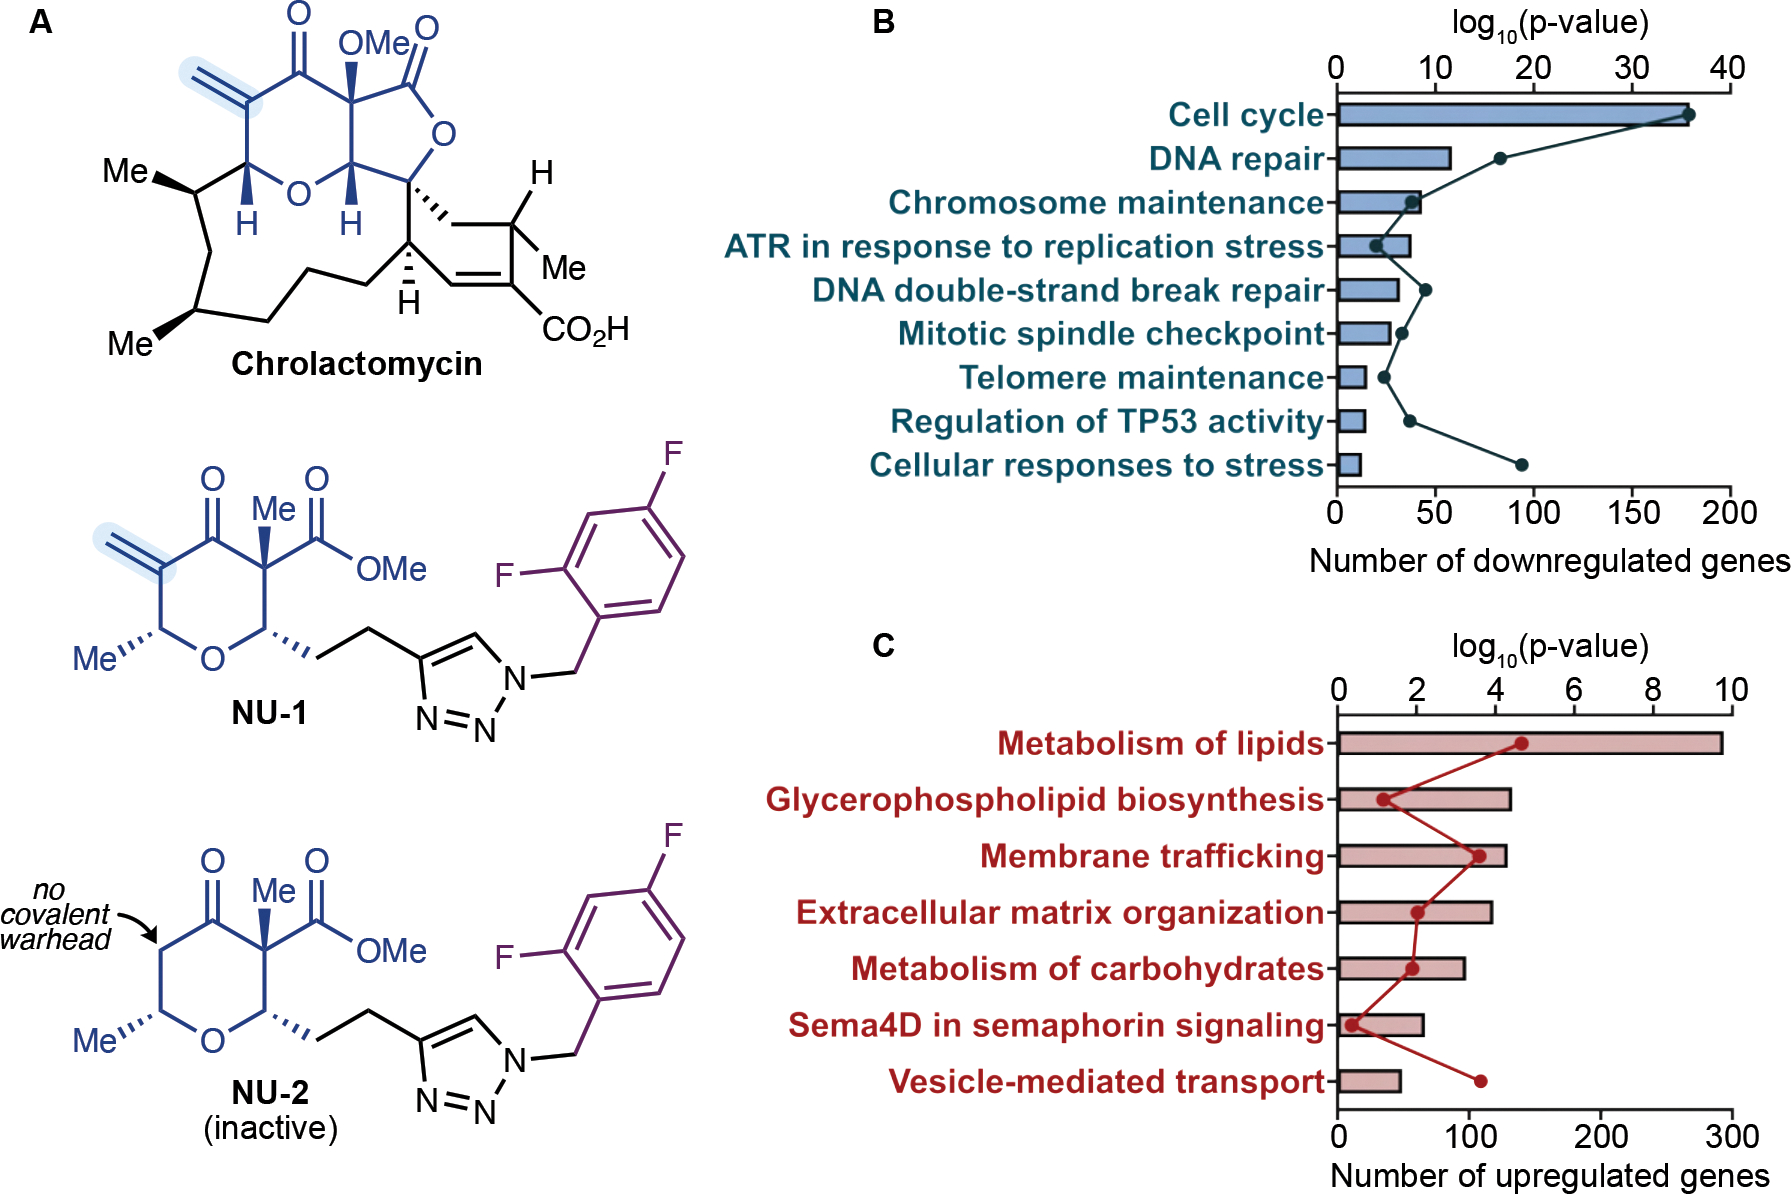
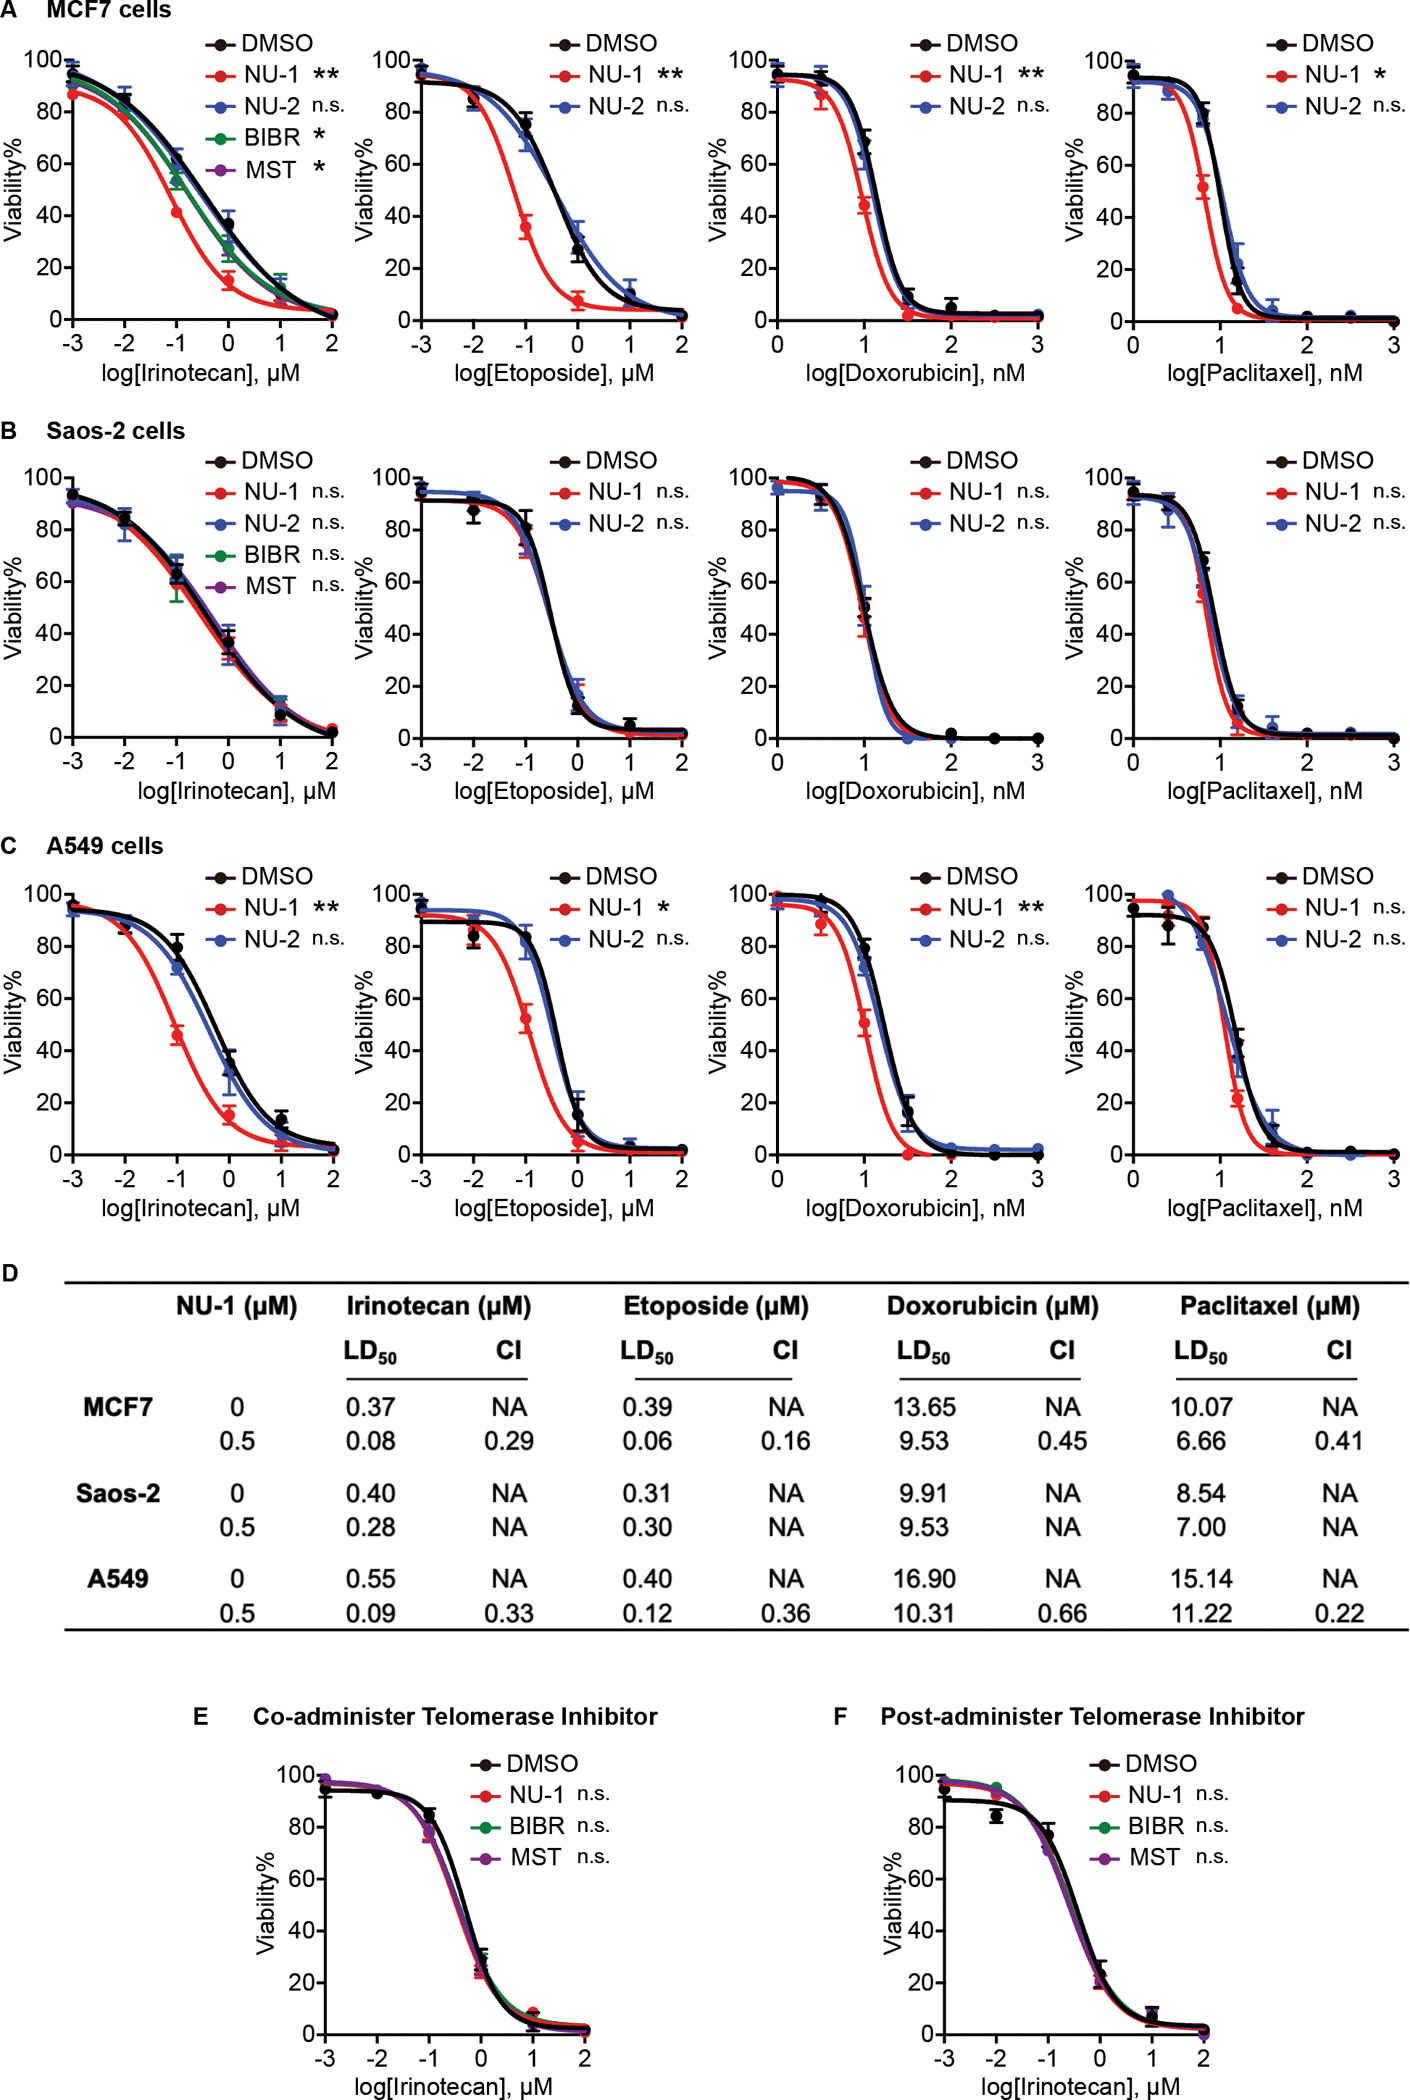
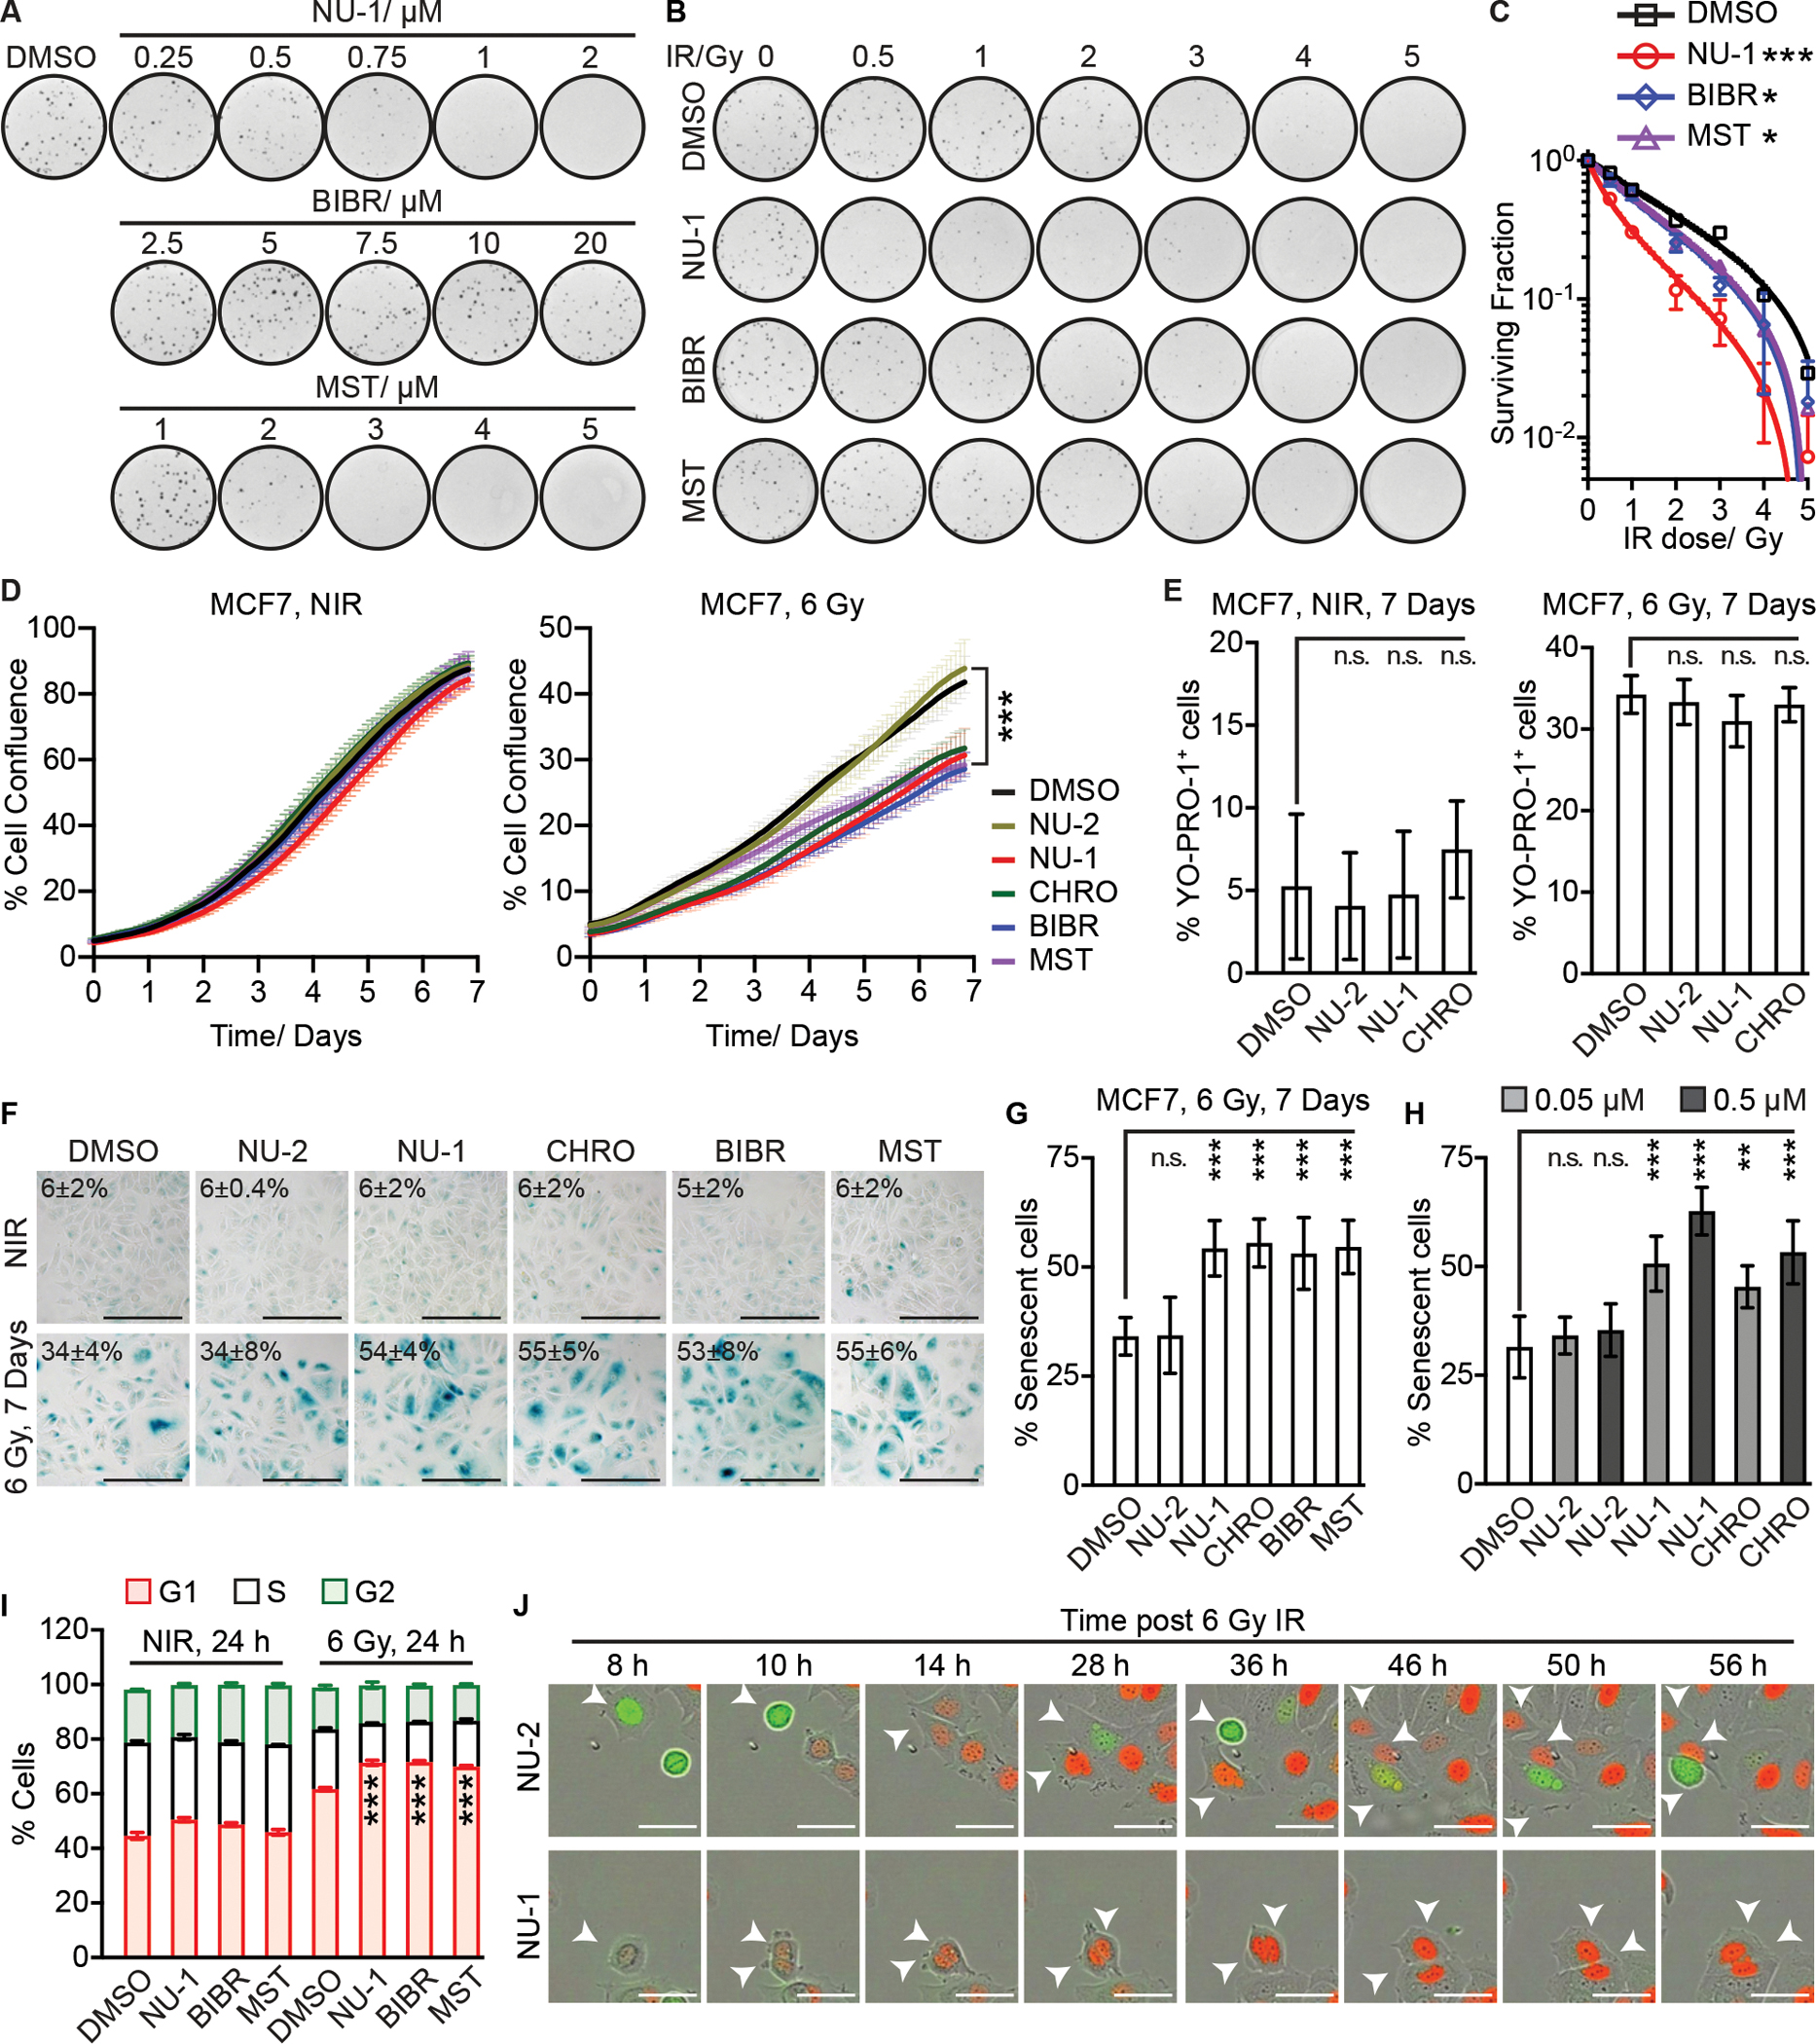
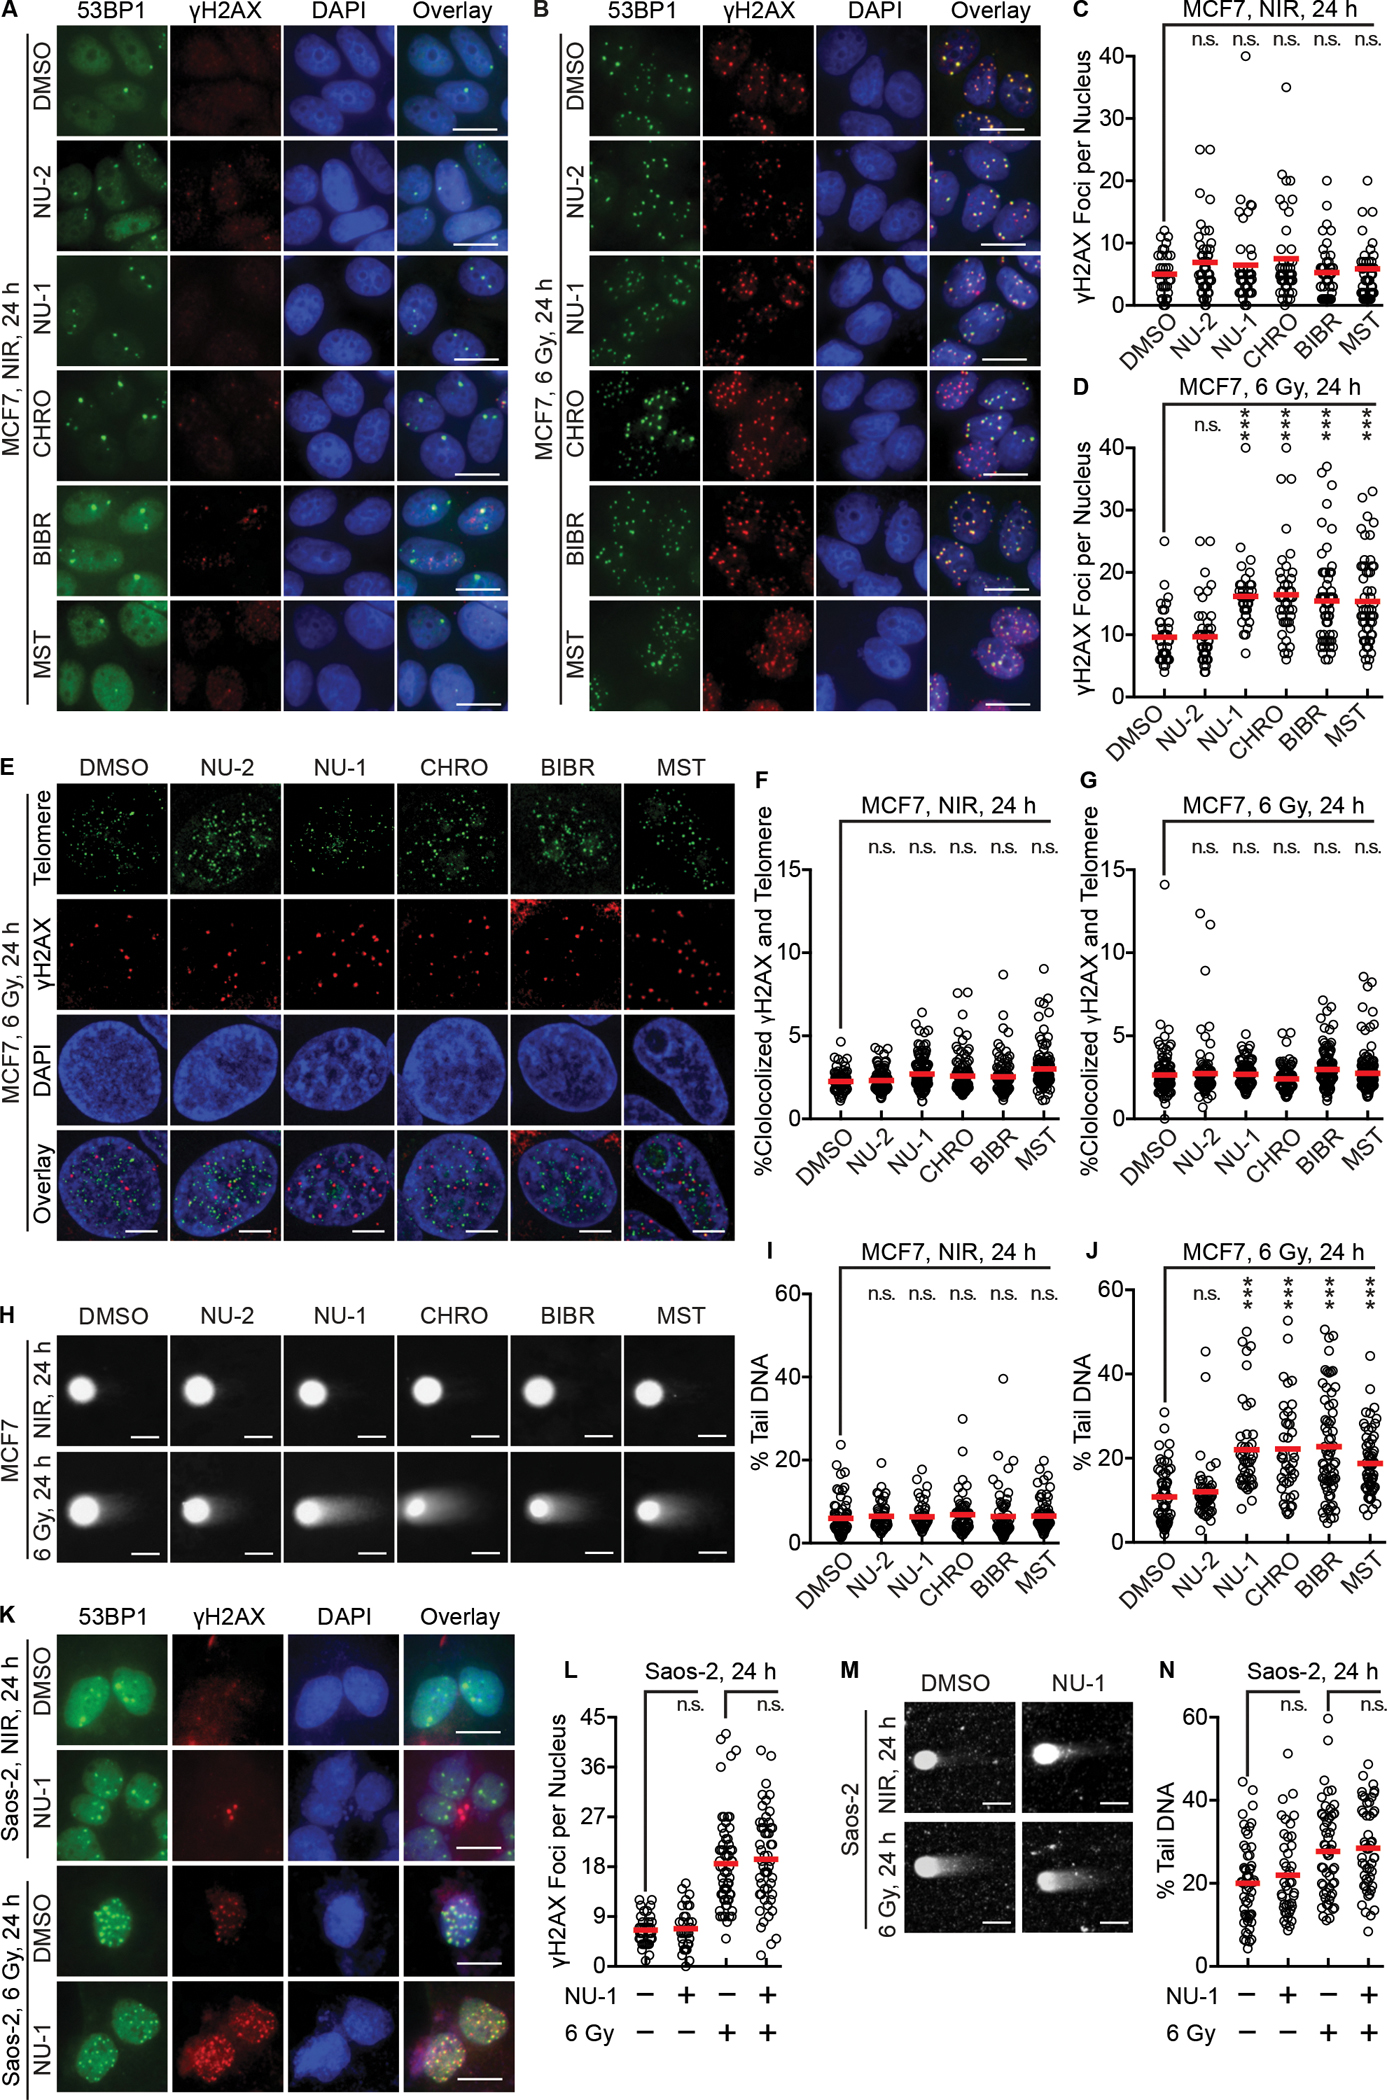
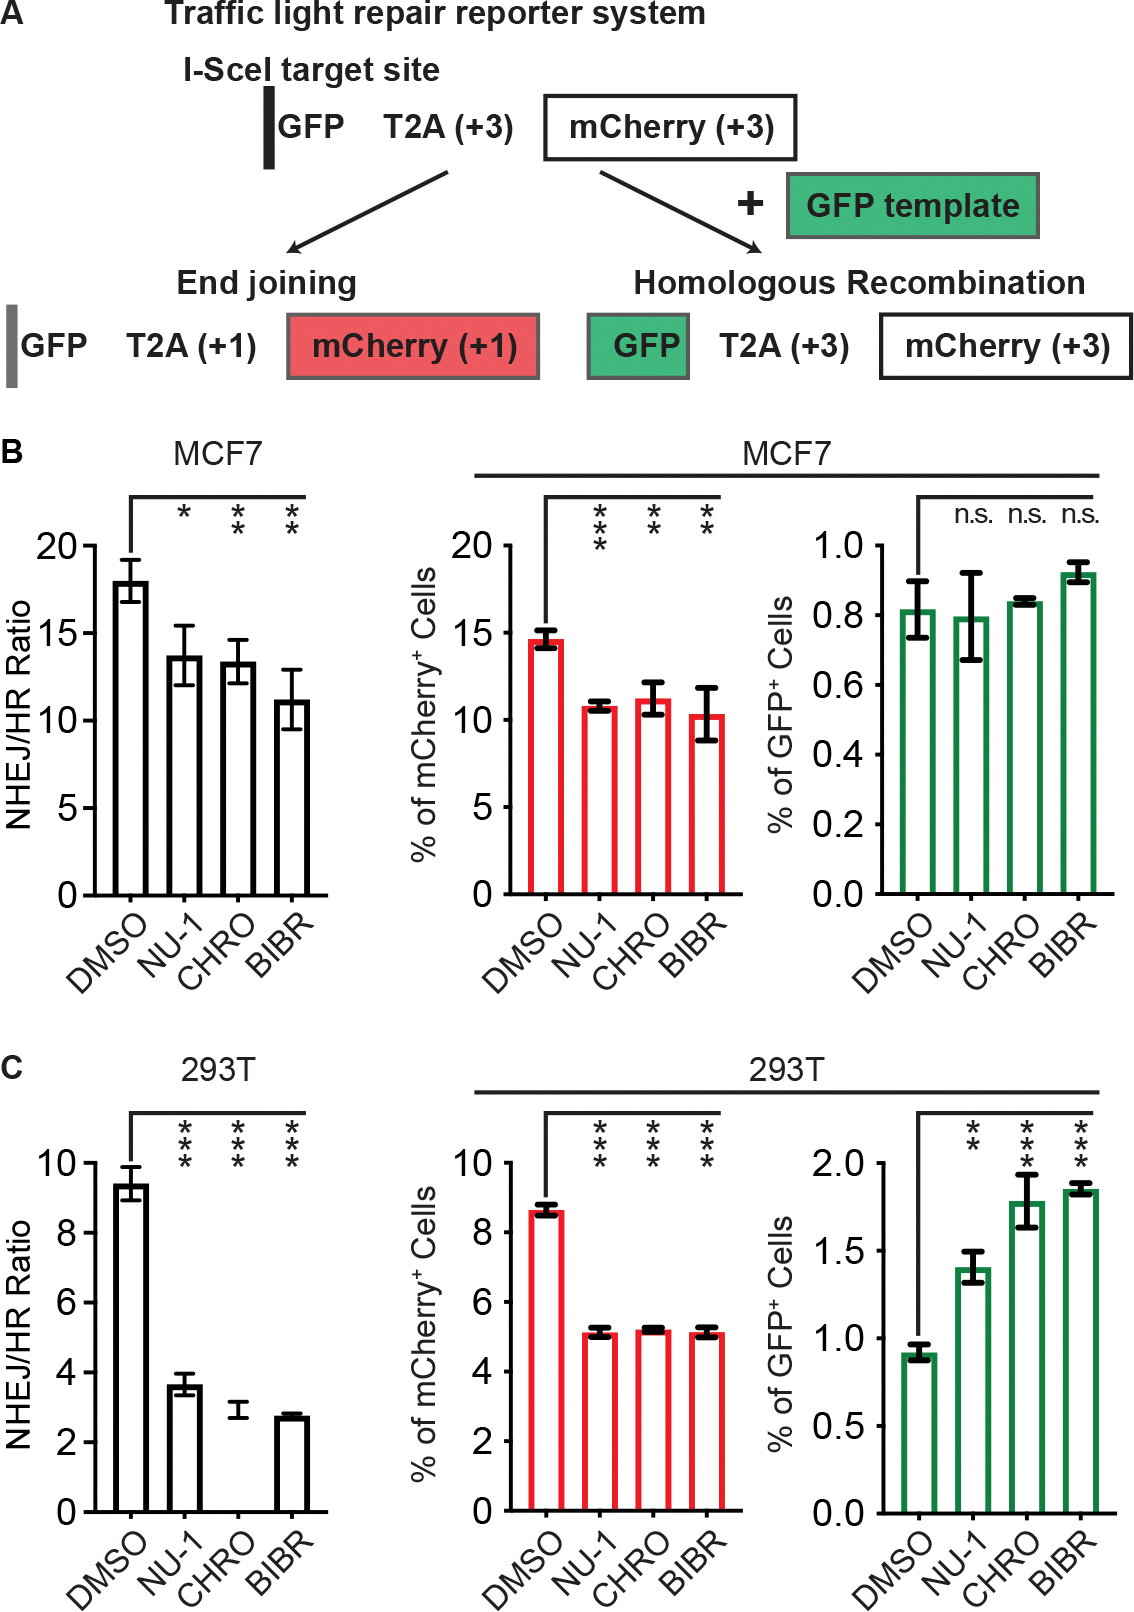
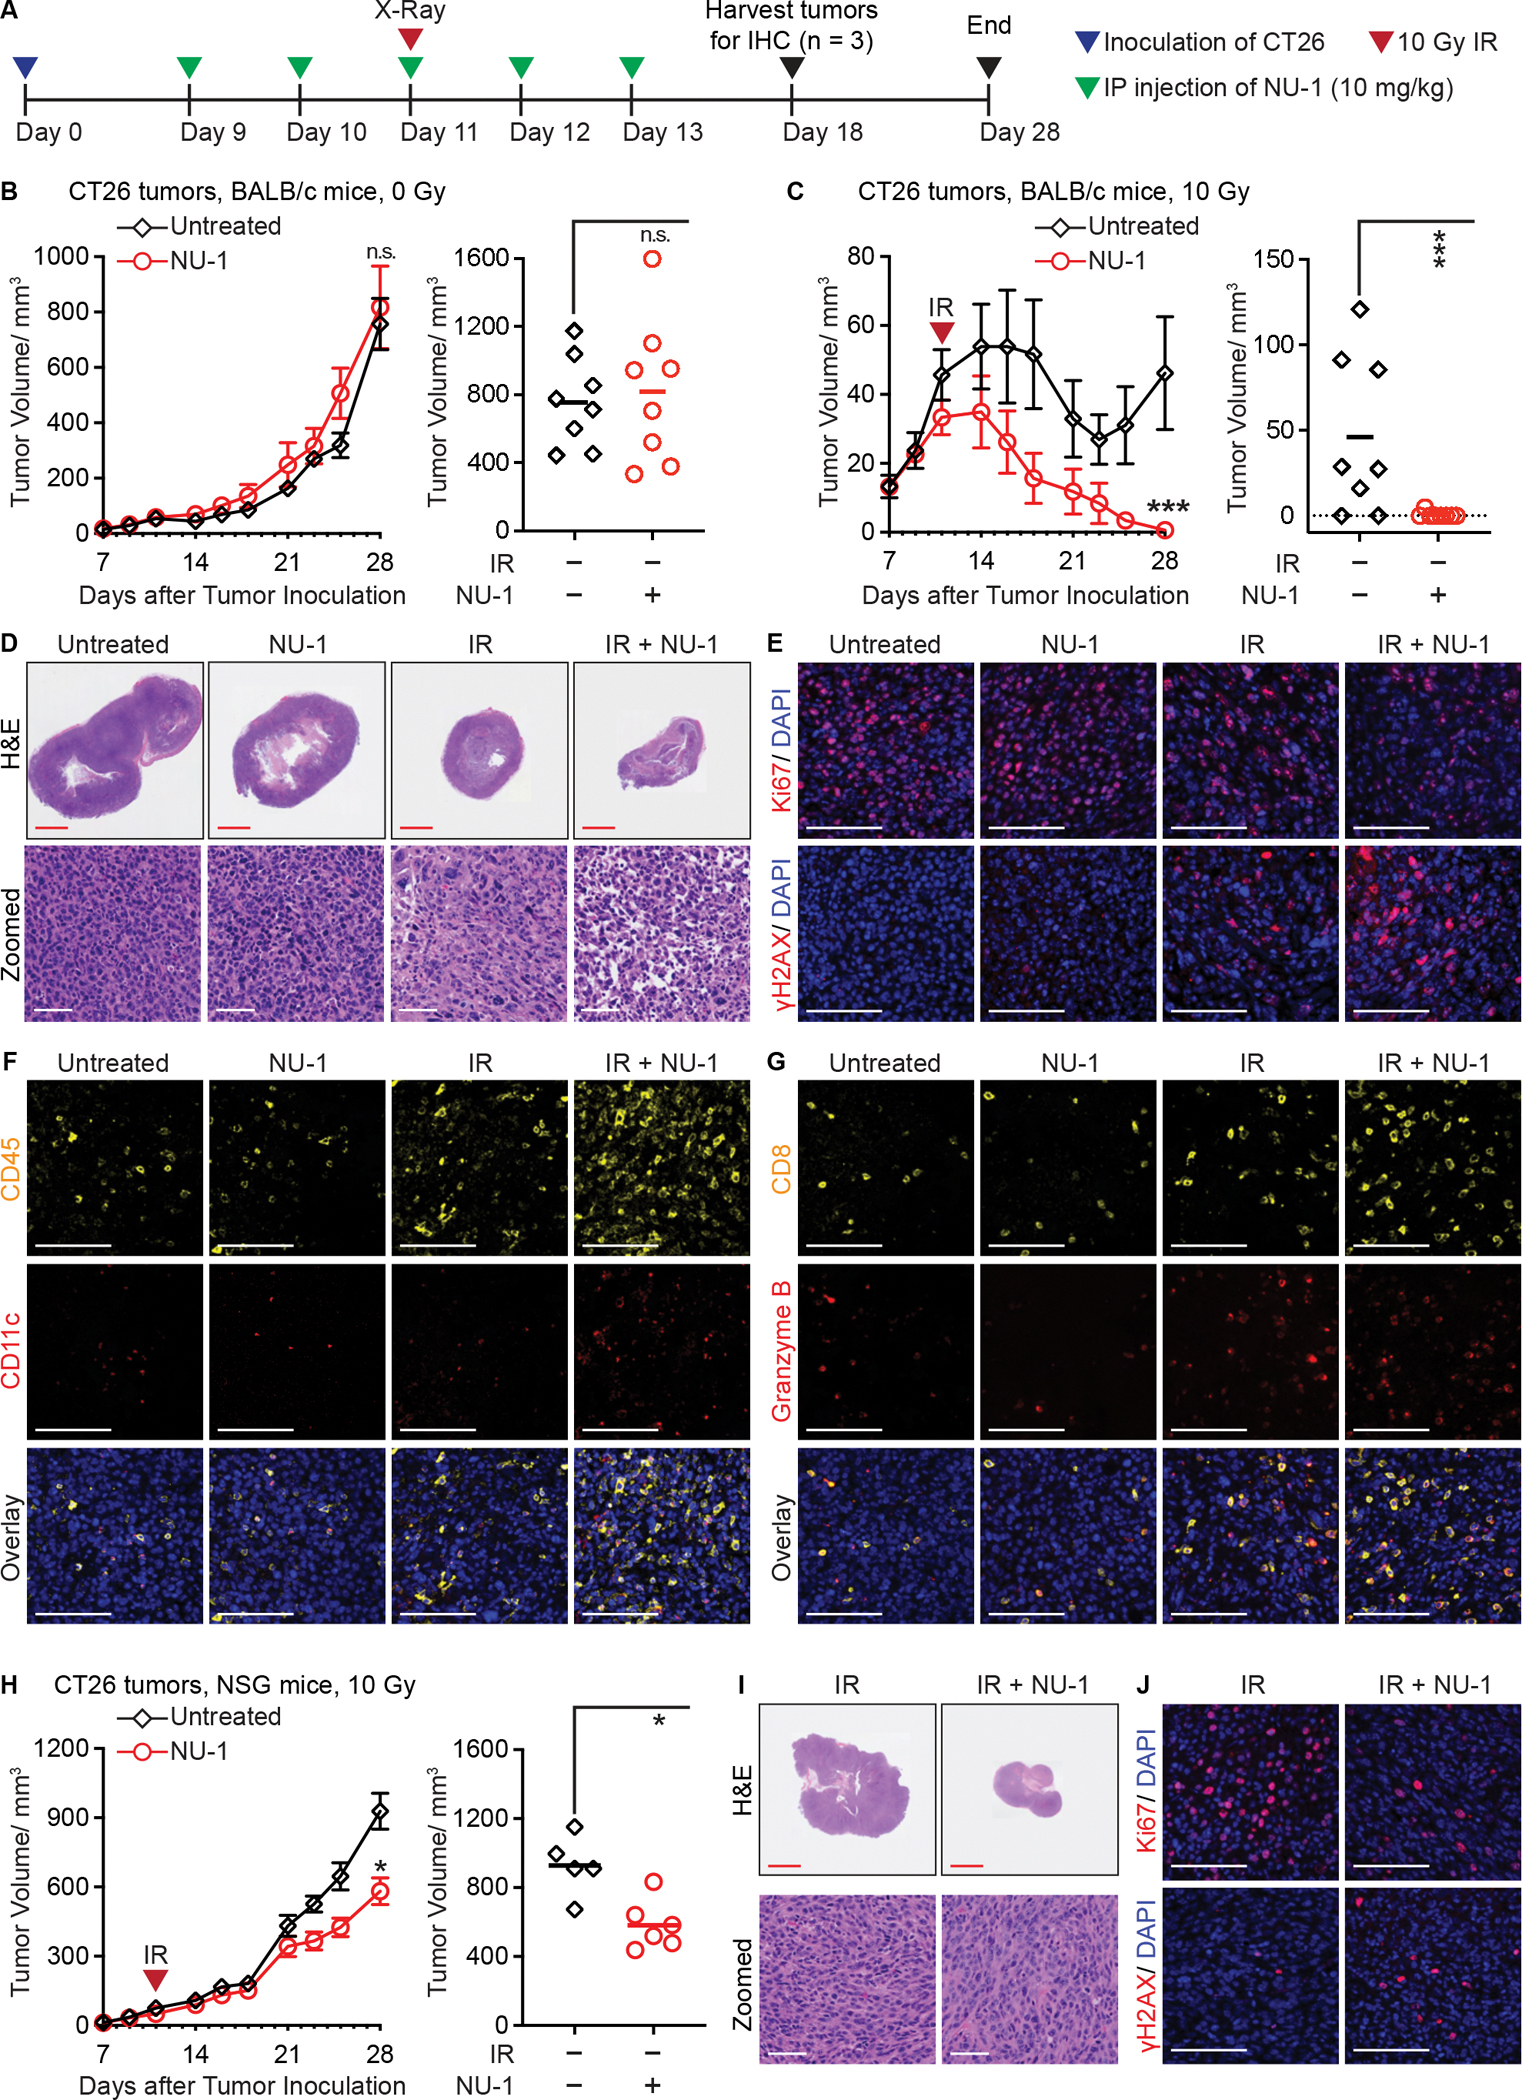
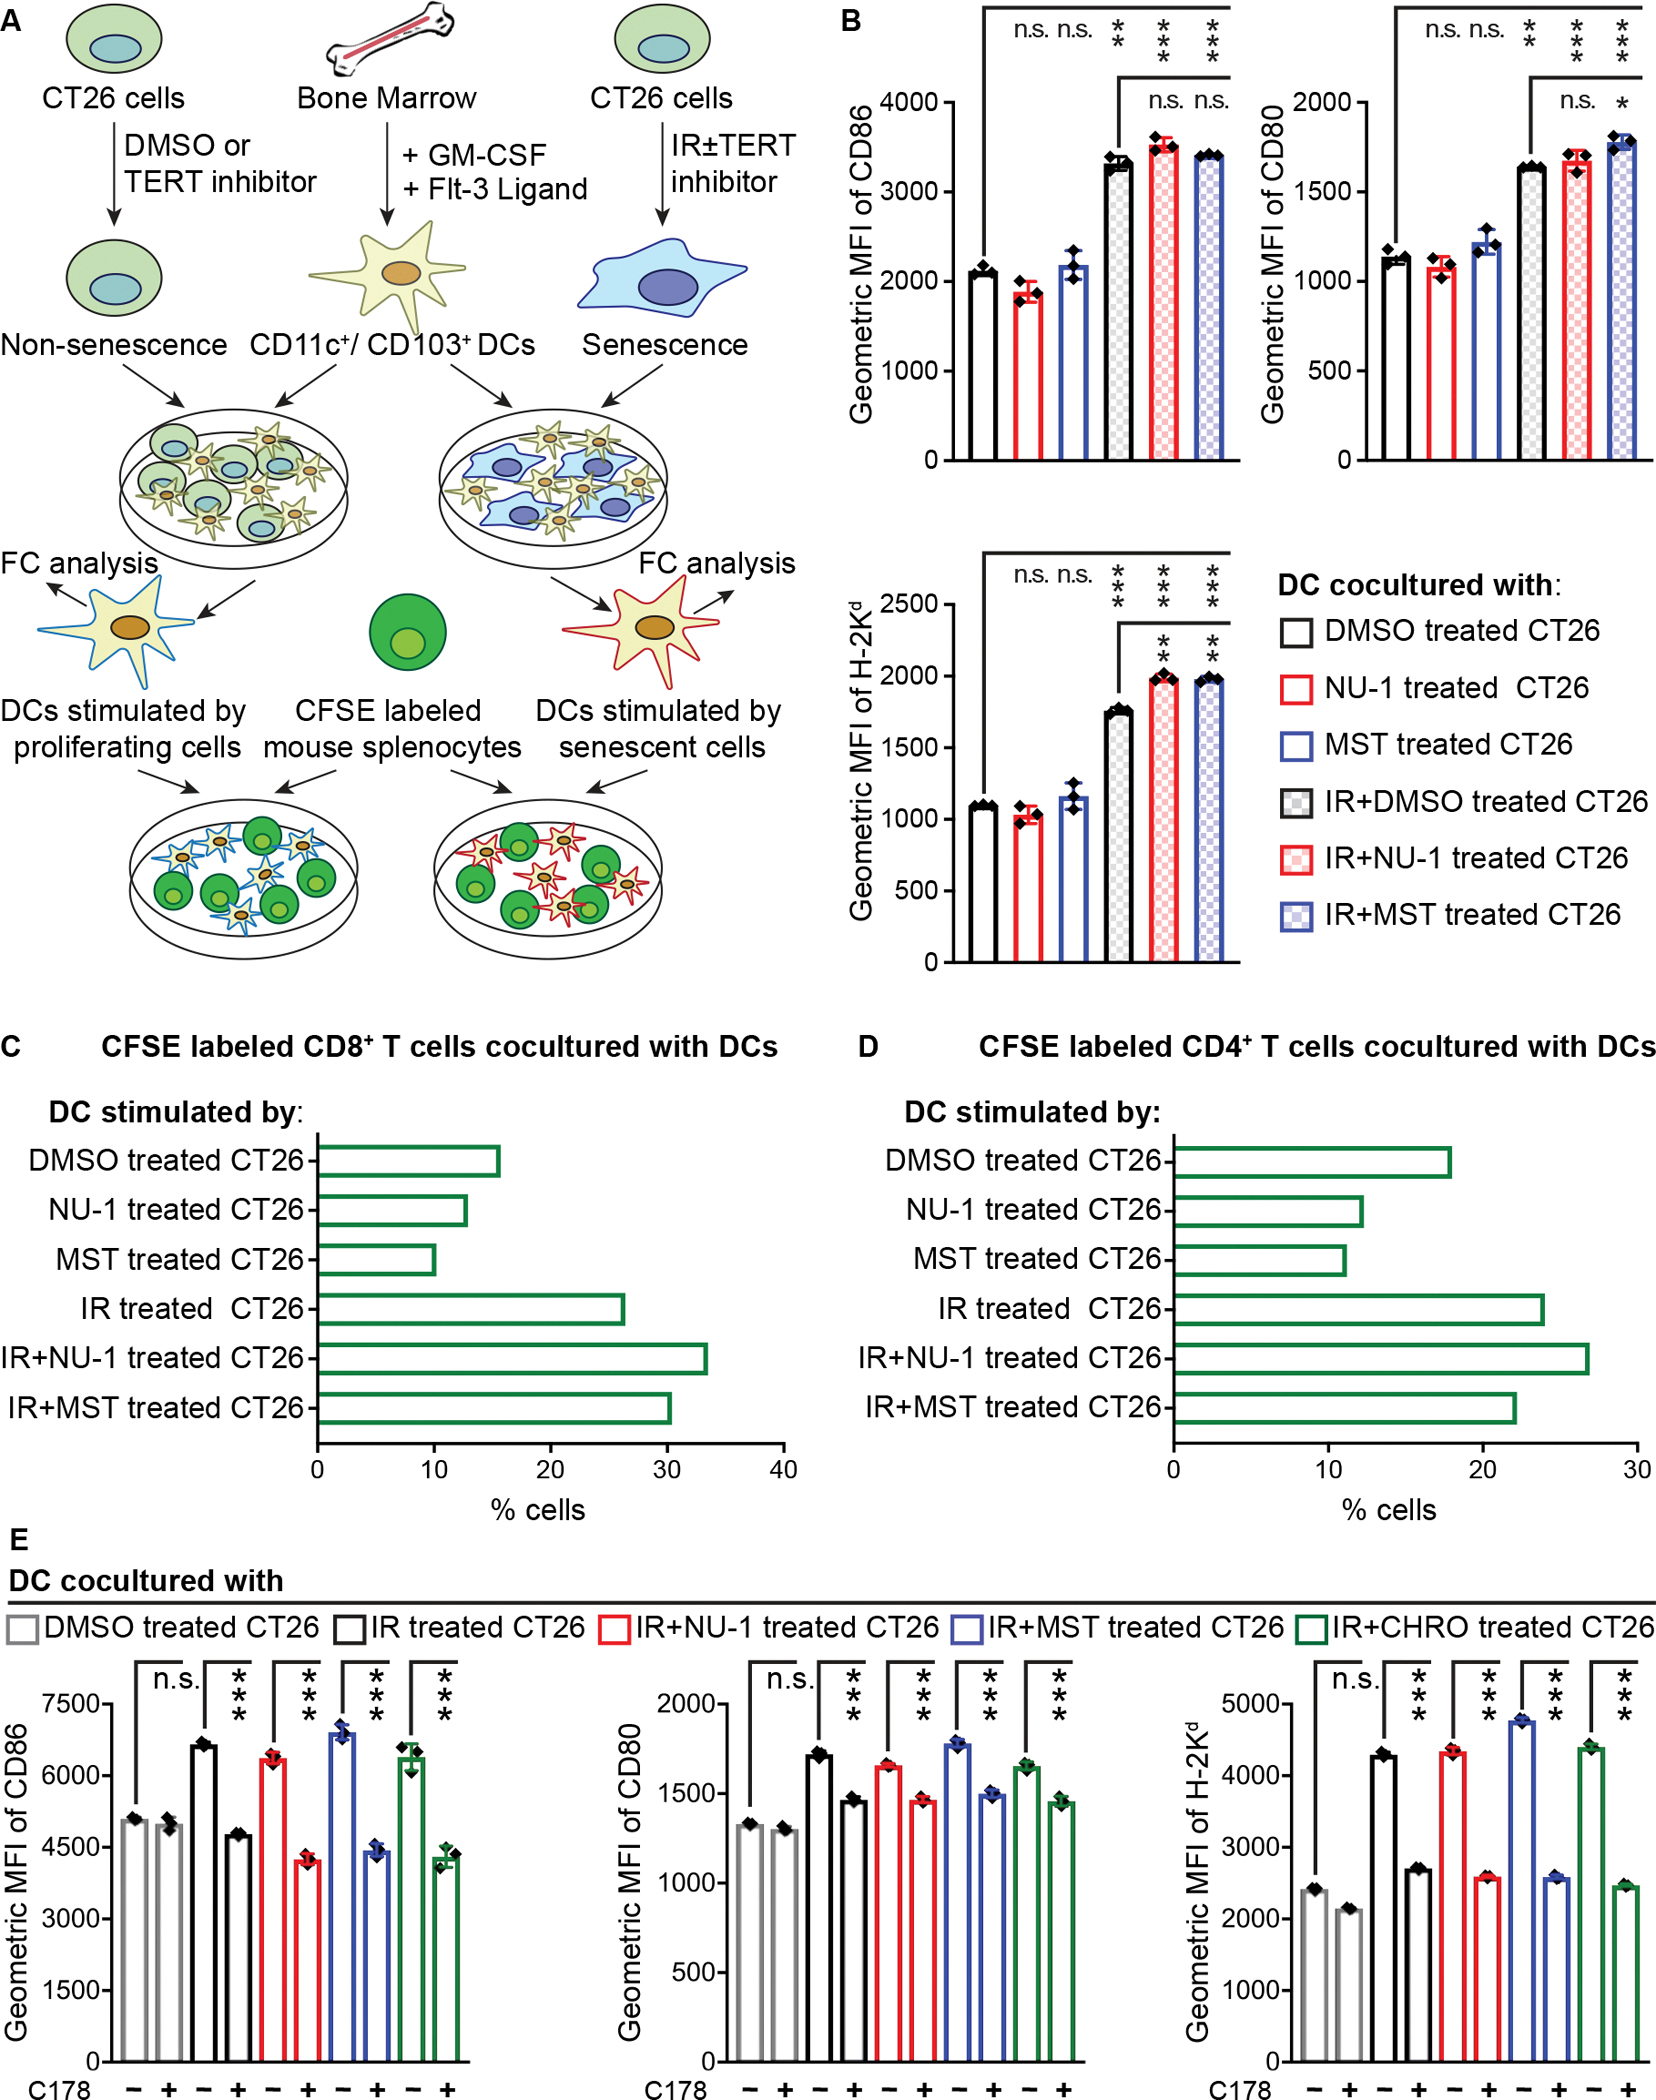
Beyond synthesizing telomere repeats, the telomerase reverse transcriptase (TERT) also serves multiple other roles supporting cancer growth. Blocking telomerase to drive telomere erosion appears impractical, but TERT's non-canonical activities have yet to be fully explored as cancer targets. Here, we used an irreversible TERT inhibitor, NU-1, to examine impacts on resistance to conventional cancer therapies. In vitro, inhibiting TERT sensitized cells to chemotherapy and radiation. NU-1 delayed repair of double-strand breaks, resulting in persistent DNA damage signaling and cellular senescence. Although NU-1 alone did not impact growth of syngeneic CT26 tumors in BALB/c mice, it dramatically enhanced the effects of radiation, leading to immune-dependent tumor elimination. Tumors displayed persistent DNA damage, suppressed proliferation, and increased activated immune infiltrate. Our studies confirm TERT's role in limiting genotoxic effects of conventional therapy but also implicate TERT as a determinant of immune evasion and therapy resistance.

Keywords: DNA damage response; TERT; anti-tumor immunity; combination therapy; radiation; senescence.


Conflict of interest statement

Declaration of interests Y.L., R.C.B., G.B.F., K.A.S., and S.J.K. are co-inventors of intellectual property owned by Northwestern University and the University of Chicago and co-founders and/or co-owners of Riptide Therapeutics, a spin-out from Northwestern University and the University of Chicago, related to applications of chrolactomycin analog TERT inhibitors in cancer therapeutics. R.C.B. is an employee of Corteva Agriscience. S.J.K. is a co-founder of OncoSenescence.

Figures

Figure 1
Figure 1. TERT inhibitor NU-1 modulates cancer cell gene expression.
(A) Chemical structures of TERT inhibitors chrolactomycin and NU-1 and the inactive des-exomethylene analog NU-2. (B-C) Enrichment of downregulated (B) and upregulated (C) pathways in NU-1 treated MCF7 cells through Reactome Gene Ontology (GO) analysis. Dots, number of DEGs. Bars, −Log10(p-value) for each enriched pathway. See also Figure S1.
Figure 2
Figure 2. TERT inhibition sensitizes telomerase-positive cells to chemotherapy.
(A-C) Dose-response curves indicating the viability of MCF7 cells (A), ALT Saos-2 cells (B), and A549 cells (C) pretreated for 4 h with DMSO, NU-1 (0.5 μM), or NU-2 (0.5 μM), BIBR 1532 (BIBR, 10 μM), MST-312 (MST, 1 μM), then for 24 h with indicated concentration of irinotecan, etoposide, paclitaxel, or doxorubicin, and cell viability determined. (D) Lethal Dose 50 (LD50) in cells and Combination Index (CI) were calculated from data from A-C. CI<1, synergistic; CI=1, addictive; CI>1, antagonistic. (E) Viability of MCF7 cells where DMSO or telomerase inhibitors were co-administered with irinotecan for 24 h. (F) Viability of MCF7 cells treated with irinotecan for 4 h before adding DMSO or telomerase inhibitors for 24 h. Data obtained from three replicates, mean ± SEM. LD50 were used for statistical analysis, ** 0.001< P < 0.01, * 0.01< P < 0.05, n.s. P > 0.05 compared to DMSO (unpaired t-test). See also Tables S1 and 2.
Figure 3
Figure 3. TERT inhibition induces radiosensitivity and cellular senescence.
(A) Clonogenic assay of MCF7 cells treated with DMSO control, NU-1, BIBR (BIBR 1532), or MST (MST-312) at indicated concentrations. (B) Clonogenic survival of MCF7 cells irradiated at indicated doses ± DMSO, NU-1 (0.5 μM), BIBR (10 μM), or MST (1 μM). Representative images from triplicates. (C) Normalized surviving fractions of cells in B, mean ± SD. (D) Proliferation analysis over 6 days comparing MCF7 cells treated with TERT inhibitors or controls for 1 h before 0 (left, NIR) or 6 Gy (right) at time 0, mean ± SEM. (E) Quantification of YO-PRO-1+ cells. Cells were treated with indicated compounds ± IR, followed by staining after 7 days, mean ± SD. (F) SA-β-Gal staining of MCF7 cells treated as in D, after 7 days. Representative 20X images. Scale bars=200 μm. (G) Quantification of SA-β-Gal+ cells in F, mean ± SD. (H) % SA-β-Gal+ MCF7 cells. Cells were treated as indicated for 1 h, followed by IR and staining after 7 days, mean ± SD. (I) MCF7 cells were treated with indicated compounds ± 6 Gy IR, followed by cell cycle analysis after 24 h. Data from three replicates, mean ± SD. (J) MCF7-FUCCI cells were treated with NU-1 or NU-2 for 1 h before 6 Gy at time 0 h. Successive representative images are shown. Red, G1 phase. Green, S/G2. Arrows indicate the tracked mother and daughter cells. Scale bars=50 μm. *** P <0.001; ** 0.001< P < 0.01, n.s. P > 0.05 compared to DMSO (unpaired t-test). See also Table S3 and Movies S1–3.
Figure 4
Figure 4. TERT inhibition induces persistent DNA damage foci and delays double-strand break repair after irradiation in telomerase positive cells.
(A and B) Representative pseudo-colored images of staining for DNA damage foci markers 53BP1 (green) or γH2AX (red), DAPI (blue), and a three-color overlay. MCF7 cells were treated with DMSO, NU-2 (0.5 μM), NU-1 (0.5 μM), CHRO (0.5 μM), BIBR (10 μM), or MST (1 μM) for 1 h, followed by 0 (NIR, A) or 6 Gy (B), then fixed and stained after 24 h. Scale bars=20 μm. (C and D) Quantification of γH2AX foci of cells in A (C) and B (D). (E) Representative pseudo-colored staining images of cells treated as in B with 6 Gy showing telomere probe (green), γH2AX (red), DAPI (blue), and a three-color overlay. Scale bars=5 μm. (F and G) Quantification analysis of telomere and γH2AX colocalization after 0 (F) or 6 Gy (G). (H) Neutral comet assay of MCF7 cells treated as in A and B. Representative images demonstrate “comet tails”. Scale bars=20 μm. (I and J) Quantification of comet assay results after 0 (I) or 6 Gy (J). % tail DNA indicates proportional of unrepaired chromosomal DSBs. (K) ALT Saos-2 cells were treated with DMSO or NU-1 (1 μM) for 1 h, then 0 or 6 Gy, fixed and stained after 24 h. Shown are representative images. Scale bars=20 μm. (L) Quantification of γH2AX foci of cells in K. (M) Saos-2 cells treated as in H were examined by neutral comet assay. Representative images are shown. Scale bar=20 μm. (N) Quantification of comet assay results in M. For quantification analysis, >50 cells were analyzed. Shown are individual cells (open circles) and mean (red bar). *** P < 0.001; ** 0.001 < P < 0.01; n.s. P > 0.05 compared to DMSO (unpaired t-test). See also Figure S4.
Figure 5
Figure 5. TERT inhibition targets the non-homologous end-joining DSB repair pathway.
(A) Diagram of the Traffic Light repair reporter system. Repair of an I-Sce-induced DSB in individual cells by end-joining (NHEJ) versus homologous recombination (HR) results in expression of mCherry or GFP, detected by flow cytometry. (B and C) The ratio of NHEJ to HR (left) and the quantification of mCherry+ or GFP+ cells among single cell population (right) in MCF7 (B) and 293T cells (C). Data from three replicates, mean ± SD. *** P < 0.001; ** 0.001 < P < 0.01; * 0.01< P < 0.05 compared to DMSO treatment (unpaired t-test).
Figure 6
Figure 6. NU-1 confers immunogenic radiation sensitization that leads to tumor elimination.
(A) Experimental schema for treating mice bearing CT26 subcutaneous tumors. (B and C) Tumor growth in BALB/c mice treated with NU-1 alone (B) or in combination with 10 Gy irradiation (IR) (C). Shown are tumor growth kinetics (left, mean ± SEM) and tumor volumes on Day 28 (right, individual volume and mean). (D) Hematoxylin and eosin (H&E) staining of tumor sections collected on Day 18. Shown are representative whole section scanning (scale bar=2.5 mm) and selected enlarged regions (scale bar=60 μm). (E-G) Representative pseudo-colored images of staining for Ki67 (red) or γH2AX (red) (E), or CD45 (yellow) and CD11c (red) (F), or CD8 (yellow) and Granzyme B (red) (G), overlaid with DAPI (blue). Serial sections with D were used. Scale bars=20 μm. (H) Tumor growth in NSG mice treated with IR ± NU-1. Shown are tumor growth kinetics (left, mean ± SEM) and tumor volumes on Day 28 (right, individual volume and mean). (I) Representative H&E staining examples of tumor sections collected from NSG mice on Day 18. Scale bar=2.5 mm (upper) or 60 μm (lower). (J) Representative images of staining for Ki67 (red) or γH2AX (red), overlaid with DAPI (blue). Scale bars=20 μm. *** P < 0.001, * P < 0.05, n.s. P > 0.05 (unpaired t-test). See also Figure S6.
Figure 7
Figure 7. TERT inhibition and irradiation induces immunogenic senescent CT26 cells capable of stimulating DC function via STING signaling.
(A) Experimental schema for forming and stimulating BMDCs with CT26 cells and assaying APC function. (B) Quantitative analysis of DC activation/maturation. CT26 cells treated with DMSO, NU-1, or MST-312 ± IR, incubated 5 days in culture, and combined with BMDCs overnight. Data obtained from live CD11c+/CD103+ DC population in triplicates, mean ± SD. (C and D) Proliferative rate of live CD8+/CD4 (C) and CD8/CD4+ (D) T cell population. CFSE labeled murine splenocytes were cocultured for 5 days with DCs pre-stimulated by CT26 cells treated with DMSO, NU-1, or MST ± IR. (E) CT26 cells treated with indicated compounds ± 10 Gy IR and cocultured with BMDCs as in B. Data from three experiments, mean ± SD. MFI, mean fluorescence intensity. *** P < 0.001, ** 0.001 < P < 0.01, n.s. P > 0.05 (unpaired t-test). See also Figures S7.

References

    1. Ahmed S, Passos JF, Birket MJ, Beckmann T, Brings S, Peters H, Birch-Machin MA, von Zglinicki T, and Saretzki G (2008). Telomerase does not counteract telomere shortening but protects mitochondrial function under oxidative stress. Journal of cell science 121, 1046–1053. - PubMed
    1. Akıncılar SC, Low KC, Liu CY, Yan TD, Oji A, Ikawa M, Li S, and Tergaonkar V (2015). Quantitative assessment of telomerase components in cancer cell lines. FEBS letters 589, 974–984. - PubMed
    1. Akiyama M, Yamada O, Kanda N, Akita S, Kawano T, Ohno T, Mizoguchi H, Eto Y, Anderson KC, and Yamada H (2002). Telomerase overexpression in K562 leukemia cells protects against apoptosis by serum deprivation and double-stranded DNA break inducing agents, but not against DNA synthesis inhibitors. Cancer Lett 178, 187–197. 10.1016/s0304-3835(01)00838-2. - DOI - PubMed
    1. Armanios M, and Greider CW (2015). Treating Myeloproliferation--On Target or Off? N Engl J Med 373, 965–966. 10.1056/NEJMe1508740. - DOI - PubMed
    1. Arndt GM, and MacKenzie KL (2016). New prospects for targeting telomerase beyond the telomere. Nat Rev Cancer 16, 508–524. 10.1038/nrc.2016.55. - DOI - PubMed

Publication types

Substances