Review
. 2023 Jan 9;41(1):41-57.
doi: 10.1016/j.ccell.2022.09.011. Epub 2022 Oct 6.

Technology meets TILs: Deciphering T cell function in the -omics era

Affiliations
Review

Technology meets TILs: Deciphering T cell function in the -omics era

William H Hudson et al. Cancer Cell. .

Abstract

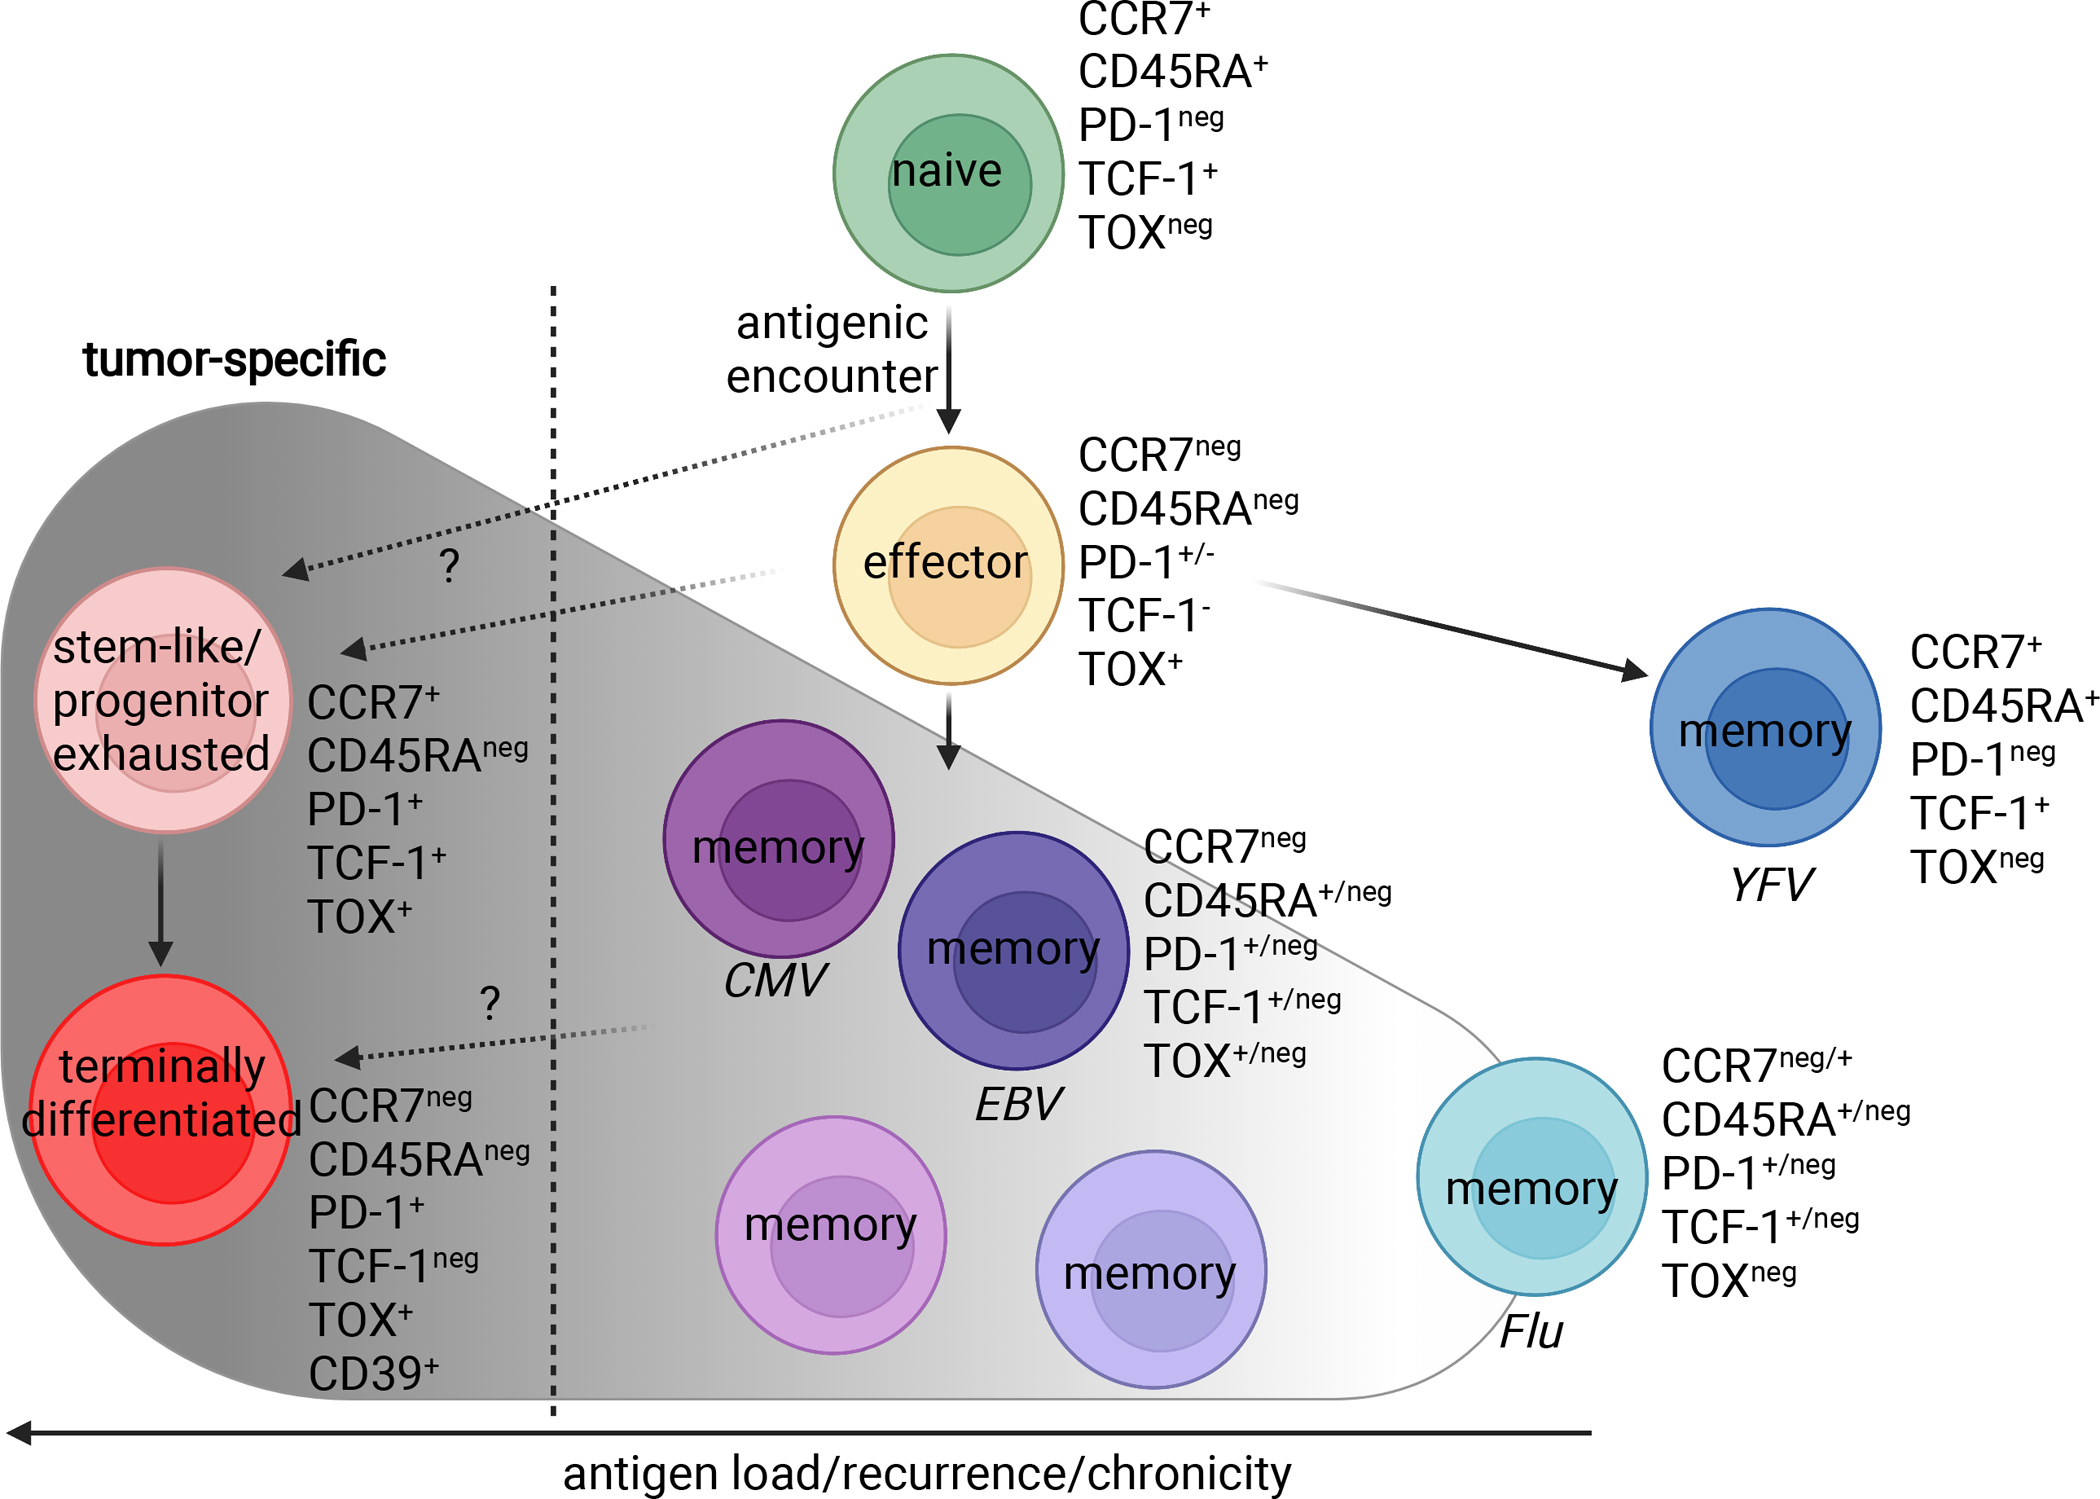
T cells are at the center of cancer immunology because of their ability to recognize mutations in tumor cells and directly mediate cancer cell killing. Immunotherapies to rejuvenate exhausted T cell responses have transformed the clinical management of several malignancies. In parallel, the development of novel multidimensional analysis platforms, such as single-cell RNA sequencing and high-dimensional flow cytometry, has yielded unprecedented insights into immune cell biology. This convergence has revealed substantial heterogeneity of tumor-infiltrating immune cells in single tumors, across tumor types, and among individuals with cancer. Here we discuss the opportunities and challenges of studying the complex tumor microenvironment with -omics technologies that generate vast amounts of data, highlighting the opportunities and limitations of these technologies with a particular focus on interpreting high-dimensional studies of CD8+ T cells in the tumor microenvironment.

Keywords: CD4; CD8; PD-1; T cell; bystander; cancer immunology; flow cytometry; immunotherapy; scRNA-seq; techniques; tumor-infiltrating lymphocytes.


Conflict of interest statement

Declaration of interests The authors declare no competing interests.

Figures

Figure 1:
Figure 1:
Human CD8+ T cell differentiation and associated phenotypic markers. Tumor-specific phenotypes are shown in red. Upon antigenic encounter, naïve CD8+ T cells differentiate into effector cells and further differentiate into different states depending on antigen clearance and chronic/recurrent antigen loads. Memory T cells specific for yellow fever virus (YFV) and the common human pathogens Influenza virus (Flu), Epstein-Barr virus (EBV) and cytomegalovirus (CMV), as well as tumor-specific cells (stem-like/progenitor exhausted and terminally differentiated) are shown along a schematic continuum of antigen load/recurrence. Of note, CMV- and EBV-specific memory CD8+ T cells can adopt various phenotypes and even resemble the phenotype of tumor-specific stem-like CD8+ T cells. Figure created with BioRender.
Figure 2:
Figure 2:
Inference of a reverse differentiation trajectory from scRNA-seq data. A: TCR-transgenic CD8+ T cells were transferred to mice which were subsequently infected with LCMV Armstrong. At illustrated timepoints, cells were sorted and subjected to scRNA-seq. B: Expression of T cell differentiation markers at indicated time points. C: UMAP projection of sequenced cells, with an illustrated arrow showing actual cell differentiation trajectory. D: Identical UMAP projection, with inferred trajectories. E: Heatmap of T cell differentiation marker expression, with cells in real-time order. F: Heatmap of T cell differentiation marker expression, with cells in pseudotime order. Raw data are from (Kurd et al., 2020). Code and data to reproduce the scRNA-seq analysis are available on Mendeley Data, doi: 10.17632/3dvt79c7yt.1.
Figure 3:
Figure 3:
Expression of an exhaustion-associated gene set in non-exhausted CD8+ T cells. A: Relative expression of the GSE41867_MEMORY_VS_EXHAUSTED_CD8_TCELL_DAY30_LCMV_DN gene set (Godec et al., 2016) in CD8+ T cells following acute infection. B: Exhaustion-associated genes are significantly enriched in day 6 vs day 90 cells, despite neither subset being biologically exhausted.
Figure 4:
Figure 4:
Quantification of TIM-3 on human T cells. A: CCR7 and TIM-3 staining on circulating T cells of a healthy donor. With this tissue only, it is unclear if TIM-3 staining was successful, and if so, where TIM-3+ cells should be gated. B: CCR7 and TIM-3 expression on tumor-infiltrating T cells, stained at the same time as PBMCs in (A). C: Overlay of CCR7 and TIM-3 staining in healthy donor PBMCs (red) and TILs (black). D: Estimates of TIM-3 expression on circulating T cells of healthy donors from various studies. Flow data in panels A-C were previously reported (Sudmeier et al., 2022).
Figure 5:
Figure 5:
Perils of data visualization and analysis in high-parameter flow cytometry. A: As more parameters are collected in a flow cytometry experiment, the potential biological insight increases. Unfortunately, both the difficulty of analysis and sensitivity of the experiment to such error also increase. An example is shown in panels B-H, where tumor-infiltrating lymphocytes from a brain metastasis patient were analyzed with a T cell-focused, 22-color flow cytometry panel. B-D: UMAP projection of CD8+ T cells, with cells colored by expression of PD-1 (B), CTLA-4 (C), and FOXP3 (D). Data shown are properly compensated and scaled. E: UMAP projection of CD8+ T cells, with cells colored by expression of FOXP3. The color intensity scale has been modified compared to panel (D); data are properly compensated. F: UMAP projection of CD8+ T cells, with cells colored by expression of FOXP3 (same scale as panel E). Fluorescence spillover of CTLA-4 PE/Dazzle into FOXP3 PE/Cy5 has been undercompensated by 10%. (G) An alternate display method, such as a histogram, using an internal positive control for FOXP3 expression would reveal improper scaling of FOXP3 fluorescence intensities (circled population). H: The true percentage of FOXP3+ CD8+ T cells in this sample is <0.5%. Data to reproduce the flow cytometry analysis are available on Mendeley Data, doi: 10.17632/3dvt79c7yt.1.

References

    1. Abdel-Hakeem MS, Manne S, Beltra J-C, Stelekati E, Chen Z, Nzingha K, Ali M-A, Johnson JL, Giles JR, Mathew D, et al. (2021). Epigenetic scarring of exhausted T cells hinders memory differentiation upon eliminating chronic antigenic stimulation. Nature Immunology 22, 1008–1019. 10.1038/s41590-021-00975-5. - DOI - PMC - PubMed
    1. Acharya N, Madi A, Zhang H, Klapholz M, Escobar G, Dulberg S, Christian E, Ferreira M, Dixon KO, Fell G, et al. (2020). Endogenous Glucocorticoid Signaling Regulates CD8+ T Cell Differentiation and Development of Dysfunction in the Tumor Microenvironment. Immunity 53, 658–671.e656. 10.1016/j.immuni.2020.08.005. - DOI - PMC - PubMed
    1. Ahn E, Araki K, Hashimoto M, Li W, Riley JL, Cheung J, Sharpe AH, Freeman GJ, Irving BA, and Ahmed R (2018). Role of PD-1 during effector CD8 T cell differentiation. Proceedings of the National Academy of Sciences 115, 4749–4754. 10.1073/pnas.1718217115. - DOI - PMC - PubMed
    1. Akondy RS, Fitch M, Edupuganti S, Yang S, Kissick HT, Li KW, Youngblood BA, Abdelsamed HA, McGuire DJ, Cohen KW, et al. (2017). Origin and differentiation of human memory CD8 T cells after vaccination. Nature 552, 362–367. 10.1038/nature24633. - DOI - PMC - PubMed
    1. Akondy RS, Monson ND, Miller JD, Edupuganti S, Teuwen D, Wu H, Quyyumi F, Garg S, Altman JD, Del Rio C, et al. (2009). The Yellow Fever Virus Vaccine Induces a Broad and Polyfunctional Human Memory CD8+ T Cell Response. The Journal of Immunology 183, 7919–7930. 10.4049/jimmunol.0803903. - DOI - PMC - PubMed

Publication types