. 2022 Oct 7;13(1):5905.
doi: 10.1038/s41467-022-33507-2.

Behaviourally modulated hippocampal theta oscillations in the ferret persist during both locomotion and immobility

Affiliations

Behaviourally modulated hippocampal theta oscillations in the ferret persist during both locomotion and immobility

Soraya L S Dunn et al. Nat Commun. .

Abstract

Theta oscillations are a hallmark of hippocampal activity across mammals and play a critical role in many hippocampal models of memory and spatial navigation. To reconcile the cross-species differences observed in the presence and properties of theta, we recorded hippocampal local field potentials in rats and ferrets during auditory and visual localisation tasks designed to vary locomotion and sensory attention. Here, we show that theta oscillations occur during locomotion in both ferrets and rats, however during periods of immobility, theta oscillations persist in the ferret, contrasting starkly with the switch to large irregular activity (LIA) in the rat. Theta during immobility in the ferret is identified as analogous to Type 2 theta that has been observed in rodents due to its sensitivity to atropine, and is modulated by behavioural state with the strongest theta observed during reward epochs. These results demonstrate that even under similar behavioural conditions, differences exist between species in the relationship between theta and behavioural state.


Conflict of interest statement

The authors declare no competing interests.

Figures

Fig. 1
Fig. 1. Localisation behaviour in rats and ferrets.
Schematics of the behavioural tasks. a Behavioural arena used with rats showing the two peripheral target locations, with the animal holding at the centre initiation spout. b Time-course of the behavioural trial for both the rat and the ferret. c Behavioural arena used with ferrets showing the five peripheral target locations, with the animal holding at the centre initiation spout. Summary of rat behavioural performance. d Proportion of correct trials for auditory and visual sessions for each rat. Each marker represents one session, shown with the mean and error bars showing standard deviation across sessions. Grey dashed line represents performance at chance level (1/2). e Cumulative speed distribution across sessions for each rat. The mean and standard deviation of the session speed distributions are shown as line and shaded area. f Mean session speed of ‘moving’ data (defined as speeds >10 cms−1) for each rat. Each marker represents one session, shown with the mean and error bars showing standard deviation across sessions. Data are from 3 rats over a total of 55 sessions (see Supplementary Table 1 for sample sizes for individual subjects). g–i as in d–f but for ferret data (chance level: 1/5). Data are from 3 ferrets over 75 sessions (see Supplementary Table 1 for sample sizes for individual subjects).
Fig. 2
Fig. 2. Hippocampal formation and electrode position across species.
Nissl-stained coronal sections from rat (a −3.12 relative to Bregma) and ferret (b −14.4 mm relative to occipital crest) brain. Insets show magnified images of the dorsal pole of the hippocampal formation (CA: cornu ammonis, DG: dentate gyrus, S: subiculum). Estimated electrode implant locations for each rat (c) and ferret (d). Brain section outlines were generated from the Rat Brain Atlas and the Ferret Brain Atlas. Left (L) and right (R) hemispheres are indicated for each section. The left section is most anterior; the anterior-posterior position of the section is given in millimetres relative to bregma (rat) or the occipital crest (ferret). Single-trial examples of behavioural and neural data recorded from one rat (e) and one ferret (f). Top left: Head position tracking of a single recording session (grey line) with a single trial highlighted in colour and coded by time. Top right: The speed of the highlighted trial, coloured with the same scale. Shaded area indicates stimulus activation. Bottom left: Nissl-stained section of the hippocampus showing the estimated position of electrode recording sites (grey bar). Bottom right: Corresponding LFP traces for the example trial for each channel on the probe (n = 32 channels, 100 µm spacing).
Fig. 3
Fig. 3. Rat-like theta oscillation in the ferret hippocampus during locomotion.
Theta characteristics in rat R1. a LFP power spectral density on the highest power channel during locomotion (single session). Blue shading indicates 6–13 Hz range. b Peak-trough method for estimating theta properties: Example data from the channel/session shown in a with LFP (1 Hz high-pass filtered; grey) and theta filtered activity (4–14 Hz; blue). Dashed lines indicate extrema used to estimate instantaneous amplitude, phase and frequency. Frequency is shown overlaid on spectrogram of the above LFP signal (normalised to maximum). Relationship between locomotor speed and frequency (c) or power (d) for data shown in a. Data-points represent median values in 250 ms epochs during locomotion (black, n = 6857) or when the animal was not moving (<10  cms−1; grey, n = 7565, excluded from regressions). Box plot centres show median, box bounds show interquartile range and whiskers show 9th–91st percentile of frequency/power binned by speed (5 cms−1 bins). Speeds over the 90th percentile were excluded (>55 cms−1) due to small sample sizes. Regression line fitted to median values (n = 9) in each speed bin (pink), text shows linear regression parameters. e Nissl-stained section of hippocampus showing estimated electrode track (grey bar). f Depth profile of theta characteristics for one recording session. Theta filtered: LFP filtered between 4 and 14 Hz shown for each channel as a function of probe depth. Theta power: power profile across the probe. Data shown as medians with interquartile (filled line) and 9th−91st percentile (dashed). Theta phase: phase shift for each channel relative to the top channel on the probe. Data shown as circular mean with error bars showing SD. Speed vs freq.: Linear regression slope of locomotion speed and theta frequency across the probe. Speed vs pow.: Linear regression slope of locomotion speed and theta power across the probe. Filled markers indicate significant regressions (Bonferroni corrected p < 0.0016). Estimated position of hippocampal layers based on theta depth profiles shown with grey shading (stratum oriens, SO; stratum pyramidale, SP; stratum radiatum/stratum lacunosum molecular, SR/SLM). g–j Theta characteristics in ferret F3L shown as in a–d with theta filter bandwidth (2–8 Hz) in orange: data from one recording session (moving data in black n = 2102; immobile in grey n = 6278). k Nissl-stained section of ferret hippocampus showing the estimated electrode track position (grey bar). l As in f but showing depth profile of theta characteristics (filtered 2–8 Hz) for a single recording session in ferret F3L.
Fig. 4
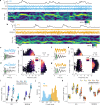
Fig. 4. Low frequency oscillatory activity persists during immobility in the ferret hippocampal LFP.
20 s of example data from one rat (a R2) and one ferret (b F1L). Top: Head speed showing multiple periods of immobility and movement. Middle: LFP traces from stratum oriens (SO) and stratum radiatum/stratum lacunosum moleculare (SR/SLM) corresponding to the speed trace above. Bottom: Spectrogram of SR/SLM LFP above, normalised to maximum power. Example data segments illustrating the autocorrelation-based method of quantifying oscillatory activity from LFP recorded during locomotion (c) and immobility (d) in R2 SR/SLM (top: blue line) and corresponding autocorrelation (bottom: black). The matched sinusoid wave autocorrelation (grey) is used for frequency estimation and peak range estimation. Green line indicates the uncorrected peak range measurement for this example, vertical grey line indicates peak range of matched sinusoid used for normalisation. Text shows mean speed in example epochs. e Scatter plot and marginal histograms showing estimated frequency and peak range for all epochs from one session recorded in rat R2. Each marker represents one epoch and is coloured by mean head speed. Green markers show the position of the example epochs from c (diamond) and d (square). Quantification of oscillatory activity in ferret F1L shown as in c–e. i Comparison of peak range for immobile (mean speed <5 cms−1, grey markers) vs. moving (mean speed >20 cms−1, blue markers) epochs for each rat for data from stratum oriens (SO) and stratum radiatum/stratum lacunosum moleculare (SR/SLM). Note that not every probe crossed the SR/SLM regions of the hippocampus. Each marker represents median for all epochs data from one recording session (data are from 3 rats over a total of 55 sessions, see Supplementary Table 1 for sample sizes for individual subjects). Box plot centres show median, box bounds show interquartile range and whiskers show 9th to 91st percentile across sessions. j Difference in peak range (immobile—moving) for data shown in i (rat data, blue) and k (ferret data, orange). k as in i but for each ferret probe (Data are from 3 ferrets over a total of 75 sessions, see Supplementary Table 1 for sample sizes for individual subjects).
Fig. 5
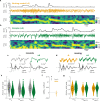
Fig. 5. Immobility-related oscillatory activity in the ferret is abolished by atropine.
20 s of example data from ferret F4 in a control session (a) where no atropine was administered (No-drug control, −A) and test session (b) with atropine administered (+A). Top: Head speed showing multiple periods of immobility and movement. Middle: LFP trace (1 Hz high-pass filtered, 50 Hz notch filtered) from a channel estimated to be below the cell layer. Bottom: LFP spectrogram, normalised to maximum power. Examples of autocorrelation peak range during (c) immobility (speed < 5 cms−1) and (d) locomotion (speed > 20 cms−1), without (−A; immobile: grey, moving: orange) and with (+A; green) administration of atropine. Top: 1 s example LFPs. The mean head speed in the example epochs are indicated. Bottom: Corresponding autocorrelograms of the LFP epochs above (black line) overlaid on the matched sinusoid wave autocorrelograms (grey line). Black vertical line indicates the uncorrected peak range measurement for these examples, vertical grey line indicates peak range of matched sinusoid used for normalisation. e Comparison of autocorrelation peak range for data during locomotion without (−A; grey) and with (+A, green) atropine for 3 channels across 2 ferrets. Each marker represents a 1 s data epoch (F1R −A n = 862, +A n = 1203; F4periCL −A n = 972, +A n = 1250; F4subCL −A n = 2077, +A n = 3133). Box plot centres show median, box bounds show interquartile range and whiskers show 9th to 91st percentile. f β1 coefficients (markers) for linear mixed-effects models predicting peak range values based on drug condition for immobile and moving data independently. Error bars show 5–95% confidence intervals. *p < 0.001 (LMM). g as in e but for moving data.
Fig. 6
Fig. 6. Type 2 theta in the ferret is modulated by behavioural state.
Example trials from a rat R1 and b ferret F3L. Top: Head speed across example trials with Hold (grey shading), Run (rat: blue shading; ferret: orange shading) and Reward (purple shading) epochs highlighted. Bottom: Corresponding neural trace (rat: 2 Hz high-pass filtered, 50 Hz notch filtered; ferret: 1 Hz high-pass filtered, 50 Hz notch filtered) recorded from the stratum radiatum/stratum lacunosum moleculare (SR/SLM). c, d Autocorrelograms of LFP segments during the trial epochs highlighted in a, b: Hold (grey, left plot), Run (blue/orange, middle plot), Reward (purple, right plot); overlaid on the matched sinusoid wave autocorrelation (light grey lines). Black vertical lines illustrate the uncorrected peak range measurement for each epoch, vertical grey line indicates peak range of matched sinusoid used for normalisation. e Scatter plot and marginal histograms showing relationship between LFP trial epoch frequency and normalised autocorrelation peak range for Hold (grey), Run (blue) and Reward (purple) epochs in rat R1. Markers represent data from a one second epoch from a single trial; data are from all sessions. Markers edged with black show the position of example epochs shown in c. f Autocorrelation peak range for Hold (grey), Run (blue) and Reward (purple) epochs across all probe channels for rat R1; data are from all sessions and presented as median (solid line) and interquartile range (shaded area). Channels in the stratum oriens (SO) and stratum radiatum/stratum lacunosum moleculare (SR/SLM) are highlighted with horizontal light grey shading. g Normalised autocorrelation peak range for Hold (grey), Run (blue) and Rwd (reward; purple) epochs for each rat (R1 n = 1081, R2 n = 368, R3 n = 427 trials) in the SO (left plot) and SR/SLM (right plot). Data are presented as median (marker position) and interquartile range (error bars) and normalised to the median Run value; data are from all sessions. h, i as in e–f but for ferret F3L. j as in g but for ferret probes (F1L n = 430, F1R n = 236, F2L n = 421, F3L n = 272, F3R n = 682 trials). For h–j ferret Run data are presented in orange.

Similar articles

Cited by

References

    1. O’Keefe J, Dostrovsky J. The hippocampus as a spatial map. Preliminary evidence from unit activity in the freely-moving rat. Brain Res. 1971;34:171–175. doi: 10.1016/0006-8993(71)90358-1. - DOI - PubMed
    1. Hafting T, Fyhn M, Molden S, Moser M-B, Moser EI. Microstructure of a spatial map in the entorhinal cortex. Nature. 2005;436:801–806. doi: 10.1038/nature03721. - DOI - PubMed
    1. Taube, J. S., Muller, R. U. & Ranck, J. B. Head-direction cells recorded from the postsubiculum in freely moving rats. I. Description and quantitative analysis. J. Neurosci.2, 420–435 (1990). - PMC - PubMed
    1. O’Keefe J. Hippocampus, theta, and spatial memory. Curr. Opin. Neurobiol. 1993;3:917–924. doi: 10.1016/0959-4388(93)90163-S. - DOI - PubMed
    1. Buzsáki G. Theta oscillations in the hippocampus. Neuron. 2002;33:325–340. doi: 10.1016/S0896-6273(02)00586-X. - DOI - PubMed

Publication types