. 2022 Oct 7;13(1):5912.
doi: 10.1038/s41467-022-33464-w.

Pericyte remodeling is deficient in the aged brain and contributes to impaired capillary flow and structure

Affiliations

Pericyte remodeling is deficient in the aged brain and contributes to impaired capillary flow and structure

Andrée-Anne Berthiaume et al. Nat Commun. .

Abstract

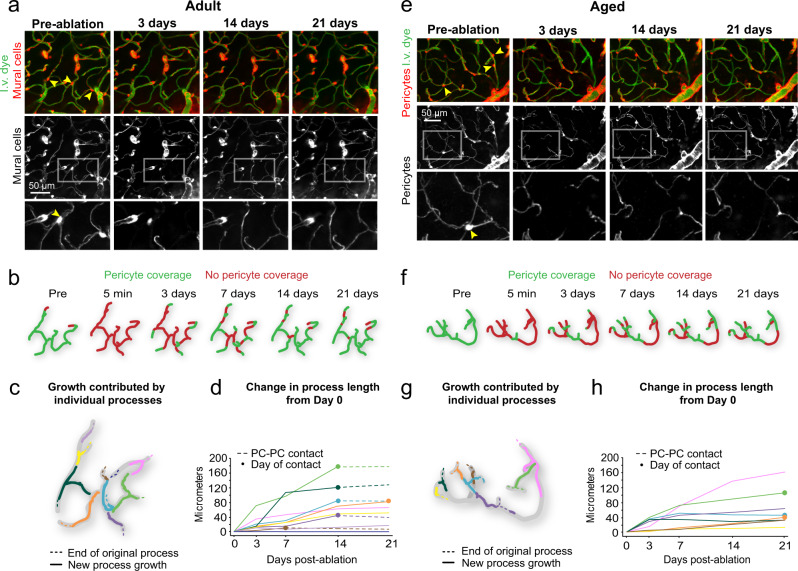
Deterioration of brain capillary flow and architecture is a hallmark of aging and dementia. It remains unclear how loss of brain pericytes in these conditions contributes to capillary dysfunction. Here, we conduct cause-and-effect studies by optically ablating pericytes in adult and aged mice in vivo. Focal pericyte loss induces capillary dilation without blood-brain barrier disruption. These abnormal dilations are exacerbated in the aged brain, and result in increased flow heterogeneity in capillary networks. A subset of affected capillaries experience reduced perfusion due to flow steal. Some capillaries stall in flow and regress, leading to loss of capillary connectivity. Remodeling of neighboring pericytes restores endothelial coverage and vascular tone within days. Pericyte remodeling is slower in the aged brain, resulting in regions of persistent capillary dilation. These findings link pericyte loss to disruption of capillary flow and structure. They also identify pericyte remodeling as a therapeutic target to preserve capillary flow dynamics.


Conflict of interest statement

The authors declare no competing interests.

Figures

Fig. 1
Fig. 1. Acute consequence of ablating multiple contiguous pericytes.
a In vivo two-photon imaging through a chronic cranial window in anesthetized PDGFRβ-tdTomato mice. b Capillary bed with vessels labeled green with intravenous (i.v.) dye, FITC-dextran (70 kDa), and pericytes genetically labeled in red. The inset shows the structure of capillary pericytes. Representative of 12 PDGFRβ-tdTomato mice in this study. c A capillary pericyte targeted for two-photon ablation encircled in yellow. Ablative line-scanning is restricted to the pericyte soma. Post-ablation image shows loss of fluorescence from targeted pericyte, including its processes, within minutes post-ablation. Neighboring pericytes are unaffected. Representative of >42 pericyte ablations. d Schematic showing metrics collected following ablation of three contiguous pericytes. Left, targeted pericytes are marked with asterisks. Right, metrics include total capillary length uncovered, number of remodeling pericytes, and number of remodeling pericyte processes. e,f Before and 5 min after triple pericyte ablation in adult and aged animal. Arrowheads indicate targeted pericyte somata, and dotted magenta line outlines approximate regions of uncovered endothelium. Inset shows a magnified region with pericyte ablation and uncovered territory 5 min afterwards. Each example is representative of 7 experiments per age group. Comparison of vascular metrics between adult and aged mice after triple pericyte ablation. g Total capillary length uncovered; t(12) = 1.790, p = 0.0988. h Number of fully and partially uncovered capillary segments; t(12) = 0.1936, p = 0.8497. i Range of capillary segment lengths; t(195) = 0.2325, p = 0.8164. All are unpaired t tests (two-sided), for n = 7 triple pericyte ablations (6 adult mice), 7 triple pericyte ablations (6 aged mice) for g and h and = 99 capillary segments over 6 adult mice, n = 98 capillary segments over 6 aged mice for i. Data are shown as mean ± SD. Ns = non-significant. Comparison of pericyte metrics between adult and aged mice after triple pericyte ablation. j Number of remodeling pericytes; t(12) = 0.6030, p=0.5577. k Number of remodeling pericyte processes; t(12) = 0.7206, p = 0.4850. Unpaired t tests for n = 7 triple pericyte ablations (6 adult mice), 7 triple pericyte ablations (6 aged mice). Data are shown as mean ± SD.
Fig. 2
Fig. 2. Pericyte remodeling ensures capillary coverage following pericyte loss.
a Representative example of pericyte remodeling from an adult mouse (4 months old at pre-ablation), showing the area before triple pericyte ablation, and at select time-points after ablation. Arrowheads indicate pericytes targeted for ablation. The lower panels show mural cells only. Insets show magnified view of region with pericyte ablation followed with remodeling of neighboring pericyte processes. Each example is selected from 7 experiments in adult mice. I.v. dye = intravenous dye. b Schematic of capillary coverage by pericytes on each imaging day. c Schematic representation of growth contributed by different pericyte processes over 21 days. Each color represents an individual pericyte process, with location of original terminus of the process as a dashed line. d Plot of added pericyte process length over time from Day 0. Each color corresponds to an individual pericyte process from c. Closed circles mark the day of pericyte-pericyte contact, after which growth stops (dashed lines). PC-PC contact = pericyte–pericyte contact. e–h Representative example from an aged mouse (21 months old at pre-ablation), with same layout as for adult mouse. Each example is selected from 7 experiments in aged mice.
Fig. 3
Fig. 3. Inefficient pericyte remodeling in the aged brain fails to regain complete capillary coverage.
a In vivo two-photon images of a pericyte process growing over time (white arrow), until it is inhibited by pericyte–pericyte contact. This is a representative example of pericyte-pericyte contact from 21 pericyte ablations. I.v. dye  =  intravenous dye. b Percent of total pericyte processes making pericyte-pericyte contact on each imaging day across age groups. n = 60 processes from 6 adult mice, n = 57 processes from 6 aged mice. c Pericyte process extension over time in each age group, including all processes examined. n = 60 processes from 6 adult mice, n = 57 processes from 6 aged mice. d Plot showing the extension of pericyte processes, excluding those that have made pericyte-pericyte contact, at each post-ablation imaging day. Mixed-effects analysis with Sidak’s multiple comparisons (two-sided), F(1,115) = 9.979; overall effect **p = 0.002, Day 3, *p = 0.0187; Day 7, **p = 0.0056; Day 14, **p = 0.0087; Day 21, p = 0.6574. N = 60 processes from 6 adult mice, and n = 58 processes from 6 aged mice. Data are shown as mean ± SEM. e, f Maximum and average rate of pericyte process growth in aged compared to adult mice. e Unpaired t tests (two-sided) with Welch’s correction for unequal variances: t(109.1) = 3.313; **p = 0.0013; f t(90.50) = 4.977; ****p < 0.0001. N = 60 processes from 6 adult mice, n = 57 processes from 6 aged mice. Data are shown as mean ± SD. g Maximum process extension achieved in 21 days. Unpaired t test (two-sided), t(115) = 0.9370; p = 0.3507. n = 60 processes from 6 adult mice, 57 processes from 6 aged mice. Data are shown as mean ± SD. h Total process length at day 21. t(112) = 1.066; p = 0.2889. Data in eh shown as mean ± SD. Statistics performed with unpaired t tests (two-sided) for n = 60 processes from 6 adult mice, n = 57 processes from 6 aged mice. Data shown as mean ± SD. i Uncovered vessel length remaining over time. Each line represents one triple pericyte ablation region. Adult, n = 7 triple pericyte ablations; 6 mice; Aged n = 7 triple pericyte ablations from 6 mice. j Comparison of average vessel length remaining on each imaging day across age groups. Two-way ANOVA with Sidak’s multiple comparisons test, F(1, 12) = 16.72; overall effect **p = 0.0015, Day 0, p = 0.4196. Day 3, *p = 0.0118. Day 7, **p = 0.0098. Day 14, **p = 0.0052. Day 21, *p = 0.0490. Adult, n = 7 regions from 6 mice; aged, n = 7 regions from 6 mice. Day 49 is from a subset of triple pericyte ablation experiments in aged animals only (5 regions from 4 mice), not included in statistical analyses. Data are shown as mean ± SEM.
Fig. 4
Fig. 4. Mural cell remodeling capacity varies with age across microvascular zones.
a In vivo two-photon image of a microvascular network from penetrating arteriole to ascending venule, with branch orders in white. Bottom image highlights mural cell subtypes within zones. This is a representative view from 14 separate ablation experiments in regions containing different microvascular zones. I.v. dye  =  intravenous dye. Venule SMC  =  venular smooth muscle cell. b Example of an ensheathing pericyte from an adult mouse remodeling into the capillary zone. Arrow indicates position of leading process terminus over time. Bottom row shows high-resolution image of the cell at 21 days post-ablation. This is a representative example from 13 processes observed in arteriole-capillary transition zone. c Example of a mesh and thin-strand pericyte from an adult mouse growing within the capillary bed. Arrows show growing terminal ends of processes. This is a representative example from 35 processes observed in capillary zone. d Example of a venule SMC process from an adult mouse growing into the capillary bed, as indicated by arrows. This is a representative example from 7 processes observed in venular zone. e Average process growth by mural cells in different microvascular zones. Two-way ANOVA with Tukey’s multiple comparisons test (two-sided), For age comparison, F(1,102) = 21.45; overall effect, ****p = 0.0001; Arteriole-capillary transition (adult vs. aged) ****p < 0.0001; capillary (adult vs. aged) **p = 0.0016; Venule (adult vs. aged) p > 0.9999. For vessel type comparison, F(2,102) = 0.1838; overall effect, p = 0.8324, For interaction between age and vessel type, F(2,102)  =  6.029, overall effect, **p = 0.0033. Arteriole-capillary transition vs. capillary (adult), p = 0.5833; arteriole-capillary transition vs. venule (adult), p = 0.4125; capillary vs. venule (adult), p = 0.9533. Arteriole-capillary transition vs. capillary (aged), p = 0.4855; arteriole-capillary transition vs. venule (aged), *p < 0.0398; capillary vs. venule (aged), p = 0.4516. Adult: n = 13 arteriole-capillary transition, n = 35 capillary, n = 7 venule from 6 mice; aged: n = 12 arteriole-capillary transition, n = 30 capillary, n = 10 venule from 6 mice. Data are shown as mean ± SEM. f Maximum process extension by mural cells in different microvascular zones. Two-way ANOVA. For age comparison, F(1,97) = 0.1455; overall effect, p = 0.7037. For vessel type comparison, F(2,97) = 2.613; overall effect, p = 0.0784. For interaction between age and vessel type, F(2,97) = 5.532; **p = 0.0053. Arteriole-capillary transition vs. capillary (adult), p > 0.9999; arteriole-capillary transition vs. venule (adult), p < 0.9897; capillary vs. venule (adult), p = 0.3511. Arteriole-capillary transition vs. capillary (aged), p = 0.8750; arteriole-capillary transition vs. venule (aged), **p < 0.0014; capillary vs. venule (aged), **p = 0.0044. Adult: n = 13 arteriole-capillary transition, n = 35 capillary, n = 7 venule from 6 mice; aged: n = 12 arteriole-capillary transition, n = 30 capillary, n = 10 venule from 6 mice. Data are shown as mean ± SEM.
Fig. 5
Fig. 5. Lack of overt BBB disruption or perivascular inflammation with focal pericyte loss.
a Imaging time course to examine for extravasation of intravenous (i.v.) 10 kDa FITC-dextran dye in aged mice. Pre-ablation image shows location of targeted pericytes and sham irradiation controls. At day 3, T=0 shows regions of interest (ROI) from which fluorescence intensity measurements were collected over time. This is a representative example from 8 ablation experiments. b Intensity of FITC-dextran fluorescence within the capillary lumen as a function of time post-injection. Data shown as mean ± SEM. Fluor. Intensity = fluorescence intensity. c Intensity of FITC-dextran fluorescence in parenchymal ROI between ablation and sham regions. Data are shown as mean ± SEM. d Rate of fluorescence intensity change between ablation and sham ROI regions. Wilcoxon rank sum test (two-sided), p = 0.904. N = 7 ablation regions and n = 7 sham regions from 4 aged mice. Data shown as mean ± SEM. In vivo two-photon images from adult Pdgfrβ-tdtomato;Cx3Cr1-GFP mice, showing microglia reaction to e pericyte ablation or f sham irradiation after 30 min and 3 days. ROIs are drawn in the region directly exposed to laser ablation or irradiation (focal point), or the capillary segments covered by pericyte processes (territory). This is a representative example from 3 ablation experiments in adult mice. GFP intensity in focal point (g) and territory (h) after pericyte ablation and sham in adult mice, shown in arbitrary units (a.u.). Two-way repeated measures ANOVA with Sidak’s multiple comparisons (two-sided). Focal point: F(1.45, 7.252) = 24.41, overall effect ***p = 0.0009. Pericyte ablation vs. sham irradiation *p = 0.0216 at 30 min; p = 0.5504 at 3 days. Territory: F(1.149, 5.744) = 3.170, p = 0.1263. GFP intensity in focal point (i) and territory (j) in aged mice. Two-way repeated measures ANOVA. Focal point: F(1.03, 7.183) = 3.214, overall effect p = 0.1146. Territory: F(1.761, 12.33) = 0.2922, p = 0.7248. For g and h, n = 3 pericyte ablations, 4 sham irradiations from 5 mice between 3 and 6 months of age. For i and j, n = 5 pericyte ablations, 4 sham irradiations from 3 mice between 18 and 24 months of age. Data presented as mean ± SEM.
Fig. 6
Fig. 6. Pericyte coverage loss leads to augmented capillary dilations in the aged brain.
a Comparison of baseline capillary diameters across age. Unpaired t test (two-sided), t(60) = 0.7245; p = 0.4716. N = 30 capillaries from 6 adult mice, n = 32 capillaries from 6 aged mice. Data shown as mean ± SD. Ns  =  non-significant. b Capillary dilation occurs in region with loss of pericyte coverage, but not in adjacent capillaries that maintain pericyte coverage. Arrowhead points to pericyte targeted for ablation. I.v. dye  =  intravenous dye. c Example capillary region from adult mouse following triple pericyte ablation. Arrowheads show two targeted cells. Bottom row shows i.v. dye alone, with capillary segments measured over time identified by blue lines. d Plot of capillary diameters over time from adult mice. Repeated measures one-way ANOVA with Tukey’s multiple comparisons test (two-sided), F(1.824, 45.60) =  35.95, ****p < 0.0001. Baseline vs uncovered, ****p < 0.0001; baseline vs. re-covered, p = 0.7393; uncovered vs. re-covered, ****p < 0.0001. N  =  26 capillaries from 6 mice. Data are shown as mean ± SD. e Example capillary region from aged mouse following triple pericyte ablation. Arrowheads point to targeted pericytes. Bottom row shows i.v. dye alone, with capillary segments measured over time identified by purple lines. f Plot of capillary diameters over time from aged mice. Repeated measures one-way ANOVA with Tukey’s multiple comparisons test (two-sided), F(1.914, 53.59) =  111.3, ****p < 0.000. Baseline vs uncovered, ****p < 0.0001; baseline vs. re-covered, **p = 0.0018; uncovered vs. re-covered, ****p < 0.0001. N = 29 capillaries from 6 mice. Data shown as mean ± SD. g Change in diameter from baseline at 3 days post ablation, when capillaries lack pericyte coverage. Unpaired t test (two-sided), t(54) = 3.501, ***p = 0.0009. N = 26 capillaries in 6 adult mice, n = 30 capillaries in 6 aged mice. Data are shown as mean ± SD. h Difference between baseline and re-covered capillary diameter detected in adult and aged groups. Adult: One sample t test (two-sided), t(25) = 0.7451; p = 0.4631, for n = 26 from 6 mice. Aged: One sample t test (two-sided), t(33) = 4.172; ***p = 0.0002, for n = 34 capillaries from 6 mice. Difference in re-covered diameter between adult and aged mice. Unpaired t test with Welch’s correction (two-sided), t(41.40) = 2.751; **p = 0.0088. Data shown as mean ± SD. i Dilations persist for capillaries that do no regain pericyte coverage at 21 days in aged mice. Repeated measures one-way ANOVA with Tukey’s multiple comparisons test (two-sided), F(1.967, 19.67) = 31.35; overall effect ****p < 0.0001. Pre-ablation vs 3 days, ****p < 0.0001; pre-ablation vs 21 days, ***p = 0.0002; 3 days vs 21 days, p = 0.5976. N = 11 capillaries from 6 mice. Data are shown as mean ± SD.
Fig. 7
Fig. 7. Blood flow changes in regions of pericyte ablation and surrounding capillaries.
a Image showing capillaries uncovered by a triple ablation (purple). These data are from a single triple pericyte ablation experiment, performed in an aged mouse. I.v. dye = intravenous dye. b Three days post-ablation, changes in red blood cell (RBC) flux from baseline are color-coded in a subset of vessels. c Overlay of blood flow direction on vascular image. Ascending venules are marked in blue, and penetrating arterioles in red. d Blood cell flux before and 3 days post ablation for segments in and immediately around the ablation area. Paired t test, t(24)=3.880; ***p = 0.0007 for n = 25 capillaries from an aged mouse. Significantly higher variance was detected at 3 days compared to baseline, F test to compare variances (two-sided), F(24, 24) = 3.545; ***p = 0.0029. Data shown as mean ± SD. e Proportion of vessels in the area that experienced an increase vs. decrease in flux on Day 3. f Blood cell flux in capillaries that increased in flux from baseline to 3 days post-ablation. Paired t test (two-sided), t(17) = 6.273; ****p < 0.0001, for n = 18 capillaries from an aged mouse. g A subset of capillaries decreased in flux following pericyte ablation. Paired t test (two-sided), t(6) = 3.229; *p = 0.0179, n = 6 capillaries from an aged mouse. Data in d, f, g are shown as mean ± SD. h–j A divergent bifurcation that loses pericyte coverage in one downstream branch, while the alternate route remains covered. RBCs passing through i.v. dye captured by line scans are shown for each vessel (i, ii, iii) over time. k–m A convergent bifurcation that loses pericyte coverage to one upstream vessel. RBCs passing through i.v. dye captured by line scans are shown for each vessel (i, ii, iii) over time.
Fig. 8
Fig. 8. Impact of local capillary dilations examined in silico.
a Microvascular network 1 (MVN1) from mouse parietal cortex. b Example of a typical region affected by pericyte ablation in MVN1. The color bar shows the flow rates in individual capillaries pre-ablation. c Relative flow changes >10% of baseline in the entire MVN1 for an increasing extent of dilation. Vessels with a relative flow change between −10% and +10% are not colored and depicted by the light gray lines. d Relative flow change >10% of baseline at different distances to the center of the dilated capillaries. n(0.6)  =  808 vessels, n(1.1)  =  1114 vessels, n(1.6) = 1367 vessels. e Relative flow changes in the dilated vessels and their direct neighbors (Gen1-Neighbors and Gen2-Neighbors, see schematic). n(0.6, 1.1, 1.6) = 267 vessels each. f Flow steal at divergent bifurcations with one dilated outflow capillary. n(0.6, 1.1, 1.6) = 24 vessels each. Plots df show the relative flow change of individual vessels. The data of all four cases have been combined. For box plots, center = median, box bounds = upper (Q3) and lower (Q1) quartiles, whiskers = last data point within Q1 − 1.5*(Q3 − Q1) and Q3 + 1.5*(Q3 − Q1). g Distribution of standard deviations for numerous undilated capillary sets in upper cortex. The expected baseline heterogeneity of capillaries is defined as the median of all standard deviations. Left: MVN1 (n(sets)= 170, average set size = 14.5 ± 1.6), Right: MVN2 (n(sets)= 346, average set size = 14.6 ± 1.8). h Standard deviation of flow in the dilated capillaries at baseline and with increasing extent of dilation. Dashed lines show expected baseline heterogeneities at 0.50 and 0.75 quantile (see g).
Fig. 9
Fig. 9. Blood flow stalls and regression in capillaries neighboring dilation.
a A divergent bifurcation close to the arteriole-capillary transition zone. One branch of the bifurcation is dilated from pericyte loss 3 days post-ablation, and the resulting re-direction of flow creates a stall in the alternate, covered branch. Images are representative examples from 14 ablation experiments across adult and aged mice. I.v. dye = intravenous dye. b Example of blood flow defects at a capillary junction near the arteriole-capillary transition zone. At 21 days post-ablation, a central capillary is uncovered, dilated, and flowing. The other branches have stalled in flow or regressed. c Occurrence of stalls in triple off-target sham irradiation and triple pericyte ablation experiments. Unpaired t test with Welch’s correction for unequal variances (two-sided), t(16.10) = 2.698; overall effect *p = 0.0158, for n = 6 off-target irradiation experiments (3 in adult mice, 3 in aged mice), n = 14 pericyte ablation experiments (7 in adult mice, 7 in aged mice). Data are shown as mean ± SD. d Additional example of a capillary regression occurring after a prolonged stall. e Plot of the relative location of stall and regression events following pericyte ablation, by branch order from a dilated segment. Observations from n = 14 ablation experiments (7 in adult mice, 7 in aged mice). f Schematic summarizing findings of blood flow interruption following pericyte coverage loss.

References

    1. Brown WR, Thore CR. Review: cerebral microvascular pathology in ageing and neurodegeneration. Neuropathol. Appl. Neurobiol. 2011;37:56–74. doi: 10.1111/j.1365-2990.2010.01139.x. - DOI - PMC - PubMed
    1. Sweeney MD, Ayyadurai S, Zlokovic BV. Pericytes of the neurovascular unit: key functions and signaling pathways. Nat. Neurosci. 2016;19:771–783. doi: 10.1038/nn.4288. - DOI - PMC - PubMed
    1. Gerhardt H, Betsholtz C. Endothelial-pericyte interactions in angiogenesis. Cell Tissue Res. 2003;314:15–23. doi: 10.1007/s00441-003-0745-x. - DOI - PubMed
    1. Daneman R, Zhou L, Kebede AA, Barres BA. Pericytes are required for blood-brain barrier integrity during embryogenesis. Nature. 2010;468:562–566. doi: 10.1038/nature09513. - DOI - PMC - PubMed
    1. Armulik A, et al. Pericytes regulate the blood-brain barrier. Nature. 2010;468:557–561. doi: 10.1038/nature09522. - DOI - PubMed

Publication types

LinkOut - more resources