. 2022 Oct 7;13(1):5925.
doi: 10.1038/s41467-022-33492-6.

Nanoparticulate cell-free DNA scavenger for treating inflammatory bone loss in periodontitis

Affiliations

Nanoparticulate cell-free DNA scavenger for treating inflammatory bone loss in periodontitis

Hanyao Huang et al. Nat Commun. .

Abstract

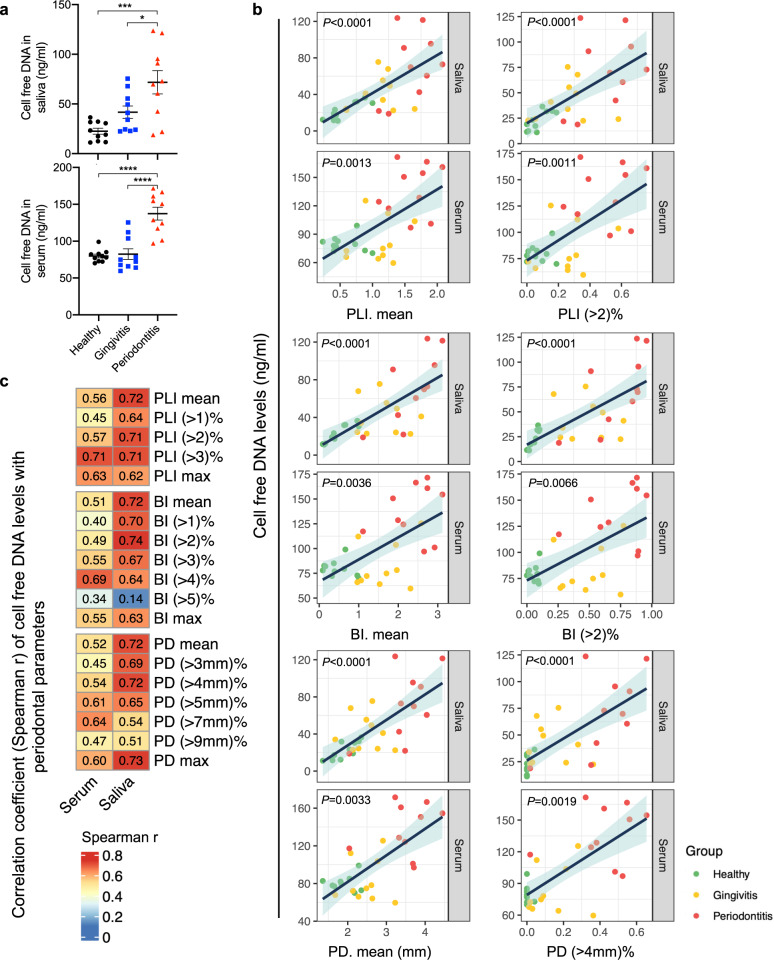
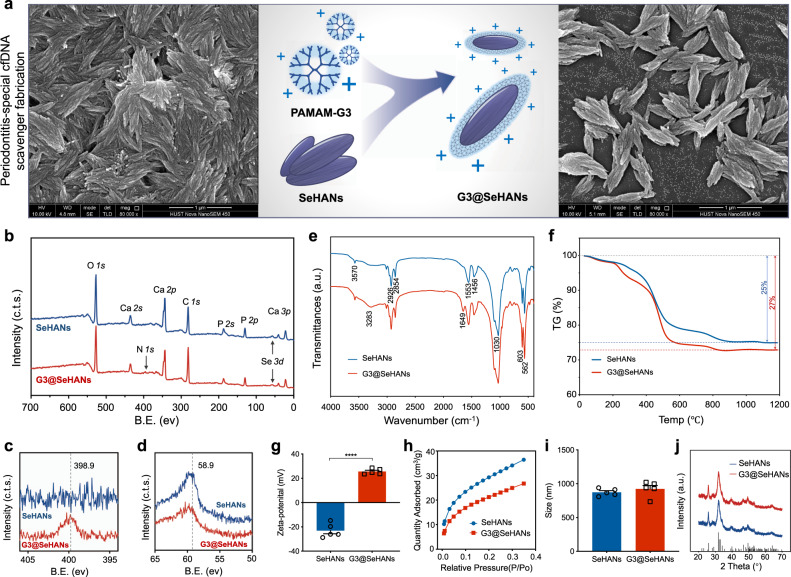
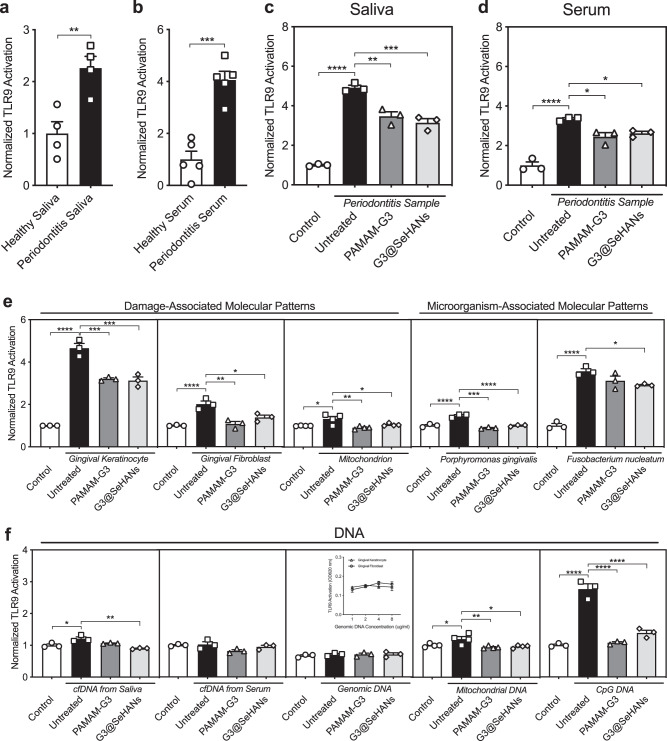
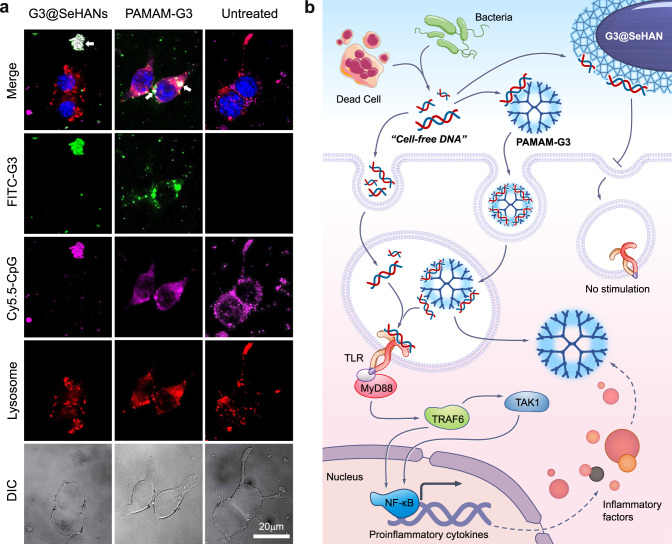
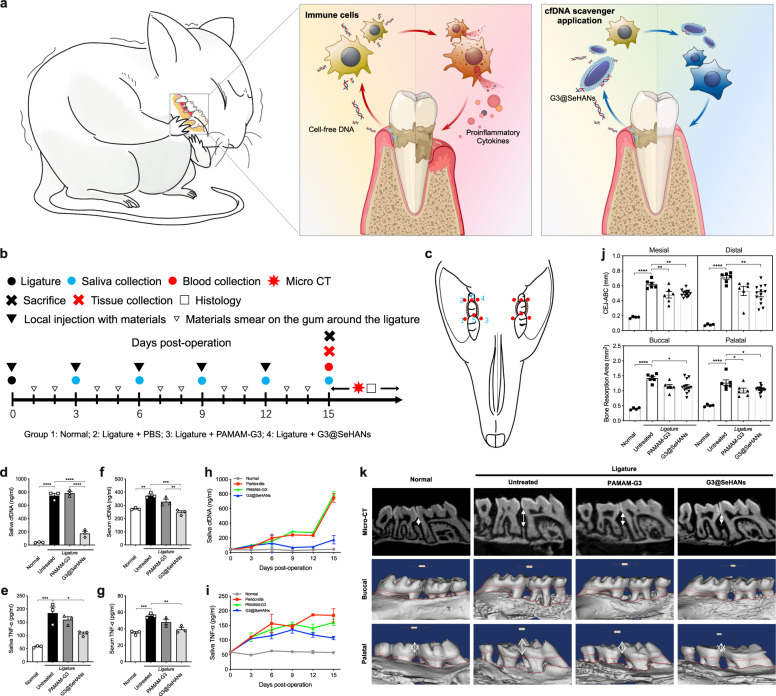
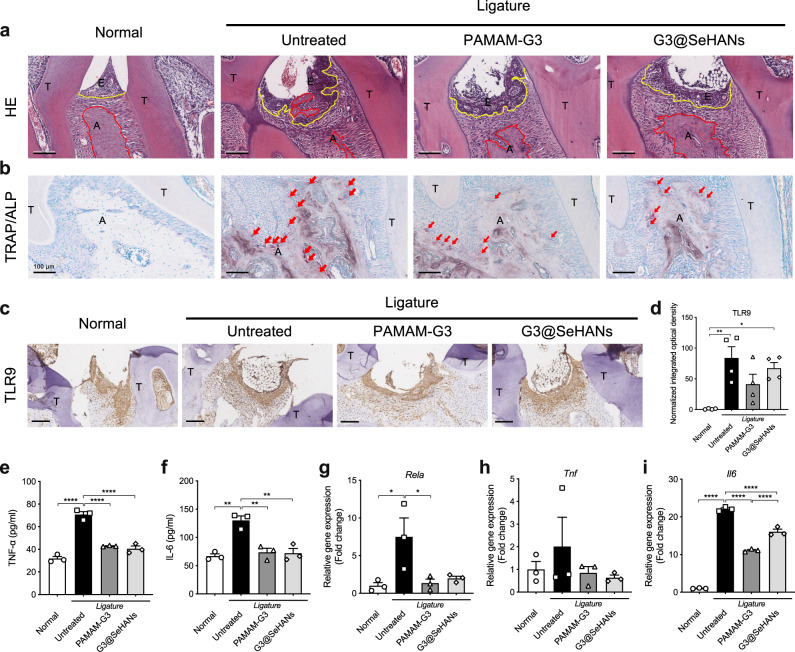
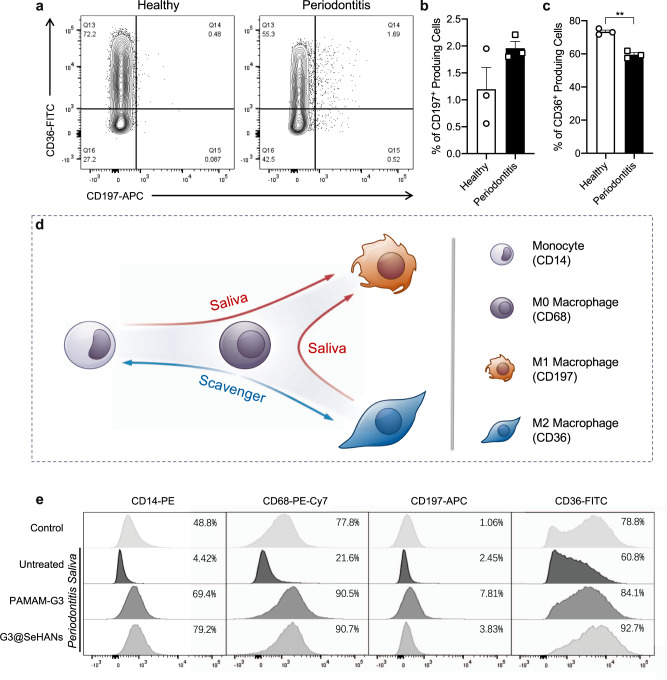
Periodontitis is a common type of inflammatory bone loss and a risk factor for systemic diseases. The pathogenesis of periodontitis involves inflammatory dysregulation, which represents a target for new therapeutic strategies to treat periodontitis. After establishing the correlation of cell-free DNA (cfDNA) level with periodontitis in patient samples, we test the hypothesis that the cfDNA-scavenging approach will benefit periodontitis treatment. We create a nanoparticulate cfDNA scavenger specific for periodontitis by coating selenium-doped hydroxyapatite nanoparticles (SeHANs) with cationic polyamidoamine dendrimers (PAMAM-G3), namely G3@SeHANs, and compare the activities of G3@SeHANs with those of soluble PAMAM-G3 polymer. Both G3@SeHANs and PAMAM-G3 inhibit periodontitis-related proinflammation in vitro by scavenging cfDNA and alleviate inflammatory bone loss in a mouse model of ligature-induced periodontitis. G3@SeHANs also regulate the mononuclear phagocyte system in a periodontitis environment, promoting the M2 over the M1 macrophage phenotype. G3@SeHANs show greater therapeutic effects than PAMAM-G3 in reducing proinflammation and alveolar bone loss in vivo. Our findings demonstrate the importance of cfDNA in periodontitis and the potential for using hydroxyapatite-based nanoparticulate cfDNA scavengers to ameliorate periodontitis.


Conflict of interest statement

The authors declare no competing interests.

Figures

Fig. 1
Fig. 1. cfDNA concentration in saliva and serum is positively correlated with the severity of periodontal inflammation, and cfDNA in saliva showed stronger correlation.
a cfDNA levels in saliva and serum of healthy volunteers (n = 10), gingivitis patients (n = 10) and periodontitis patients (n = 10). Data are means ± SEM; differences were assessed by one-way analysis of variance and Tukey’s multiple comparisons test. *P < 0.05, **P < 0.01, ***P < 0.001, ****P < 0.0001 (Saliva, P = 0.0004 between Healthy and Periodontitis, P = 0.0302 between Gingivitis and Periodontitis; Serum, P < 0.0001 between Healthy and Periodontitis, P < 0.0001 between Gingivitis and Periodontitis). b Scatter plot of cfDNA levels and parameters of periodontal examination. The color of the dot represents the group of subjects. The dark blue line is the fitted regression line, and the light blue shading around it is the 95% confidence interval. c Heatmap of the Spearman’s correlation coefficient “r” between cfDNA levels in body fluids and parameters of periodontal examination. PLI: plaque index (1-3); BI: bleeding index (1-5); PD: probing depth (mm). “Mean” value is the arithmetic mean of the records of all examined sites. “(>n)%” is the percentage of site with parameter greater than “n” to the total number of sites. “Max” is the maximum of all sites.
Fig. 2
Fig. 2. Characterization of G3@SeHANs.
a SEM imaging of SeHANs before and after coating with PAMAM-G3. bd XPS spectra. The N 1s photoelectron peak (398.9 eV) is present only in G3@SeHANs; Se 3d peaks (58.9 eV) are present in both SeHANs and G3@SeHANs. Representative images were from 3 independent experiments. e FTIR spectra. Both SeHANs and G3@SeHANs exhibit characteristic phosphate bands at 562, 603, and 1030 cm−1, and bands corresponding to O-Se-O bending vibration (783 cm−1) and hydroxyl groups (3570 cm−1). Peaks due to amino stretching vibration (3283 cm−1) and bending vibration of the amide N-H bond (1649 cm−1) are present only in G3@SeHANs. f The thermal decomposition rate of the nanoparticles changes after coating with PAMAM-G3. g Zeta potential of SeHANs and G3@SeHANs. Data are means ± SEM; differences were assessed by two-tailed Student’s t-test (n = 5) (P < 0.0001). h BET analysis of SeHANs and G3@SeHANs. i Size measurement of SeHANs and G3@SeHANs. Data are means ± SEM; differences were assessed by two-tailed Student’s t-test (n = 5) (P = 0.3898). j XRD analysis of SeHANs and G3@SeHANs. *P < 0.05, **P < 0.01, ***P < 0.001, ****P < 0.0001.
Fig. 3
Fig. 3. G3@SeHANs block periodontitis-related TLR9 proinflammatory response in vitro.
a, b Activation of HEK-TLR9 reporter cells by healthy human saliva and periodontitis patient saliva, and activation of HEK-TLR9 reporter cells by healthy human serum and periodontitis patient serum. Data are means ± SEM; *P < 0.05, **P < 0.01, ***P < 0.001, ****P < 0.0001 by assessed by two-tailed Student’s t-test (n = 4 or 5) (a, P = 0.0077; b, P = 0.0002). c, d Activation of HEK-TLR9 reporter cells by periodontitis patient saliva and periodontitis patient serum in the absence or presence of PAMAM-G3 (2 μg/mL) or G3@SeHANs (10 μg/mL) for 24 h. Data are means ± SEM; n = 3 independent experiments; *P < 0.05, **P < 0.01, ***P < 0.001, ****P < 0.0001 by one-way ANOVA with Tukey’s multiple comparison test (c, P < 0.0001 between Control and Untreated, P = 0.0013 between Untreated and PAMAM-G3, P = 0.0003 between Untreated and G3@SeHANs; d, P < 0.0001 between Control and Untreated, P = 0.0111 between Untreated and PAMAM-G3, P = 0.0333 between Untreated and G3@SeHANs). e Activation of HEK-TLR9 reporter cells by DAMPs from gingival keratinocytes, gingival fibroblasts, mitochondrion, and MAMPs from Porphyromonas gingivalis, or Fusobacterium nucleatum in the absence or presence of PAMAM-G3 (2 μg/mL) or G3@SeHANs (10 μg/mL) for 24 h. Data are means ± SEM; *P < 0.05, **P < 0.01, ***P < 0.001, ****P < 0.0001 by one-way ANOVA with Tukey’s multiple comparison test (n = 4 for mitochondrion DMAPs, n = 3 for the other DAMPs and MAMPs) (Gingival keratinocytes, P < 0.0001 between Control and Untreated, P = 0.0004 between Untreated and PAMAM-G3, P = 0.0003 between Untreated and G3@SeHANs; gingival fibroblasts, P < 0.0001 between Control and Untreated, P = 0.0013 between Untreated and PAMAM-G3, P = 0.0150 between Untreated and G3@SeHANs; mitochondrion, P = 0.0153 between Control and Untreated, P = 0.0031 between Untreated and PAMAM-G3, P = 0.0416 between Untreated and G3@SeHANs; Porphyromonas gingivalis, P < 0.0001 between Control and Untreated, P < 0.0001 between Untreated and PAMAM-G3, P < 0.0001 between Untreated and G3@SeHANs; Fusobacterium nucleatum, P < 0.0001 between Control and Untreated, P = 0.0363 between Untreated and G3@SeHANs). f Activation of HEK-TLR9 reporter cells by cfDNA from periodontitis patient saliva or serum, genomic DNA, mtDNA, and CpG DNA in the absence or presence of PAMAM-G3 (2 μg/mL) or G3@SeHANs (10 μg/mL) for 24 h. Data are means ± SEM; *P < 0.05, **P < 0.01, ***P < 0.001, ****P < 0.0001 by one-way ANOVA with Tukey’s multiple comparison test (n = 4 for mitochondrial DNA, n = 3 for the other DNA) (cfDNA from saliva, P = 0.0158 between Control and Untreated, P = 0.0015 between Untreated and G3@SeHANs; mitochondrial DNA, P = 0.0360 between Control and Untreated, P = 0.0073 between Untreated and PAMAM-G3, P = 0.0123 between Untreated and G3@SeHANs; CpG DNA, P < 0.0001 between Control and Untreated, P < 0.0001 between Untreated and PAMAM-G3, P < 0.0001 between Untreated and G3@SeHANs).
Fig. 4
Fig. 4. cfDNA-scavenging mechanisms by G3@SeHANs and PAMAM-G3.
a Enlarged images show intracellular localization of CpG oligonucletides and cationic materials in RAW 264.7 cells after a 12 h incubation. Scale bar, 20 μm. Colocalized CpG and cationic materials appear as white spots, and are indicated by arrows. Representative images were from 3 independent experiments. b cfDNA-scavenging mechanisms of G3@SeHANs and PAMAM-G3.
Fig. 5
Fig. 5. G3@SeHANs alleviate inflammatory bone loss in ligature-induced periodontitis.
a Schematic of mechanism by which cfDNA promotes bone loss; cfDNA-scavenging nanoparticles may prevent bone loss and alleviate periodontitis. b, c Experimental schedule of in vivo study. PAMAM-G3 (200 µg/mL), G3@SeHANs (1 mg/mL), or PBS (control group) were administered locally by injection with a microsyringe into gingival tissue at 5 µL per site at 6 sites around the ligature: the mesiobuccal gingiva, distobuccal gingiva, mesiopalatal gingiva, distopalatal gingiva, and mesial and distal gingival papilla. Microinjections were performed on days 0, 3, 6, 9, and 12. On experimental days without injections, materials or PBS were noninvasively smeared on the gingiva with disposable microapplicators. Both sides of the mice were treated with the same materials. Levels of (d) saliva cfDNA, (e) saliva TNF-α, (f) serum cfDNA, and (g) serum TNF-α at 15 days post-operation. Data are means ± SEM; n = 3 samples per group; *P < 0.05, **P < 0.01, ***P < 0.001, ****P < 0.0001 by one-way ANOVA with Tukey’s multiple comparison test (d, P < 0.0001 between Normal and Untreated, P < 0.0001 between Untreated and G3@SeHANs, P < 0.0001 between PAMAM-G3 and G3@SeHANs; e P = 0.0006 between Normal and Untreated, P = 0.0124 between Untreated and G3@SeHANs; f P = 0.0023 between Normal and Untreated, P = 0.0004 between Untreated and G3@SeHANs, P = 0.0078 between PAMAM-G3 and G3@SeHANs; g P = 0.0009 between Normal and Untreated, P = 0.0035 between Untreated and G3@SeHANs). h, i Changes in cfDNA and TNF-α concentrations in the saliva of mice. Data are means ± SEM; n = 3 samples per group. j Bone loss measured by the vertical distance between the cementoenamel junction (CEJ) and alveolar bone crest (ABC) (CEJ-ABC) and the bone resorption area. Data are means ± SEM; n = 4 for normal group, n = 6 for untreated and PAMAM-G3 groups, n = 13 for G3@SeHANs group; *P < 0.05, **P < 0.01, ****P < 0.0001 by one-way ANOVA with Tukey’s multiple comparison test (Mesial, P < 0.0001 between Normal and Untreated, P = 0.0028 between Untreated and PAMAM-G3, P = 0.0026 between Untreated and G3@SeHANs; Distal, P < 0.0001 between Normal and Untreated, P = 0.0027 between Untreated and G3@SeHANs; Buccal, P < 0.0001 between Normal and Untreated, P = 0.0151 between Untreated and G3@SeHANs; Palatal, P < 0.0001 between Normal and Untreated, P = 0.0399 between Untreated and PAMAM-G3, P = 0.0339 between Untreated and G3@SeHANs). (k) Micro-CT scanning and 3D reconstruction of the bone loss.
Fig. 6
Fig. 6. G3@SeHANs inhibit cellular proinflammatory response in ligature-induced periodontitis.
a H&E staining of periodontal tissues on day 15 after G3@SeHAN administration. Scale bars, 100 μm. Inflammatory cell infiltration into the epithelium and bone destruction were evident in the untreated model, whereas G3@SeHAN treatment prevented these pathological changes. (E, epithelium; A, alveolar bone; T, tooth; yellow line indicates epithelial basement membrane; red line indicates alveolar bone crest). b TRAP/ALP staining of periodontal tissues on day 15 after G3@SeHAN administration. Scale bars, 100 μm. The number of TRAP+ osteoclasts (red arrows) in the untreated group was higher than in the DNA scavenger-treated groups. c IHC staining of TLR9 in periodontal tissues on day 15 after G3@SeHAN administration. Scale bars, 100 μm. TLR9 expression increased significantly in the untreated group; treatment with G3@SeHAN or PAMAM-G3 reduced TLR9 expression. Images (ac) were representative of three independent mice. d Expression of TLR9 in the epithelium of periodontal tissues. Data are means ± SEM; n = 4 samples per group; *P < 0.05, **P < 0.01, ***P < 0.001, ****P < 0.0001 by one-way ANOVA with Tukey’s multiple comparison test (P = 0.0035 between Normal and Untreated, P = 0.0171 between Normal and G3@SeHANs). (ei) TNF-α and IL-6 levels in periodontal tissues, and relative gene expression of Rela, Tnf, and Il6 in periodontal tissues. Data are means ± SEM; n = 3 samples per group; *P < 0.05, **P < 0.01, ***P < 0.001, ****P < 0.0001 by one-way ANOVA with Tukey’s multiple comparison test (e, P < 0.0001 between Normal and Untreated, P < 0.0001 between Untreated and PAMAM-G3, P < 0.0001 between Untreated and G3@SeHANs; f P = 0.0010 between Normal and Untreated, P = 0.0022 between Untreated and PAMAM-G3, P = 0.0018 between Untreated and G3@SeHANs; g P = 0.0315 between Normal and Untreated, P = 0.0411 between Untreated and PAMAM-G3; i P < 0.0001 between Normal and Untreated, P < 0.0001 between Untreated and PAMAM-G3, P < 0.0001 between Untreated and G3@SeHANs, P < 0.0001 between PAMAM-G3 and G3@SeHANs).
Fig. 7
Fig. 7. Effects of G3@SeHANs on macrophage polarization.
ac Expression of the M1 marker CD197 and the M2 marker CD36 in THP-1 cells activated by periodontitis saliva. Data are means ± SEM; differences were assessed by two-tailed Student’s t-test (n = 3 samples per group) (c, P = 0.0011). d Schematic of macrophage polarization by periodontitis saliva and role of cationic cfDNA scavengers. e Effects of periodontitis saliva and cationic scavengers on expression of CD14, CD68, CD197, and CD36 in THP-1 cells. *P < 0.05, **P < 0.01.

References

    1. Crump KE, Sahingur SE. Microbial Nucleic Acid Sensing in Oral and Systemic Diseases. J. Dent. Res. 2016;95:17–25. doi: 10.1177/0022034515609062. - DOI - PMC - PubMed
    1. Preshaw PM, et al. Periodontitis and diabetes: a two-way relationship. Diabetologia. 2012;55:21–31. doi: 10.1007/s00125-011-2342-y. - DOI - PMC - PubMed
    1. Araújo VMA, Melo IM, Lima V. Relationship between Periodontitis and Rheumatoid Arthritis: Review of the Literature. Mediators Inflamm. 2015;2015:259074. doi: 10.1155/2015/259074. - DOI - PMC - PubMed
    1. Liwinski, T., Zheng, D. & Elinav, E. The microbiome and cytosolic innate immune receptors. Immunol Rev, 10.1111/imr.12901 (2020). - PubMed
    1. Gu, Y. & Han, X. Toll-Like Receptor Signaling and Immune Regulatory Lymphocytes in Periodontal Disease. Int J Mol Sci21, 10.3390/ijms21093329 (2020). - PMC - PubMed

Publication types