. 2022 Oct 7;13(1):5929.
doi: 10.1038/s41467-022-33632-y.

The spike gene is a major determinant for the SARS-CoV-2 Omicron-BA.1 phenotype

Affiliations

The spike gene is a major determinant for the SARS-CoV-2 Omicron-BA.1 phenotype

G Tuba Barut et al. Nat Commun. .

Abstract

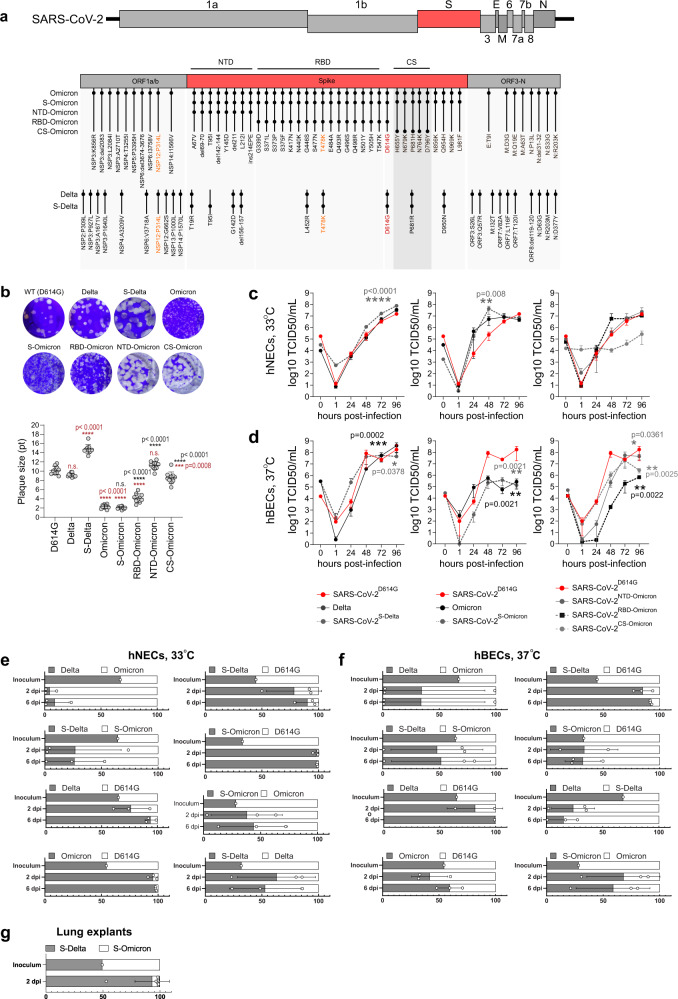
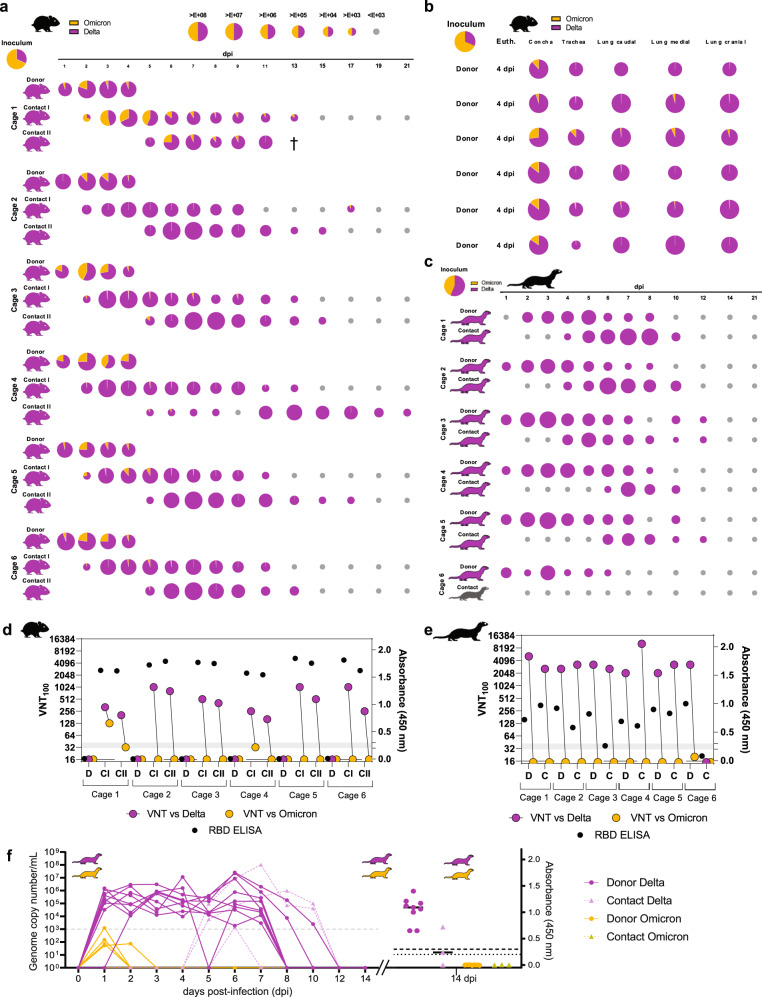
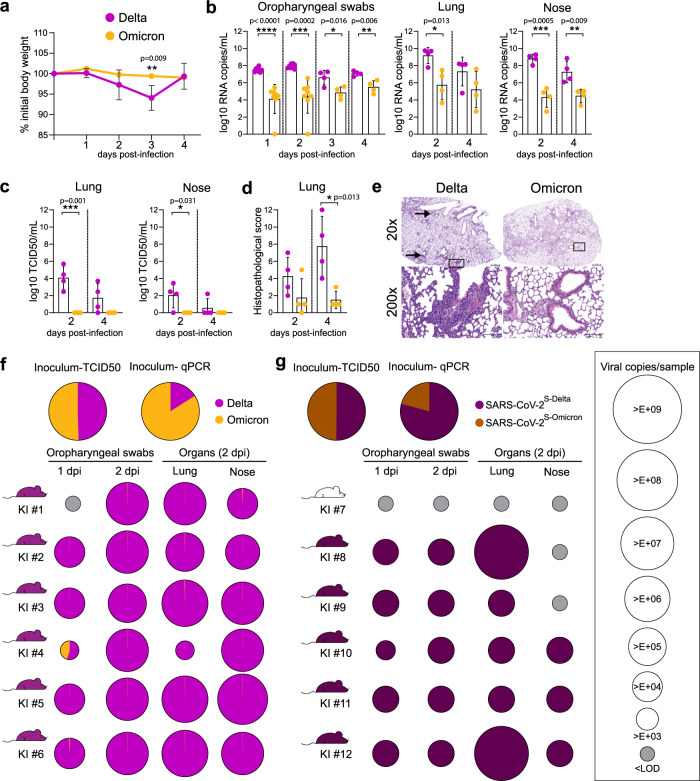
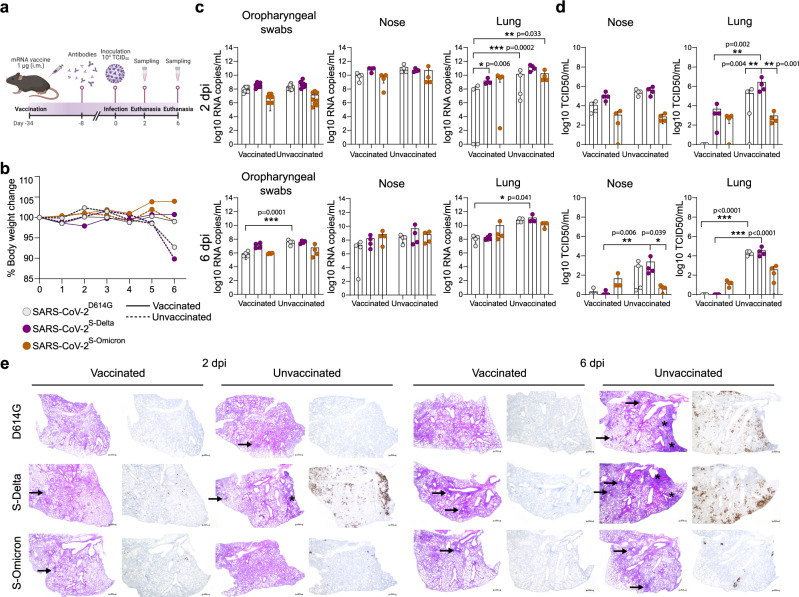
Variant of concern (VOC) Omicron-BA.1 has achieved global predominance in early 2022. Therefore, surveillance and comprehensive characterization of Omicron-BA.1 in advanced primary cell culture systems and animal models are urgently needed. Here, we characterize Omicron-BA.1 and recombinant Omicron-BA.1 spike gene mutants in comparison with VOC Delta in well-differentiated primary human nasal and bronchial epithelial cells in vitro, followed by in vivo fitness characterization in hamsters, ferrets and hACE2-expressing mice, and immunized hACE2-mice. We demonstrate a spike-mediated enhancement of early replication of Omicron-BA.1 in nasal epithelial cultures, but limited replication in bronchial epithelial cultures. In hamsters, Delta shows dominance over Omicron-BA.1, and in ferrets Omicron-BA.1 infection is abortive. In hACE2-knock-in mice, Delta and a Delta spike clone also show dominance over Omicron-BA.1 and an Omicron-BA.1 spike clone, respectively. Interestingly, in naïve K18-hACE2 mice, we observe Delta spike-mediated increased replication and pathogenicity and Omicron-BA.1 spike-mediated reduced replication and pathogenicity, suggesting that the spike gene is a major determinant of replication and pathogenicity. Finally, the Omicron-BA.1 spike clone is less well-controlled by mRNA-vaccination in K18-hACE2-mice and becomes more competitive compared to the progenitor and Delta spike clones, suggesting that spike gene-mediated immune evasion is another important factor that led to Omicron-BA.1 dominance.


Conflict of interest statement

Authors declare that they have no competing interests.

Figures

Fig. 1
Fig. 1. Enhanced replication of Omicron-BA.1 in nasal but not bronchial epithelial cell cultures.
a Genome sequences were compared to the SARS-CoV-2D614G WT virus and lineage-defining mutations (LDM) are depicted. The D614G mutation is highlighted in red, while the mutations highlighted in orange are either present in both Delta and Omicron, or in Omicron, S-Omicron, RBD-Omicron, Delta, and S-Delta, but not in SARS-CoV-2D614G. b The plaque sizes of viruses in 6-well plates 2 dpi. Sizes of 10 plaques/wells from one biological replicate were measured in Adobe Illustrator. Data are presented as mean+/−SD. Statistical significance was determined using ordinary one-way Anova and p-values were adjusted using Tukey’s multiple-comparison test; *P < 0.05, **P < 0.01, ***P < 0.001, ****P < 0.0001. Statistical significance of the differences of each virus vs. SARS-CoV-2D614G WT virus are demarcated with the red asterisks, whereas the black asterisks indicate the comparison of the Omicron spike subdomain clones to Omicron. c, d Human nasal (NEC) (n = 3 donors) and bronchial epithelial cell (BEC) (n = 3) cultures were infected with 104 TCID50 of the SARS-CoV-2 variants from the apical side and incubated at 33 °C (NECs) or 37 °C (BECs) for 1 h. Virus titers were assessed by TCID50 assays on VeroE6/TMPRSS2 cells. The graph represents the titers obtained from three donors (mean+/−SD) from one biological replicate. Statistical significance was determined using two-way ANOVA and p-values were adjusted using Tukey’s multiple-comparison test; *P < 0.05, **P < 0.01, ***P < 0.001, ****P < 0.0001. e–g NECs (n = 3), BECs (n = 3), or PCLS (n = 3) were infected with virus mixtures at a 1:1 ratio based on genome equivalents (GE) calculated by qPCR. Apical washes were collected at 2 and 6 dpi for the NECs and BECs and 2 dpi for PCLS. RNA was extracted from apical washes and sequenced on the MinION platform (Oxford Nanopore Technologies). Virus ratios were calculated for each donor based on the mean frequency of unique LDM mutations for each virus present in the mixture (for more details: Supplementary Fig. 1). Values shown represent the mean ratio/donor (circles) and the mean ratio/time point (bars) for each virus mixture (mean+/−SD). Each data point represents one biological replicate. Source data for Fig. 1 are provided as a Source Data file 1. Source Data file 1.
Fig. 2
Fig. 2. In vivo competitive co-infection and single infection studies with VOC Delta and Omicron-BA.1 in Syrian hamsters and ferrets.
Simultaneous co-inoculation of six donor hamsters and ferrets each with a Delta:Omicron-BA.1 mixture (hamster, ratio of 1:2.16, total 104.5 TCID50/hamster and ferrets, ratio of 1:1.43, total 104.75 TCID50/ferret) and sequential pairwise co-housing of contact animals. All data were quantified using RT-qPCR. Pie chart size represents the total amount of viral RNA (vRNA) detected in each sample (exact vRNA equivalents are found in Source Data files and the coloring shows the individual VOC ratio). Animal silhouettes are colored according to the dominant (>66%) VOC. Limit of detection was set at 103 vRNA copies per mL. a Nasal washings of Donor and Contact I + II Syrian hamster pairs from 1 to 21 dpi. b vRNA in URT and LRT of donor hamsters at 4 dpi. c Nasal washings of Delta and Omicron-BA.1 co-inoculated Donor and respective Contact ferrets for the 21-day infection period. d, e Antibody detection in hamsters (d) and ferrets (e) via VNT100 and RBD-ELISA after simultaneous Delta and Omicron-BA.1 co-inoculation shown for donor (D), contact (C), contact I (CI), and contact II (CII) animals. Specific neutralizing capacity of sera against the Delta (pink) and Omicron-BA.1 (yellow) virus pair were analyzed. Reactivity of sera below 1:32 pre-dilution was considered negative. Generalized seroreaction was also determined by RBD-ELISA (black dots). f vRNA detection and seroreactivity in ferrets after infection with single virus (Delta or Omicron-BA.1); donor animals (solid line) (n = 9) and contact animals (dashed line) (n = 3). Limit of detection was set at 103 vRNA copies per mL and for antibody detection at >0.2 (questionable) and >0.3 (positive). Source data are provided as a Source Data file 2. Source Data file 2.
Fig. 3
Fig. 3. Delta spike mutations drive enhanced fitness in hACE2-knock-in mice.
ae hACE2-KI mice (7–16 week-old male, n = 8 mice/virus) were intranasally inoculated with 104.3 TCID50 of Delta or Omicron. a Average relative weight loss after infection (Relative weight loss data from each animal is given in Supplementary Fig. 9). b Viral copies per mL of oropharyngeal swabs or per lung and nose sample (n = 16 mice) quantified using E-gene probe-specific RT–qPCR. c Infectious virus titers from the lung and nose samples (n = 16 mice) determined using TCID50 assays in VeroE6/TMPRSS2 cells. d, e Histopathological score and hematoxylin and eosin staining from Delta- and Omicron-infected lung sections (n = 16 mice) at 2 and 4 dpi. Perivascular and peribronchiolar lymphohistiocytic inflammation are highlighted with an arrow, and the higher magnification represented in the lower panel corresponds to the areas highlighted by a square in the upper panel. Scale bars, 500 (upper panel) and 100 µm (lower panel). Data are mean ± s.d. from the indicated number of biological replicates from a single experiment. The color key in a also applies to b, c and d. Statistical significance was determined using an unpaired two-tailed Student t-test; *P < 0.05, **P < 0.01, ***P < 0.001, ****P < 0.0001. f, g hACE2-KI mice (7–19 week-old female, n = 6 mice/group) were intranasally inoculated with 104 TCID50 of a 1:1 mix of f Delta and Omicron, or g SARS-CoV-2S-Delta and SARS-CoV-2S-Omicron. qPCR quantification of the ratio of the two variants or recombinant viruses present in the inoculum is reported. Oropharyngeal swabs were collected 1 and 2 dpi; lung and nose tissues were collected on 2 dpi. Pie charts show the ratio of variants detected in each sample at the indicated dpi (n = 6 mice/group). Pie chart sizes are proportional to the total number of viral genome copies per ml (swabs) or per sample (tissues), as shown in the legend on the right. Gray pies indicate values below the LOD (i.e., 103 viral RNA copies per mL/sample). Mouse silhouettes are colored to indicate the dominant SARS-CoV-2 variant (>66%) in the last positive swab sample from the corresponding mouse. KI numbers 1–12 denote individual hACE2-KI mice. Data was obtained from one experiment. Source data are provided as a Source Data file 3. Source Data file 3.
Fig. 4
Fig. 4. mRNA vaccine induced reduction in replication and pathogenesis of SARS-CoV-2 clones in K18-hACE2 transgenic mice.
a Female K18-hACE2 transgenic mice (7–15 weeks old, n = 8 mice/group) were immunized intramuscularly with a single dose of 1 μg of mRNA-Vaccine Spikevax (Moderna). After 2 weeks the neutralizing antibody titers against SARS-CoV-2 were determined (Supplementary Fig. 10a). Later, mice were intranasally inoculated with 104 TCID50 of SARS-CoV-2D614G, SARS-CoV-2S-Delta, or SARS-CoV-2S-Omicron. Body weight change and clinical scores of the mice were monitored daily. b The mean body weight change is presented (Data from individual animals are shown in Supplementary Fig. 10b). Only the unvaccinated mice infected with SARS-CoV-2D614G and SARS-CoV-2S-Delta showed noticeable weight loss. c Oropharyngeal swabs, lung and nose samples of the infected mice were collected at 2 or 6 days post-infection (dpi) to determine the viral load (n = 4 for each virus). Viral RNA-dependent RNA polymerase (RdRp) gene copies were quantified using probe-specific RT–qPCR. d Infectious virus titers from the lung and nose samples (n = 8 mice/group) were determined using TCID50 assays in VeroE6/TMPRSS2 cells. e Hematoxylin and eosin stain (left panel) and immunohistochemical analysis specific for SARS-CoV-2 nucleocapsid protein (right panel) of lung sections in vaccinated (A) and unvaccinated mice (B) at 2 and 6 dpi following infection with SARS-CoV-2D614G (n = 3), SARS-CoV-2S-Delta (n = 3), and SARS-CoV-2S-Omicron (n = 4). Consolidated lung areas are highlighted with a star, and perivascular and peribronchiolar lymphohistiocytic inflammation highlighted with an arrow. Scale bars, 500 µm. Data are mean ± s.d. from the indicated number of biological replicates. The color key in b also applies to c and d. Statistical significance was determined using two-way ANOVA (ad) and P-values were adjusted using Tukey’s multiple-comparison test; *P < 0.05, **P < 0.01, ***P < 0.001, ****P < 0.0001. Data were obtained from one experiment. Each data point represents one biological replicate. Source data are provided as a Source Data file 4. Source Data file 4.

Similar articles

Cited by

References

    1. Motozono C, et al. SARS-CoV-2 spike L452R variant evades cellular immunity and increases infectivity. Cell Host Microbe. 2021;29:1124–1136 e11. doi: 10.1016/j.chom.2021.06.006. - DOI - PMC - PubMed
    1. Liu Y, et al. Delta spike P681R mutation enhances SARS-CoV-2 fitness over Alpha variant. Cell Rep. 2022;39:110829. doi: 10.1016/j.celrep.2022.110829. - DOI - PMC - PubMed
    1. ECDC. Implications of the Emergence and Spread of the SARSCoV-2 B.1.1. 529 Variant of Concern (Omicron), for the EU/EEA (ECDC, 2021).
    1. Cele S, et al. Omicron extensively but incompletely escapes Pfizer BNT162b2 neutralization. Nature. 2022;602:654–656. - PMC - PubMed
    1. Wilhelm, A. et al. Reduced neutralization of SARS-CoV-2 Omicron variant by vaccine sera and monoclonal antibodies. medRxiv10.1101/2021.12.07.21267432 (2021).

Publication types