. 2022 Oct 7;13(1):5918.
doi: 10.1038/s41467-022-33642-w.

Prevalence and mechanisms of somatic deletions in single human neurons during normal aging and in DNA repair disorders

Affiliations

Prevalence and mechanisms of somatic deletions in single human neurons during normal aging and in DNA repair disorders

Junho Kim et al. Nat Commun. .

Abstract

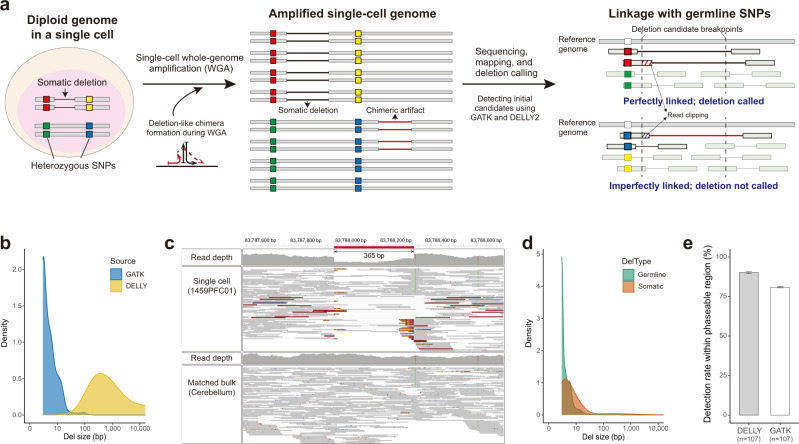
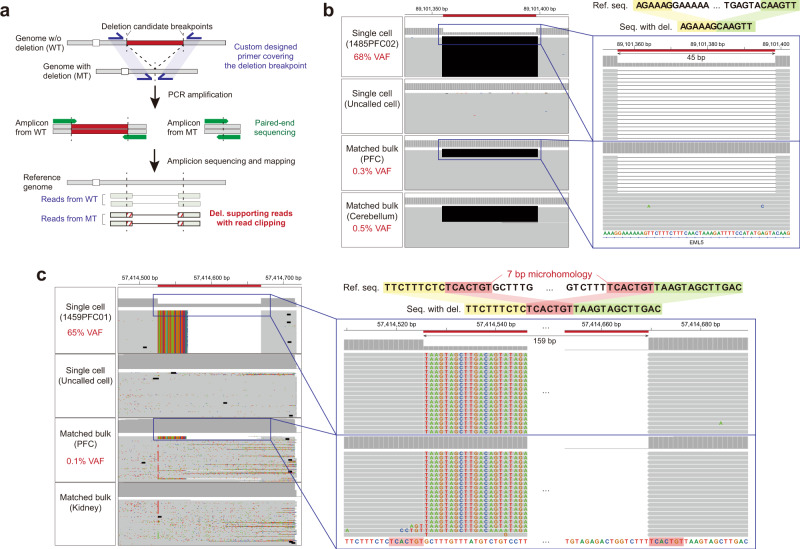
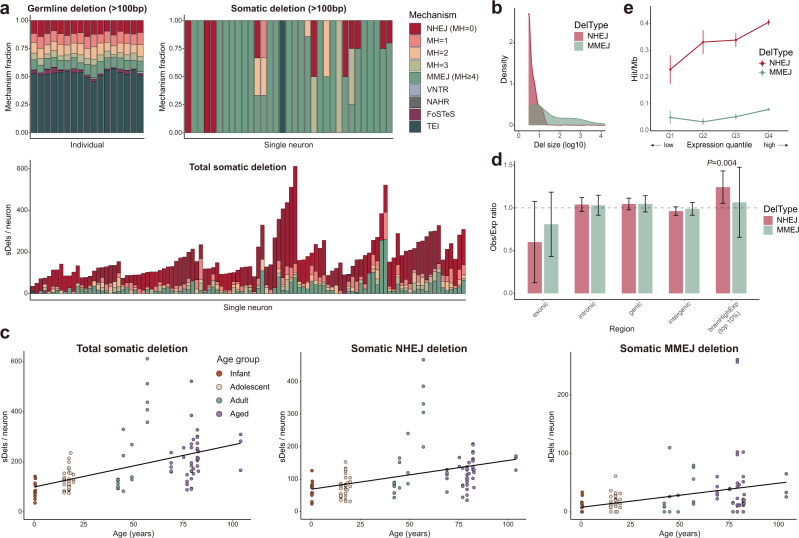
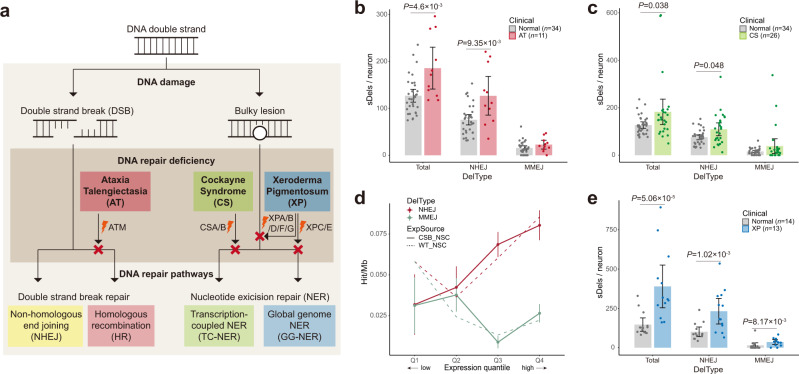
Replication errors and various genotoxins cause DNA double-strand breaks (DSBs) where error-prone repair creates genomic mutations, most frequently focal deletions, and defective repair may lead to neurodegeneration. Despite its pathophysiological importance, the extent to which faulty DSB repair alters the genome, and the mechanisms by which mutations arise, have not been systematically examined reflecting ineffective methods. Here, we develop PhaseDel, a computational method to detect focal deletions and characterize underlying mechanisms in single-cell whole genome sequences (scWGS). We analyzed high-coverage scWGS of 107 single neurons from 18 neurotypical individuals of various ages, and found that somatic deletions increased with age and in highly expressed genes in human brain. Our analysis of 50 single neurons from DNA repair-deficient diseases with progressive neurodegeneration (Cockayne syndrome, Xeroderma pigmentosum, and Ataxia telangiectasia) reveals elevated somatic deletions compared to age-matched controls. Distinctive mechanistic signatures and transcriptional associations suggest roles for somatic deletions in neurodegeneration.


Conflict of interest statement

The authors declare no competing interests.

Figures

Fig. 1
Fig. 1. Linkage-based detection of somatic deletions in single-cell WGS data.
a Schematic of PhaseDel. A true somatic deletion (black line) shows complete linkage with one allele (red) of a nearby heterozygous SNP whereas a deletion-like amplification artifact (red line) shows incomplete linkage with a nearby SNP allele (blue). PhaseDel utilizes raw calls from GATK and DELLY2 methods and makes final calls based on the linkage patterns of the initial deletion candidates. Box filled with diagonal lines represents clipped part of the read. b Deletion size distribution of two initial callers, GATK and DELLY2. c Integrative Genomics Viewer (IGV) screenshots of an example somatic deletion of 365 bp identified by PhaseDel. Upper and lower tracks demonstrate mapped reads from single-cell and bulk WGS data from the same individual, respectively. A reference allele of a heterozygous SNP on the right side of the deletion (red bar in the read depth track and no display in the WGS track) shows perfect linkage with the deletion-supporting reads (e.g., clipped reads). The deleted genomic region clearly shows a read depth decrease. d The size of somatic and germline deletions detected from 107 single neurons of 18 normal individuals. e The fraction of gold-standard germline deletions in phaseable regions detected by PhaseDel. n, number of single neurons; bar graph, mean ± 95% confidence interval (CI). Source data are provided as a Source Data file.
Fig. 2
Fig. 2. Validation of somatic deletions by ultra-deep amplicon sequencing.
a Illustration of validation sequencing with custom amplicons targeting predicted deletion breakpoints. Box filled with red diagonal lines represents clipped part of the read. WT wild-type, MT mutant. b Example of a validated low-level mosaic deletion. An IGV screenshot shows reads supporting the breakpoints of a 45-bp deletion (black line) in amplicon sequencing datasets of MDA-amplified DNA from the same single-cell from which PhaseDel called the deletion (VAF 68%) and bulk DNA from PFC and cerebellum of the same donor (VAF 0.3% and 0.5%) whereas MDA-amplicon sequencing of a different cell did not show any supporting read (second track). c Another validated mosaic deletion of 159 bp with 7 bp microhomology. Flanking reference genome sequences around deletion breakpoints are shown together (shaded by yellow and green for the left and right side of the breakpoint). Shared subsequence on both sides of the deletion breakpoint (microhomology) is shaded in red.
Fig. 3
Fig. 3. Somatic nanodeletions in single-neurons increase with age and reflect distinctive underlying repair mechanisms.
a Contributions of the predicted mechanisms to deletion formation: germline deletions (>100 bp) per individual (upper left, 18 individuals), somatic deletions (>100 bp) per cell (upper right, 31 cells), and total somatic deletions per cell (lower, 107 cells). Individuals and single neurons are presented in order of age and deletion rate within each individual. Single cells with all deletions <100 bp are omitted in the upper right panel. Detailed criteria for mechanism prediction are described in Methods. MH microhomology. b The size of NHEJ- and MMEJ-based somatic deletions. c Somatic deletion counts by age with linear regression lines. Each point represents a single neuron. Total (left), NHEJ-based (MH = 0, middle), and MMEJ-based (MH ≥ 4, right) somatic deletions all showed a significant increase with age (P = 3.3 × 10−6, 4.78 × 10−5, 1.44 × 10−3; linear mixed model). d Enrichment of somatic deletions in different genomic regions. Y axis represents the ratio of somatic deletion counts for each category to expected counts from simulation. n = 1000 independently simulated sets; bar graph, mean ± 95% CI; empirical P = 0.004. e Somatic deletion burden by gene expression quantile in normal PFC. n = 1000 bootstrap deletion sets; mean ± SEM. Source data are provided as a Source Data file.
Fig. 4
Fig. 4. Increased burden and distinctive patterns of somatic deletions in neurons of individuals with DNA repair deficiencies.
a Three DNA repair-defective diseases (AT, CS, XP) and their corresponding defective repair pathways. b, c, e Total and NHEJ- and MMEJ-based deletion burdens in AT (b), CS (c), and XP (e) single neurons compared to age-matched controls. n, number of single neurons; bar graph, mean ± 95% CI; two-sided Mann–Whitney U test. d Distinctive associations of somatic deletion burden in CS PFC neurons with gene expression in different conditions. RNA-seq data from iPSC-derived neural stem cells from CS patients (CSB_NSC, solid lines) and normal controls (WT_NSC, dashed lines) were used to associate with the burden of NHEJ- (red) and MMEJ-based deletions (green) from CS PFC neurons. n = 1000 bootstrap deletion sets; mean ± SEM. Source data are provided as a Source Data file.

References

    1. Lee Y, McKinnon PJ. Responding to DNA double strand breaks in the nervous system. Neuroscience. 2007;145:1365–1374. doi: 10.1016/j.neuroscience.2006.07.026. - DOI - PubMed
    1. Iyama T, Wilson DM., III DNA repair mechanisms in dividing and non-dividing cells. DNA Repair (Amst.) 2013;12:620–636. doi: 10.1016/j.dnarep.2013.04.015. - DOI - PMC - PubMed
    1. Vilenchik MM, Knudson AG. Endogenous DNA double-strand breaks: production, fidelity of repair, and induction of cancer. Proc. Natl Acad. Sci. USA. 2003;100:12871–12876. doi: 10.1073/pnas.2135498100. - DOI - PMC - PubMed
    1. Madabhushi R, et al. Activity-induced DNA breaks govern the expression of neuronal early-response genes. Cell. 2015;161:1592–1605. doi: 10.1016/j.cell.2015.05.032. - DOI - PMC - PubMed
    1. Rass U, Ahel I, West SC. Defective DNA repair and neurodegenerative disease. Cell. 2007;130:991–1004. doi: 10.1016/j.cell.2007.08.043. - DOI - PubMed

Publication types