. 2022 Oct 7;12(1):16867.
doi: 10.1038/s41598-022-20866-5.

Spontaneous activity patterns in human motor cortex replay evoked activity patterns for hand movements

Affiliations

Spontaneous activity patterns in human motor cortex replay evoked activity patterns for hand movements

Tomer Livne et al. Sci Rep. .

Abstract

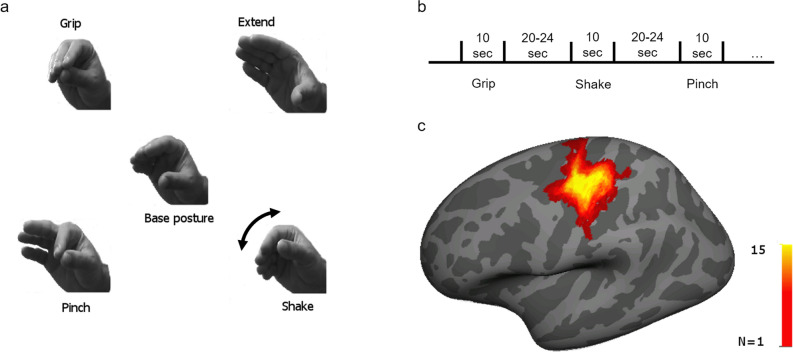
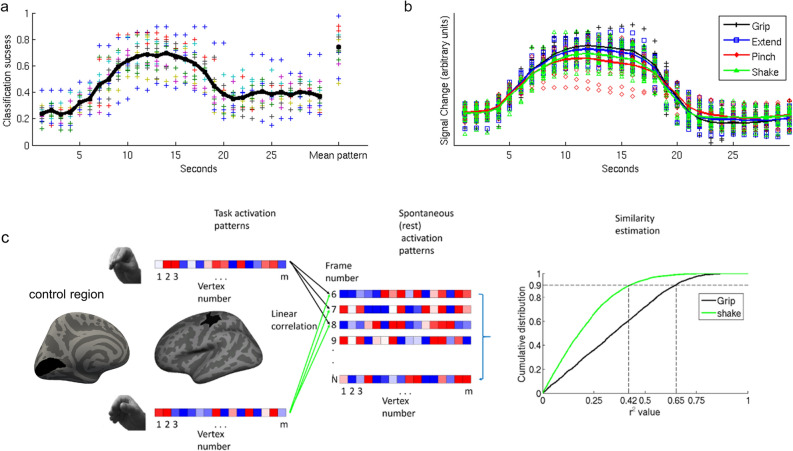
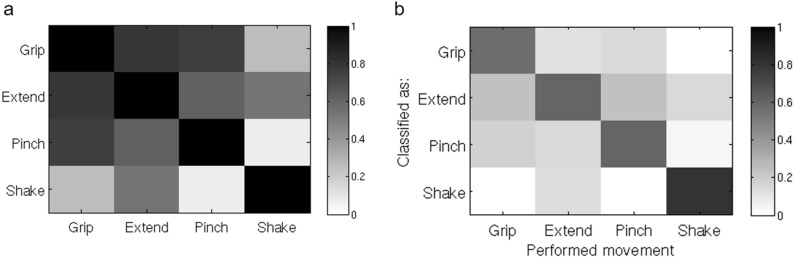
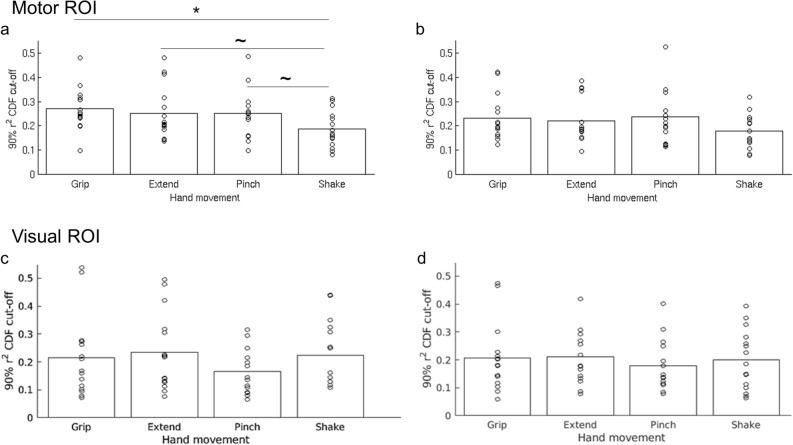
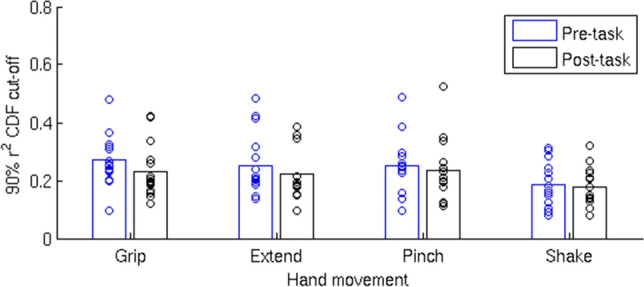
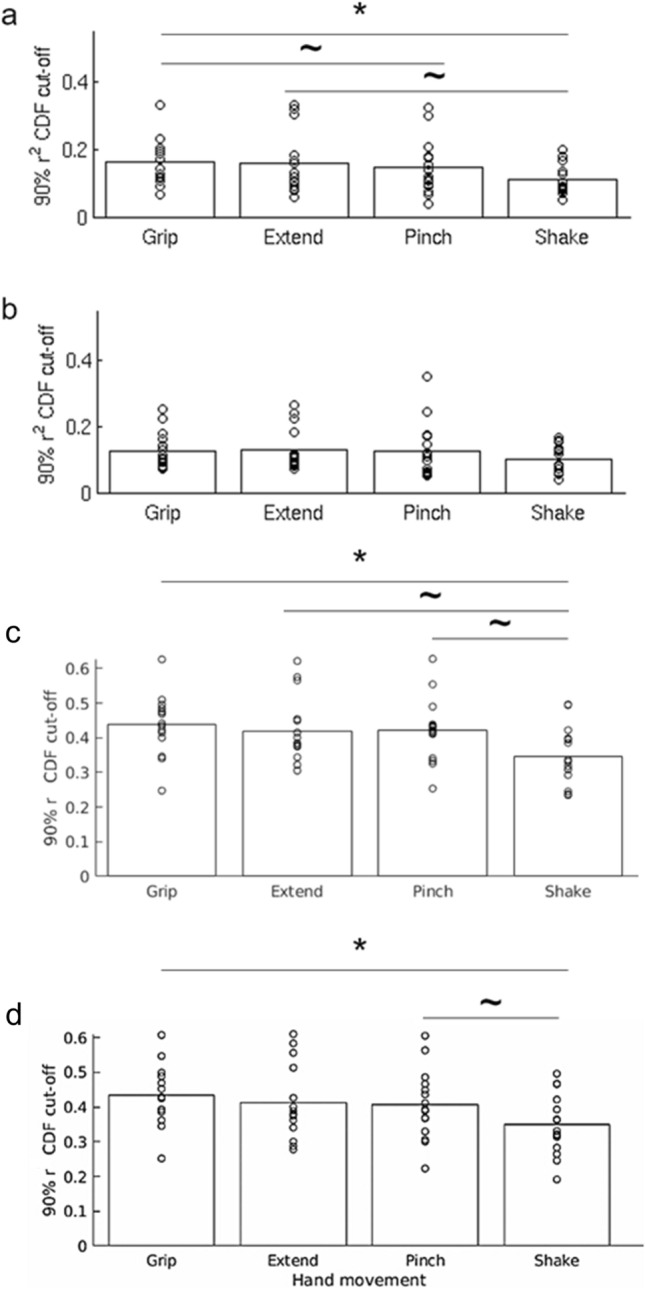
Spontaneous brain activity, measured with resting state fMRI (R-fMRI), is correlated among regions that are co-activated by behavioral tasks. It is unclear, however, whether spatial patterns of spontaneous activity within a cortical region correspond to spatial patterns of activity evoked by specific stimuli, actions, or mental states. The current study investigated the hypothesis that spontaneous activity in motor cortex represents motor patterns commonly occurring in daily life. To test this hypothesis 15 healthy participants were scanned while performing four different hand movements. Three movements (Grip, Extend, Pinch) were ecological involving grip and grasp hand movements; one control movement involving the rotation of the wrist was not ecological and infrequent (Shake). They were also scanned at rest before and after the execution of the motor tasks (resting-state scans). Using the task data, we identified movement-specific patterns in the primary motor cortex. These task-defined patterns were compared to resting-state patterns in the same motor region. We also performed a control analysis within the primary visual cortex. We found that spontaneous activity patterns in the primary motor cortex were more like task patterns for ecological than control movements. In contrast, there was no difference between ecological and control hand movements in the primary visual area. These findings provide evidence that spontaneous activity in human motor cortex forms fine-scale, patterned representations associated with behaviors that frequently occur in daily life.


Conflict of interest statement

The authors declare no competing interests.

Figures

Figure 1
Figure 1
(a) The four different hand movements used in the study. Center—base hand posture for all movements. In each condition participants were asked to repeatedly and smoothly alternate between the base hand posture and one of the other four positions, creating the different hand movements. Top left—Grip movement, closing hand; top right—Extend movement, opening hand; bottom left—Pinch movement, closing only two fingers; bottom right—Shake movement, rotation of the wrist. Grip, Extend and Pinch were coded as ecological hand movements. Shake movement was chosen as the control movement. (b) experimental design—participants completed five task runs (except for one participant who completed seven runs, and another who completed only four), and each run included twelve motor blocks (three of each movement) of 10 s continuous hand movement. Task blocks were separated by rest blocks (20–24 s long). (c) Motor ROI—for each participant we identified a motor cortex region of interest (ROI) in which the BOLD activation for all the motor tasks was significantly higher than baseline activity. ROIs were identified on the native cortical surface of each participant. For presentation purposes only all ROIs were projected on an average surface (Freesurfer fsaverage) and summed together. The color scale represents the number of participants for which the specific vertex on the surface was included in the ROI. Talairach coordinates of the center of mass of the summed ROIs [− 36, − 23, 55].
Figure 2
Figure 2
(a) Classification performance through a linear discriminant analysis indicated that the classification performance between the different hand movements through the pattern of motor activation at each TR followed the hemodynamic response function with a gradual increase in performance starting ~ 6 s after trial onset (spearman r between the mean classification function and the mean BOLD signal representing a full trial, combining all the conditions together, is 0.876). The rightmost data points represent classification performance based on the mean activation patterns constructed by averaging the patterns of the frames starting 10 s after trial onset and ending at 18 s after trial onset. Different colors represent different participants, the black trace represents mean classification levels across participants. Chance level of correct classification was 0.25. For presentation purposes only, each data point of the two participants who were scanned using a 2 s TR was duplicated in the figure (TR #1 is presented as second 1 & 2, etc.). (b) Mean BOLD time course for the four hand movement conditions. Each data point represents the mean normalized BOLD signal change of each participant to her baseline BOLD activity across all ROI vertices in a specific time point during the block. The solid lines represent the mean normalized BOLD signal change across participants corresponding to each hand movement. For presentation purpose only each data point of the two participants who were scanned using a 2 s TR was duplicated in the figure. (c) A spatial pattern was defined for each hand movement in the participant-defined motor ROI. Each of the four task patterns were compared to the spatial pattern of the same vertices in each rest frame using Pearson correlation. For each pattern, we computed the cumulative distribution function (CDF) of r2 values across all rest frames. In each CDF of each participant we calculated the value corresponding to the 90th percentile of that function (vertical dashed lines). This value was used to estimate the degree of representation of the specific pattern in the rest data. The same analysis was performed in a control ROI, the primary visual area.
Figure 3
Figure 3
(a) Similarity matrix of task-defined patterns. Pearson correlation was used to estimate the similarity between the different patterns used in the main analysis. Similarity between the Grip, Extend, and Pinch patterns was higher than their similarity to the Shake pattern. the color scale represents the mean Pearson r values across all the participants. (b) Confusion matrix representing the mean correct classification rate of each movement pattern (diagonal) and the misclassification rate as a function of the incorrect response given by the classifier. The figure shows that the similar patterns (Grip, Extend, and Pinch) were misclassified as each other more often than they were misclassified as the Shake movement. The color scale represents the fraction of cases in which the tested pattern (x-axis—the performed movement) was classified as each of the four movements (y-axis).
Figure 4
Figure 4
(a) r2 cut-off values of the four different hand movements’ patterns in the pre-task rest data (all participants). Grip had the highest cut-off value indicating that this pattern was most represented in the pre-task spontaneous activity. The lowest cut-off value was that of the Shake condition, indicating the it was the least represented pattern in the pre-task resting data. The difference between the Grip and the Shake conditions was significant following a correction for multiple comparisons (*). Both comparisons—Extend vs Shake, and Pinch vs Shake were significant before correction, but did not survive the correction for multiple comparisons ( ~). (b) r2 cut-off values in the post-task rest data. No significant differences were found in the post-task data in terms of r2 cut-off values of the different conditions. Bottom panels: r2 cut-off values in the pre-task rest (c) and post-task rest (d) data in the visual area. No significant differences were found in both timepoints in terms of r2 cut-off values of the different conditions.
Figure 5
Figure 5
A comparison between the similarity of each task-defined pattern and the pre- and post-task rest spontaneous patterns. In the Grip and the Extend condition there was a trend indicating a reduction in the overall observed similarity in the post-task rest relative to the pre-task rest. No such reduction was observed for the Pinch and Shake conditions.
Figure 6
Figure 6
(a) r2 cut-off values of the four different hand movements’ spatio-temporal patterns in the pre-task rest data. There was a significant main effect of movement (F(3,42) = 5.36, p = 0.0032) in a repeated measures ANOVA. Grip had the highest cut-off value (0.165) indicating that this pattern was the one most represented in the pre-task spontaneous activity. The lowest cut-off value was that of the Shake condition (0.11), indicating that it was the one least represented in the pre-task data. Only the difference between the Grip and the Shake conditions was significant following a correction for multiple comparisons (* t(14) = 3.66, p = 0.0026). The comparisons of Extend (0.159) vs Shake and Grip vs Pinch (0.145) were significant before correction but did not survive correcting for multiple comparisons (~ t(14) = 2.485, p = 0.026, and t(14) = 2.21, p = 0.044, respectively). (b) r2 cut-off values in the post-task rest data using the spatio-temporal patterns. No significant differences were found in the post task data in terms of r2 values of the different conditions. (c) The main analysis was repeated considering r values (instead of r2 values) for the computation of the 90th cut-off of the CDF, and (d) inverting r values (multiplied by -1) – refer to the text for details.

Similar articles

Cited by

References

    1. Raichle ME, et al. A default mode of brain function. Proc. Natl. Acad. Sci. USA. 2001;98:676–682. doi: 10.1073/pnas.98.2.676. - DOI - PMC - PubMed
    1. Xiong J, et al. Long-term motor training induced changes in regional cerebral blood flow in both task and resting states. Neuroimage. 2009;45:75–82. doi: 10.1016/j.neuroimage.2008.11.016. - DOI - PMC - PubMed
    1. Greicius MD, Krasnow B, Reiss AL, Menon V. Functional connectivity in the resting brain: A network analysis of the default mode hypothesis. Proc. Natl. Acad. Sci. USA. 2003;100:253–258. doi: 10.1073/pnas.0135058100. - DOI - PMC - PubMed
    1. Nir Y, et al. Widespread functional connectivity and fMRI fluctuations in human visual cortex in the absence of visual stimulation. Neuroimage. 2006;30:1313–1324. doi: 10.1016/j.neuroimage.2005.11.018. - DOI - PubMed
    1. Golland Y, Golland P, Bentin S, Malach R. Data-driven clustering reveals a fundamental subdivision of the human cortex into two global systems. Neuropsychologia. 2008;46:540–553. doi: 10.1016/j.neuropsychologia.2007.10.003. - DOI - PMC - PubMed

Publication types