. 2022 Oct 7;13(1):5915.
doi: 10.1038/s41467-022-33663-5.

Common anti-cancer therapies induce somatic mutations in stem cells of healthy tissue

Affiliations

Common anti-cancer therapies induce somatic mutations in stem cells of healthy tissue

Ewart Kuijk et al. Nat Commun. .

Abstract

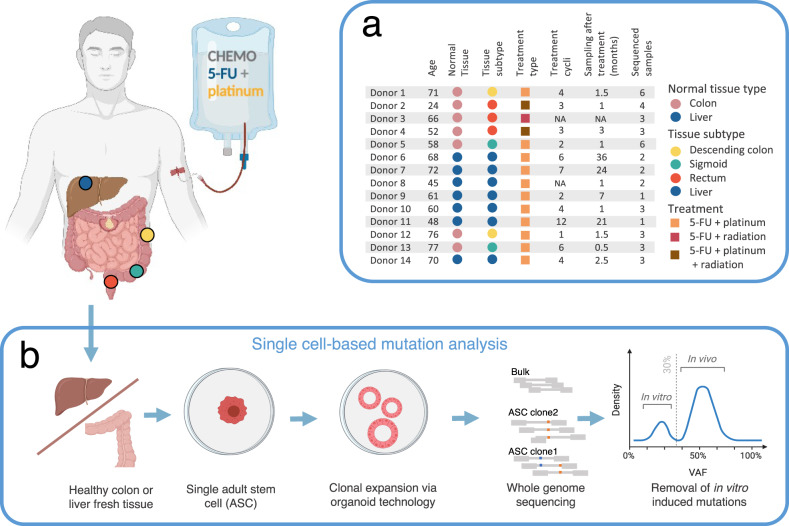
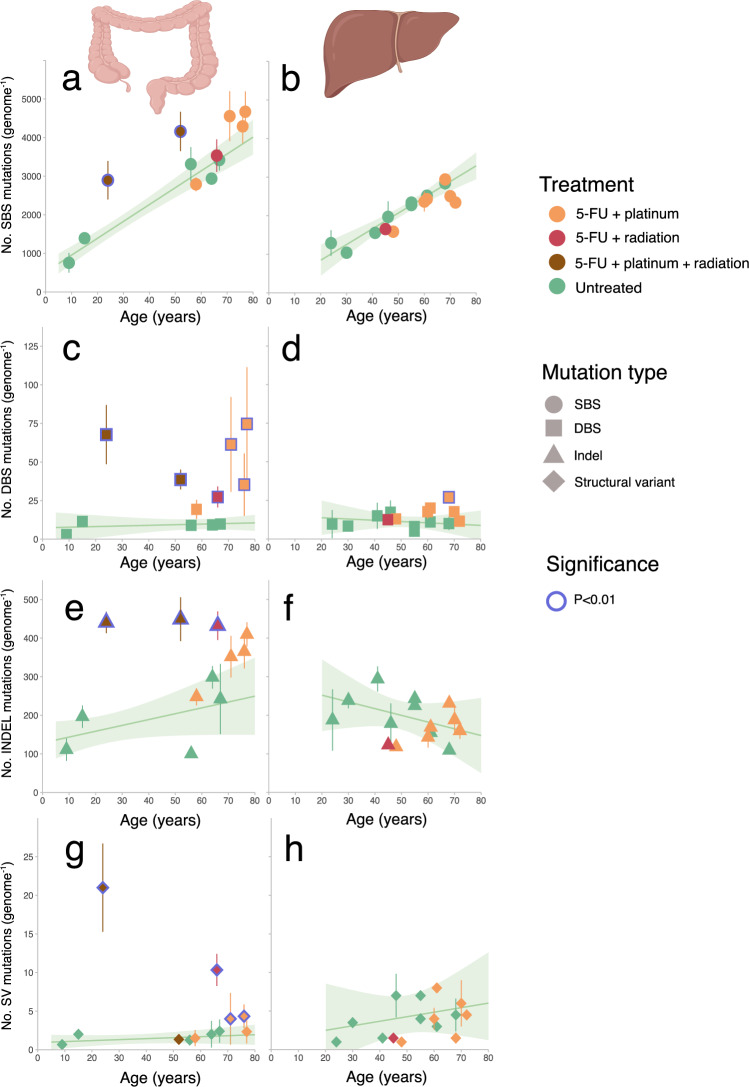
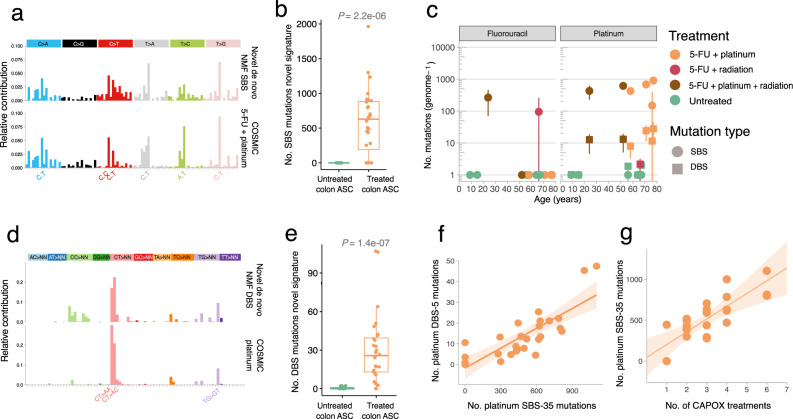
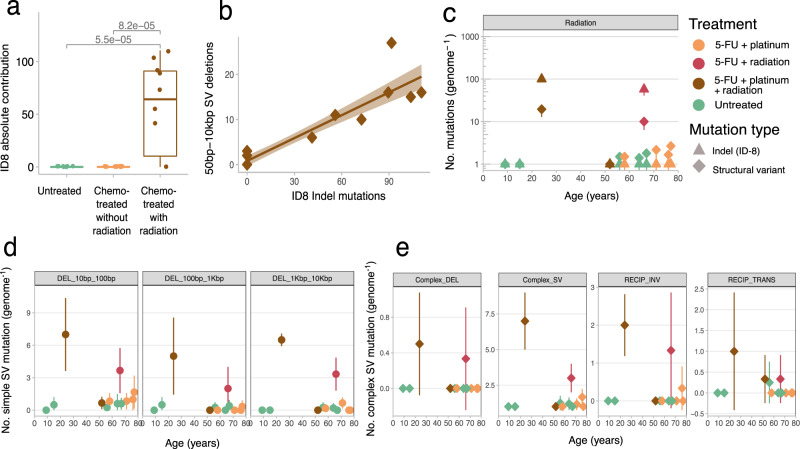
Genome-wide mutation analyses have revealed that specific anti-cancer drugs are highly mutagenic to cancer cells, but the mutational impact of anti-cancer therapies on normal cells is not known. Here, we examine genome-wide somatic mutation patterns in 42 healthy adult stem cells (ASCs) of the colon or the liver from 14 cancer patients (mean of 3.2 ASC per donor) that received systemic chemotherapy and/or local radiotherapy. The platinum-based chemo-drug Oxaliplatin induces on average 535 ± 260 mutations in colon ASC, while 5-FU shows a complete mutagenic absence in most, but not all colon ASCs. In contrast with the colon, normal liver ASCs escape mutagenesis from systemic treatment with Oxaliplatin and 5-FU. Thus, while chemotherapies are highly effective at killing cancer cells, their systemic use also increases the mutational burden of long-lived normal stem cells responsible for tissue renewal thereby increasing the risk for developing second cancers.


Conflict of interest statement

The authors declare no competing interests.

Figures

Fig. 1
Fig. 1. Experimental design.
a Clinical overview of the 14 treated donors used in this study. The table describes the pathological details, treatment history and the number of adult stem cell (ASC) samples analyzed per donor. b Schematic of the experimental setup to determine genome-wide somatic mutations in individual healthy colorectal and liver ASC from patients who have received CapOx chemotherapy and/or radiotherapy treatment. For this, fresh colorectal and liver normal tissue was derived from the resection margin around the colorectal tumor during surgical removal of respectively primary colorectal tumors or colorectal tumors metastasized to the liver to derive healthy colon or liver tissue, respectively. Subsequently, fresh healthy tissue was minced, dissociated into single adult stem cells (ASCs) solutions and in vitro expanded into clonal organoid cultures to obtain sufficient DNA for WGS. Polyclonal tissue was also sequenced to identify and exclude germline variants. Heterozygous mutations present in the individual ASC at the start of culture display a variant allele frequency (VAF) of ~50%. Mutations that are introduced during in vitro culturing, after the single-cell step, have a VAF under 30% and were discarded. The obtained in vivo mutation dataset from single colorectal and liver ASCs from treated cancer patients were compared to mutation burdens from untreated donors as well as subjected to mutational signature analysis to quantify the 5-FU (prodrug of CAPecitabine), platinum (OXaliplatin) and radiation-induced mutational impact. This figure was partly created with BioRender.com.
Fig. 2
Fig. 2. Mutational impact on mutation burden.
a, b Singe base substitution (SBS), c, d double base substitution (DBS), e, f indel and g, h structural variant (SV) mutation burden (y axis) as a function of age (x axis) for respectively healthy colorectal and liver ASCs. Each data point represents the mean mutation burden per donor and the error bars represent the standard deviation of the mutation burden. The color of each point depicts the treatment history. The number of sequenced ASC per donor (n) varies from 1 up to 6 samples and is listed in Fig. 1a. The cohort size for treated and untreated colorectal ASCs are respectively 6 and 7 donors while 8 and 7 donors are included for respectively the untreated and treated liver cohort. The green lines display the expected mutation burden of the indicated mutation types calculated from untreated ASCs using a bootstrapped linear mixed effects model (LMM) approach. The shaded areas cover the standard deviation of the LMM of the corresponding regression lines. Treated donors with a significantly increased mutation burden (i.e., more than expected from normal aging modeled from untreated donors (p < 0.01)) are marked with blue circles. This figure was partly created with BioRender.com. Source data are provided as a Source Data file.
Fig. 3
Fig. 3. Chemotherapy-induced mutations in healthy colorectal ASCs.
a The distinct extracted de novo SBS signature in treated healthy colorectal tissue resembles a mix of the COSMIC 5-FU and platinum mutation signatures (cosine sim = 0.88). b Box and whisker plot indicating the relative mutation contribution of the treated specific SBS mutation signature from colorectal ASCs between CapOx-treated (n = 7) and untreated (n = 5) colorectal donors. The here shown box and whiskers plot displays the first and the third quartiles (top and bottom of the box), the median (vertical line inside the box), the extremes (whiskers) and the single data points (single dots). A Wilcoxon rank-sum test between every cohort was performed and the p value is illustrated at the top of the plot. c 5-FU and platinum SBS and DBS mutation contributions (y axis) for each donor as a function of age (x axis). Each data point represents the mean mutation contribution per donor, the error bars represent the standard deviation and the color depicts the treatment history. The number of sequenced ASC per donor (n) varies from 1 up to 6 samples and is listed in Fig. 1a. The 5-FU and platinum mutation contributions are derived with refitting on the well-established platinum COSMIC signatures. d The distinct extracted de novo DBS signature in CapOx-treated ASCs from (n = 7) healthy colorectal donors. This signature resembles the COSMIC platinum DBS-5 mutation signature (cosine sim = 0.81). e Box and whisker plot indicating the relative mutation contribution of the treated specific DBS mutation signature from colorectal ASCs between oxaliplatin-treated (n = 7) and untreated (n = 5) donors. A Wilcoxon rank-sum test between every cohort was performed and the p value is illustrated at the top of the plot. f Scatterplot showing the relation between platinum SBS (x axis) and DBS (y axis) mutations, derived with refitting on the well-established platinum COSMIC signatures. The brown line displays the least-squares linear fit of (n = 25) oxaliplatin-treated ASCs while the shaded region represents the 95% confidence interval of the fit (Pearson’s r = 0.88). g Scatterplot showing the relation between the number of CapOx treatments (x axis) and platinum SBS mutations (y axis) of the (n = 25) oxaliplatin-treated ASCs. The p value of the treatment count effect in the LMM that controls for donor ID (two-tailed t-test) is 0.03. The shaded area represents the standard deviation of the LMM by treatment count effect. Source data are provided as a Source Data file.
Fig. 4
Fig. 4. Radiotherapy-induced mutations in healthy colorectal ASCs.
a Box and whisker plot indicating the absolute mutation contribution of COSMIC ID-8 indel signature between chemo-treated ASCs with (n = 10) and without (n = 18) radiotherapy and untreated (n = 19) colorectal ASCs. The box in the boxplot delimits the first and third quartiles of the distribution (with a line representing the median); the whiskers delimit the lowest data point above the first quartile minus 1.5 times the interquartile distance and the highest data point below the third quartile plus 1.5 times the interquartile distance. A Wilcoxon rank-sum test between every cohort was performed and the p value is illustrated at the top of the plot. b Scatterplot showing the relation between platinum ID-8 mutations (x axis) and structural deletion variants (y axis). The brown line displays the least-squares linear fit while the shaded region represents the 95% confidence interval of the fit (Pearson’s r = 0.92). c Radiotherapy-induced indel and structural variant mutation contributions (y axis) for each donor as a function of age (x axis). Each data point represents the mean mutation contribution per donor for the indicated mutation type. The error bars represent the standard deviation and the color of each point depicts the treatment history. The ID-8 mutation contributions are derived with refitting on the well-established COSMIC signatures. d, e Each data point represents the mean structural mutation contribution per donor, the error bars represent standard deviation and the color of each point depicts the treatment history. d Simple structural deletions (DEL) split by length, and e complex structural deletions subdivided by complex SV type: Deletion (DEL), SV (structural variant), RECIP_INV (reciprocal inversion) and RECIP_TRANS (reciprocal translocation). The number of sequenced ASC per donor (n) varies from 1 up to 6 samples and is listed in Fig. 1a. Source data are provided as a Source Data file.

References

    1. Rutter CM, et al. Secular trends in colon and rectal cancer relative survival. J. Natl Cancer Inst. 2013;105:1806–1813. doi: 10.1093/jnci/djt299. - DOI - PMC - PubMed
    1. Jemal, A. et al. Annual report to the nation on the status of cancer, 1975-2014, featuring survival. J. Natl. Cancer Inst. 109, djx030 (2017). - PMC - PubMed
    1. Behjati S, et al. Mutational signatures of ionizing radiation in second malignancies. Nat. Commun. 2016;7:12605. doi: 10.1038/ncomms12605. - DOI - PMC - PubMed
    1. Kocakavuk E, et al. Radiotherapy is associated with a deletion signature that contributes to poor outcomes in patients with cancer. Nat. Genet. 2021;53:1088–1096. doi: 10.1038/s41588-021-00874-3. - DOI - PMC - PubMed
    1. Christensen S, et al. 5-Fluorouracil treatment induces characteristic T>G mutations in human cancer. Nat. Commun. 2019;10:4571. doi: 10.1038/s41467-019-12594-8. - DOI - PMC - PubMed