. 2022 Nov;41(45):4960-4970.
doi: 10.1038/s41388-022-02458-9. Epub 2022 Oct 7.

MYC oncogene elicits tumorigenesis associated with embryonic, ribosomal biogenesis, and tissue-lineage dedifferentiation gene expression changes

Affiliations

MYC oncogene elicits tumorigenesis associated with embryonic, ribosomal biogenesis, and tissue-lineage dedifferentiation gene expression changes

Delaney K Sullivan et al. Oncogene. 2022 Nov.

Abstract

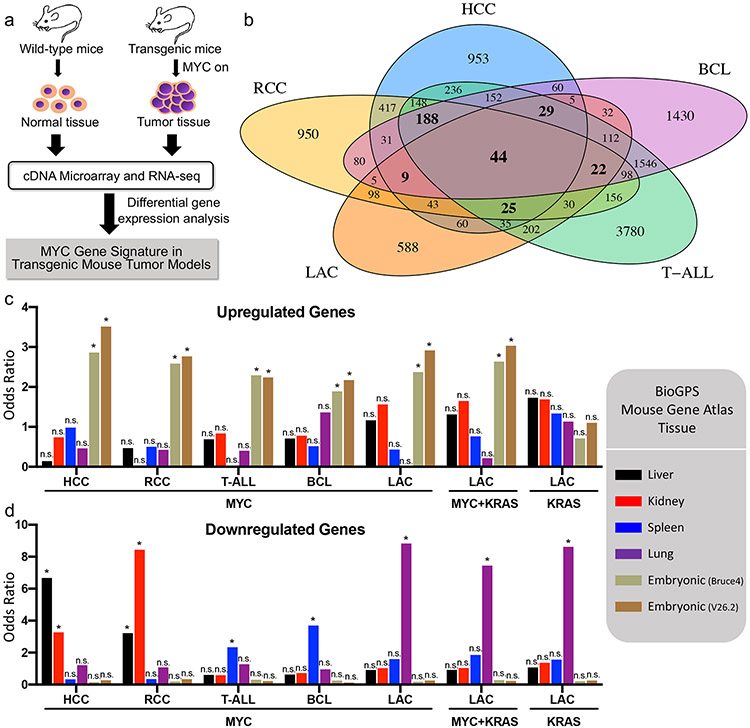
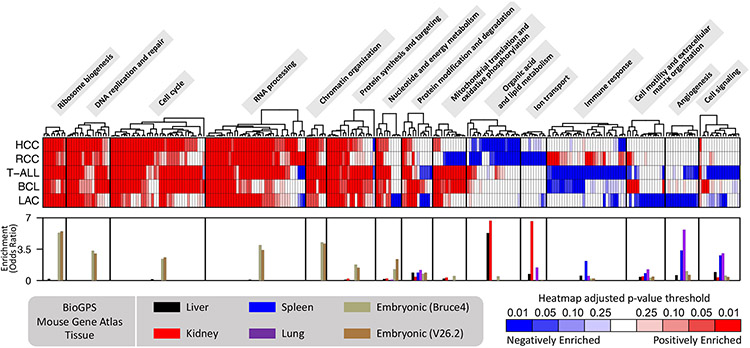
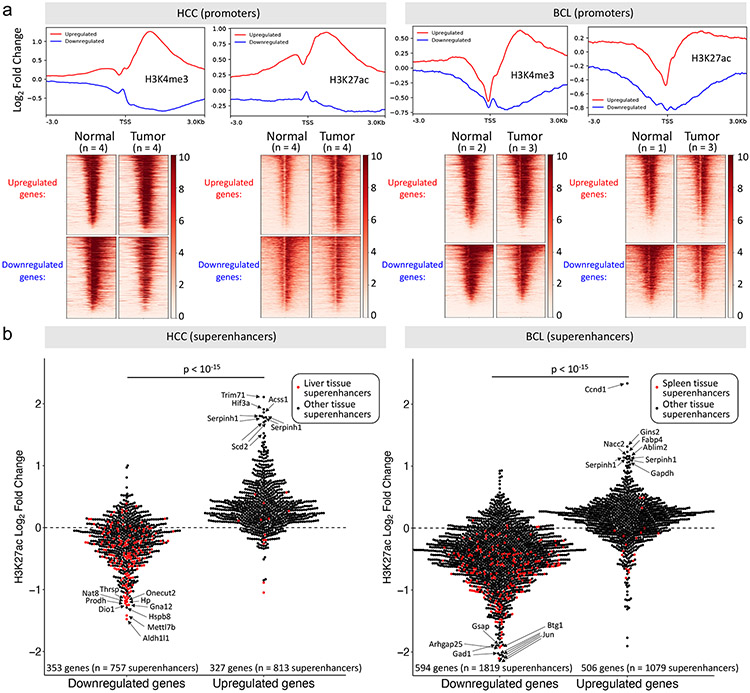
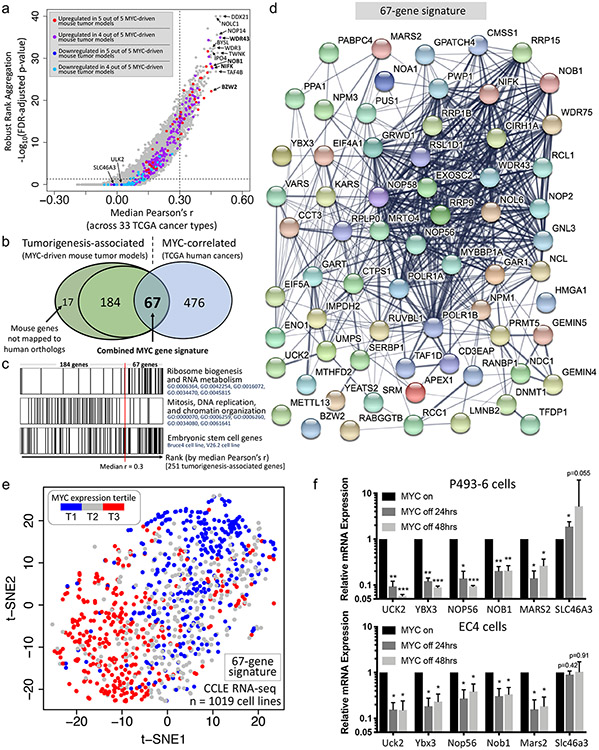
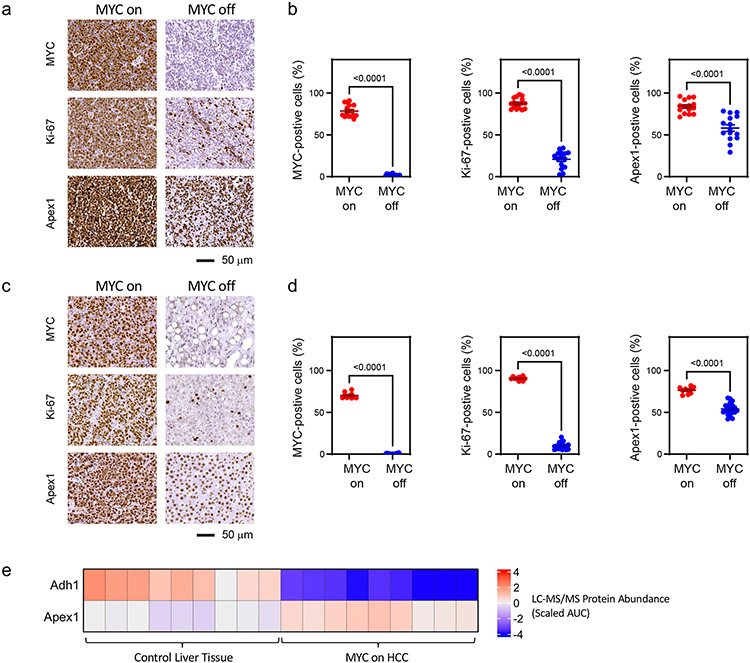
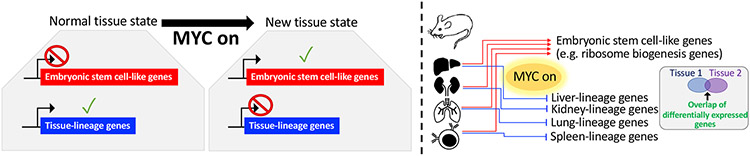
MYC is a transcription factor frequently overexpressed in cancer. To determine how MYC drives the neoplastic phenotype, we performed transcriptomic analysis using a panel of MYC-driven autochthonous transgenic mouse models. We found that MYC elicited gene expression changes mostly in a tissue- and lineage-specific manner across B-cell lymphoma, T-cell acute lymphoblastic lymphoma, hepatocellular carcinoma, renal cell carcinoma, and lung adenocarcinoma. However, despite these gene expression changes being mostly tissue-specific, we uncovered a convergence on a common pattern of upregulation of embryonic stem cell gene programs and downregulation of tissue-of-origin gene programs across MYC-driven cancers. These changes are representative of lineage dedifferentiation, that may be facilitated by epigenetic alterations that occur during tumorigenesis. Moreover, while several cellular processes are represented among embryonic stem cell genes, ribosome biogenesis is most specifically associated with MYC expression in human primary cancers. Altogether, MYC's capability to drive tumorigenesis in diverse tissue types appears to be related to its ability to both drive a core signature of embryonic genes that includes ribosomal biogenesis genes as well as promote tissue and lineage specific dedifferentiation.


Conflict of interest statement

Declaration of Interests

The authors have no conflicts of interest to disclose.

Figures

Figure 1.
Figure 1.. MYC overexpression selectively dysregulates embryonic stem cell genes and tissue-lineage genes in tumorigenesis
a, Workflow for identifying genes differentially expressed (DE) in MYC-induced transgenic mouse tumor models. b, Venn diagram of the DE genes among five MYC transgenic mouse models. c, Enrichment of mouse tissue-lineage genes among DE upregulated genes from transgenic mouse tumors. Mouse tissue-lineage genes are genes highly expressed in mouse liver, kidney, spleen, lung, or embryonic stem cell tissue based on BioGPS Mouse Gene Atlas data. For LAC, KRASG12D-induced (KRAS) and MYC/KRASG12D co-induced (MYC+KRAS) tumors were also included in addition to the MYC-induced tumors. d, Same as c except enrichment of mouse tissue-lineage genes was assessed among DE downregulated genes from transgenic mouse tumors. *p < 0.000595 (Bonferroni correction for 84 tests, α = 0.05, one-sided Fisher's exact test), n.s. = not significant.
Figure 2.
Figure 2.. Pathways associated with genes differentially expressed in MYC-driven tumorigenesis reflect tissue dedifferentiation
Gene ontology (GO) gene set enrichment analysis (GSEA) of genes, ranked by log2 fold change, was performed for each of the five MYC-induced transgenic mouse tumor models. Heatmap shows the GSEA adjusted p-values for the top GO terms among the different models. Each column of the heatmap represents a distinct GO term and similar GO terms were grouped together into pathways. The bar graphs at the bottom depict pathway enrichment among lung, liver, kidney, spleen, and embryonic stem cell tissue-lineage genes (BioGPS Mouse Gene Atlas); each bar shows the median enrichment across the GO terms in the pathway.
Figure 3.
Figure 3.. Gene expression changes in MYC-induced tumorigenesis are associated with epigenetic changes
a, Metagene plots and heatmaps showing changes in H3K4me3 and H3K27ac in the promoters of genes upregulated and downregulated in MYC-induced mouse HCC (left) and BCL (right) (GEO accession numbers: GSE76042 and GSE51004, respectively). Log2 fold changes reflect ChIP-Seq signal changes in tumor relative to normal tissue, both normalized to an input sample. b, ChIP-Seq H3K27ac signal changes in tumor relative to normal for superenhancers (obtained from dbSUPER) associated with genes upregulated and downregulated in the MYC-induced mouse HCC (left) and BCL (right) model. P-values were determined by two-sided Welch’s t-test.
Figure 4.
Figure 4.. A tumorigenesis gene signature that is highly associated with MYC expression in primary human cancers
a, One-sided volcano plot representing the pairwise Pearson correlation between each gene’s expression and MYC expression across 33 cancer types in The Cancer Genome Atlas (TCGA)’s RNA-seq dataset (n = 9354 primary human cancers). Robust rank aggregation (RRA) was performed across the 33 cancer types by ranking each gene by its Pearson correlation with MYC expression within each cancer type. b, Venn diagram showing the overlap between tumorigenesis-associated genes (genes considered upregulated in at least 4 out of 5 MYC-driven mouse tumor models) and MYC-correlated genes (genes with median Pearson’s r > 0.30 and RRA adjusted p-value < 0.05). This 67-gene overlap constitutes the combined MYC gene signature. c, Barcode plot showing the representation of two distinct pathways (based on gene ontology) and embryonic stem cell genes (based on BioGPS Mouse Gene Atlas data) among the tumorigenesis-associated genes when the genes are ordered from low correlation with MYC expression (left) to high correlation with MYC expression (right). d, Protein-protein interaction (PPI) network of genes from the 67-gene MYC gene signature. e, t-distributed stochastic neighbor embedding (t-SNE) plot showing the clustering of cancer cell lines (from CCLE RNA-seq data) based on this study’s 67-gene signature. MYC expression tertiles are colored. f, Changes in mRNA expression upon MYC inactivation of five selected signature genes plus SLC46A3 in P493-6 cells and EC4 cells, a cell line derived from a transgenic mouse HCC tumor. Error bars represent mean ± SD. *p < 0.05, **p < 0.01, ***p < 0.001, two-tailed one-sample Student's t test (n = 3 independent RT-qPCR experiments).
Figure 5.
Figure 5.. Examples of in situ gene expression changes upon alterations in MYC status
Immunohistochemical analysis of thymic tissue (a,b) from EμSRα-tTA/TetO-MYC mice (MYC on: n = 3, MYC off: n = 3) and liver tissue (c,d) from LAP-tTA/TetO-MYC mice (MYC on: n = 2, MYC off: n = 4). Tissues were evaluated for expression of MYC, Ki-67, and Apex1. a,c) Representative images of immuno-stained tissue sections. b,d) Quantified frequency of MYC-, Ki-67-, and Apex-1-positive cells. Five regions of interest were analyzed from each tissue sample. P-values were calculated using the two-sided Mann-Whitney U test. e, Liquid chromatography with tandem mass spectrometry (LC-MS/MS)-based proteomic analysis showing protein abundance changes for Adh1 and Apex1 in LAP-tTA/TetO-MYC mice (MYC on: n = 3 samples, Control liver tissue: n = 3 samples) (n = 3 technical replicates per sample). AUC: Area Under the Curve.
Figure 6.
Figure 6.. Proposed model for how MYC overexpression results in tissue-specific selective gene expression changes in tumorigenesis
Graphical representation showing that MYC overexpression results in a tissue state which involves higher expression of embryonic stem cell-like genes and lower expression of tissue-lineage genes. This gene expression program change is likely the result of both direct effects of MYC on gene expression in its capacity as a transcription factor as well as epigenetic changes.

References

    1. Dang CV. MYC on the path to cancer. Cell. 2012. Mar 30;149(1):22–35. - PMC - PubMed
    1. Gabay M, Li Y, Felsher DW. MYC activation is a hallmark of cancer initiation and maintenance. Cold Spring Harb Perspect Med. 2014. Jun 2;4(6):a014241. - PMC - PubMed
    1. Weinstein IB. Cancer. Addiction to oncogenes--the Achilles heal of cancer. Science. 2002. Jul 5;297(5578):63–4. - PubMed
    1. Felsher DW. MYC Inactivation Elicits Oncogene Addiction through Both Tumor Cell-Intrinsic and Host-Dependent Mechanisms. Genes Cancer. 2010. Jun;1(6):597–604. - PMC - PubMed
    1. Li Y, Casey SC, Felsher DW. Inactivation of MYC reverses tumorigenesis. J Intern Med. 2014. Jul;276(1):52–60. - PMC - PubMed

Publication types

Substances