

Ultrasound-based radiomics score for pre-biopsy prediction of prostate cancer to reduce unnecessary biopsies
- PMID: 36207777
- PMCID: PMC10092021
- DOI: 10.1002/pros.24442
Ultrasound-based radiomics score for pre-biopsy prediction of prostate cancer to reduce unnecessary biopsies
Abstract
Background: Patients undergoing prostate biopsies (PBs) suffer from low positive rates and potential risk for complications. This study aimed to develop and validate an ultrasound (US)-based radiomics score for pre-biopsy prediction of prostate cancer (PCa) and subsequently reduce unnecessary PBs.
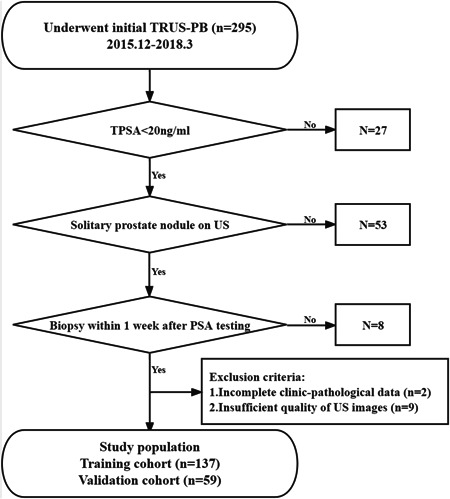
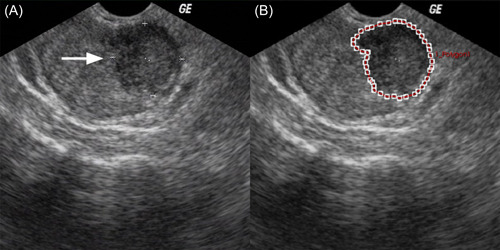
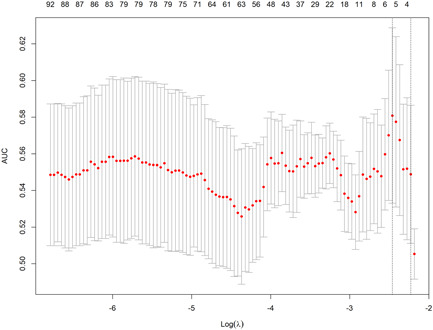
Methods: Between December 2015 and March 2018, 196 patients undergoing initial transrectal ultrasound (TRUS)-guided PBs were retrospectively enrolled and randomly assigned to the training or validation cohort at a ratio of 7:3. A total of 1044 radiomics features were extracted from grayscale US images of each prostate nodule. After feature selection through the least absolute shrinkage and selection operator (LASSO) regression model, the radiomics score was developed from the training cohort. The prediction nomograms were developed using multivariate logistic regression analysis based on the radiomics score and clinical risk factors. The performance of the nomograms was assessed and compared in terms of discrimination, calibration, and clinical usefulness.
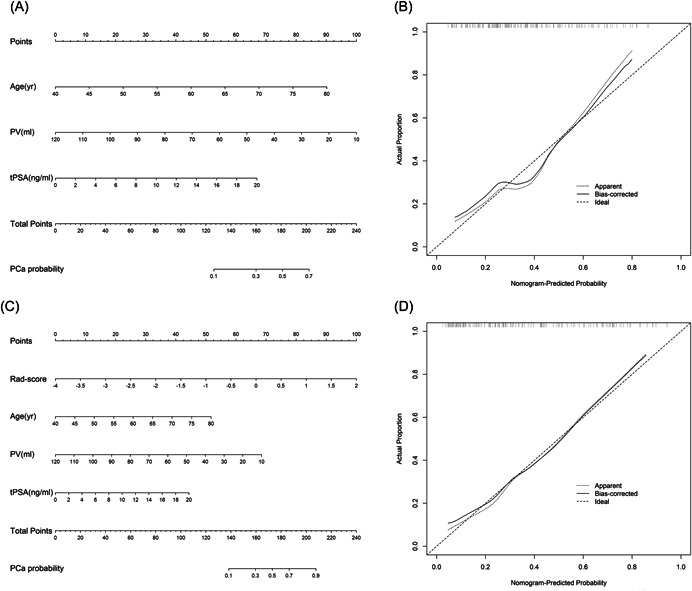
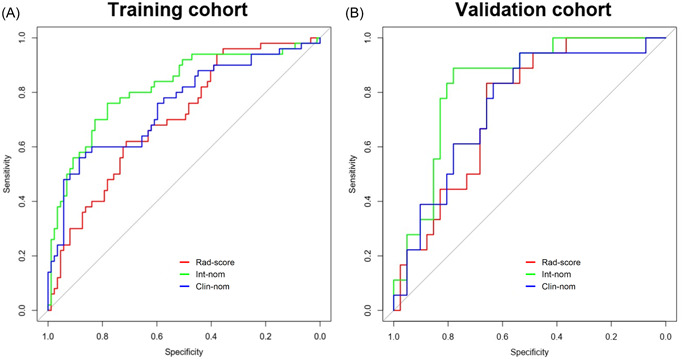
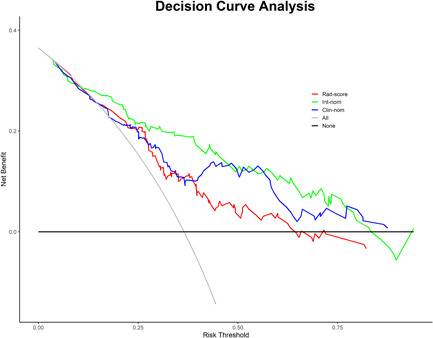
Results: The radiomics score consisted of five selected features. Multivariate logistic regression analysis demonstrated that the radiomics score, age, total prostate-specific antigen (tPSA), and prostate volume were independent factors for prediction of PCa (all p < 0.05). The integrated nomogram incorporating the radiomics score and three clinical risk factors reached an area under the curve (AUC) of 0.835 (95% confidence interval [CI], 0.729-0.941), thereby outperforming the clinical nomogram which based on only clinical factors and yielded an AUC of 0.752 (95% CI, 0.618-0.886) (p = 0.04). Both nomograms showed good calibration. Decision curve analysis indicated that using the integrated nomogram would add more benefit than using the clinical nomogram.
Conclusion: The radiomics score was an independent factor for pre-biopsy prediction of PCa. Addition of the radiomics score to the clinical nomogram shows incremental prognostic value and may help clinicians make precise decisions to reduce unnecessary PBs.
Keywords: nomogram; prostate cancer; radiomics; ultrasound.
© 2022 The Authors. The Prostate published by Wiley Periodicals LLC.
Conflict of interest statement
The authors declare no conflict of interest.
Figures
Similar articles
-
A Radiomics nomogram for predicting bone metastasis in newly diagnosed prostate cancer patients.Eur J Radiol. 2020 Jul;128:109020. doi: 10.1016/j.ejrad.2020.109020. Epub 2020 Apr 19. Eur J Radiol. 2020. PMID: 32371181
-
Preoperative diagnosis of malignant pulmonary nodules in lung cancer screening with a radiomics nomogram.Cancer Commun (Lond). 2020 Jan;40(1):16-24. doi: 10.1002/cac2.12002. Epub 2020 Mar 3. Cancer Commun (Lond). 2020. PMID: 32125097 Free PMC article.
-
Ultrasound-based radiomics score: a potential biomarker for the prediction of microvascular invasion in hepatocellular carcinoma.Eur Radiol. 2019 Jun;29(6):2890-2901. doi: 10.1007/s00330-018-5797-0. Epub 2018 Nov 12. Eur Radiol. 2019. PMID: 30421015
-
Dual-modal radiomics nomogram based on contrast-enhanced ultrasound to improve differential diagnostic accuracy and reduce unnecessary biopsy rate in ACR TI-RADS 4-5 thyroid nodules.Cancer Imaging. 2024 Jan 23;24(1):17. doi: 10.1186/s40644-024-00661-3. Cancer Imaging. 2024. PMID: 38263209 Free PMC article.
-
MRI-based nomograms and radiomics in presurgical prediction of extraprostatic extension in prostate cancer: a systematic review.Abdom Radiol (NY). 2023 Jul;48(7):2379-2400. doi: 10.1007/s00261-023-03924-y. Epub 2023 May 4. Abdom Radiol (NY). 2023. PMID: 37142824
Cited by
-
Ultrasonic radiomics in predicting pathologic type for thyroid cancer: a preliminary study using radiomics features for predicting medullary thyroid carcinoma.Front Endocrinol (Lausanne). 2025 Feb 19;16:1428888. doi: 10.3389/fendo.2025.1428888. eCollection 2025. Front Endocrinol (Lausanne). 2025. PMID: 40046879 Free PMC article.
-
Radiotranscriptomics identified new mRNAs and miRNA markers for distinguishing prostate cancer from benign prostatic hyperplasia.Cancer Med. 2023 Dec;12(24):21694-21708. doi: 10.1002/cam4.6728. Epub 2023 Nov 21. Cancer Med. 2023. PMID: 37987209 Free PMC article.
-
Advances in artificial intelligence for the diagnosis and treatment of ovarian cancer (Review).Oncol Rep. 2024 Mar;51(3):46. doi: 10.3892/or.2024.8705. Epub 2024 Jan 19. Oncol Rep. 2024. PMID: 38240090 Free PMC article. Review.
References
-
- Siegel RL, Miller KD, Fuchs HE, Jemal A. Cancer statistics, 2021. CA Cancer J Clin. 2021;71(1):7‐33. - PubMed
-
- Mottet N, Bellmunt J, Bolla M, et al. EAU‐ESTRO‐SIOG guidelines on prostate cancer. part 1: screening, diagnosis, and local treatment with curative intent. Eur Urol. 2017;71(4):618‐629. - PubMed
-
- Scattoni V, Zlotta A, Montironi R, Schulman C, Rigatti P, Montorsi F. Extended and saturation prostatic biopsy in the diagnosis and characterisation of prostate cancer: a critical analysis of the literature. Eur Urol. 2007;52(5):1309‐1322. - PubMed
-
- Presti JC Jr, O'Dowd GJ, Miller MC, Mattu R, Veltri RW. Extended peripheral zone biopsy schemes increase cancer detection rates and minimize variance in prostate specific antigen and age related cancer rates: results of a community multi‐practice study. J Urol. 2003;169(1):125‐129. - PubMed
-
- Kawakami S, Kihara K, Fujii Y, Masuda H, Kobayashi T, Kageyama Y. Transrectal ultrasound‐guided transperineal 14‐core systematic biopsy detects apico‐anterior cancer foci of T1c prostate cancer. Int J Urol. 2004;11(8):613‐618. - PubMed
Publication types
MeSH terms
Grants and funding
LinkOut - more resources
Full Text Sources
Medical
