. 2022 Dec 23;61(52):e202212946.
doi: 10.1002/anie.202212946. Epub 2022 Nov 28.

Thiamyxins: Structure and Biosynthesis of Myxobacterial RNA-Virus Inhibitors

Affiliations

Thiamyxins: Structure and Biosynthesis of Myxobacterial RNA-Virus Inhibitors

Patrick A Haack et al. Angew Chem Int Ed Engl. .

Abstract

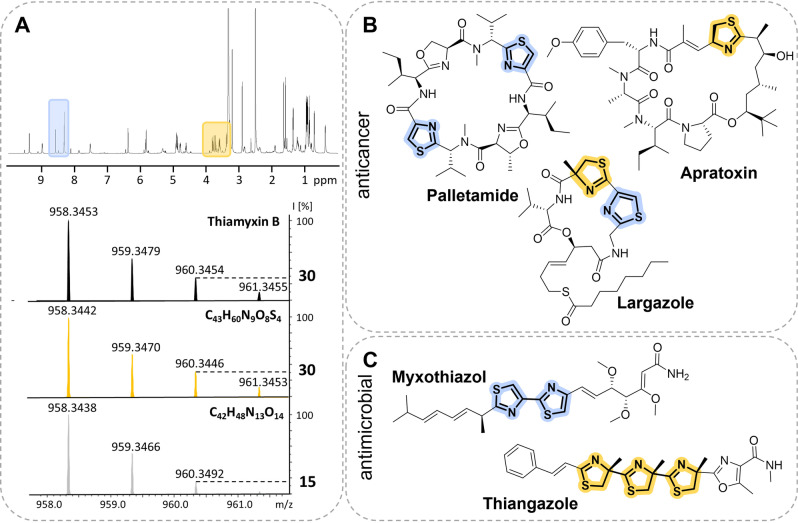
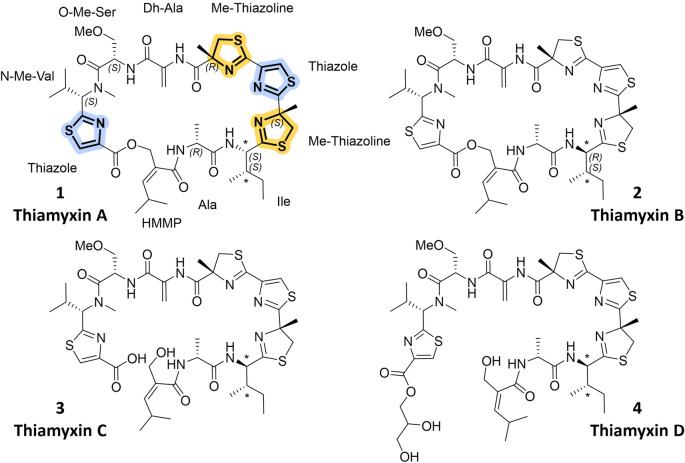
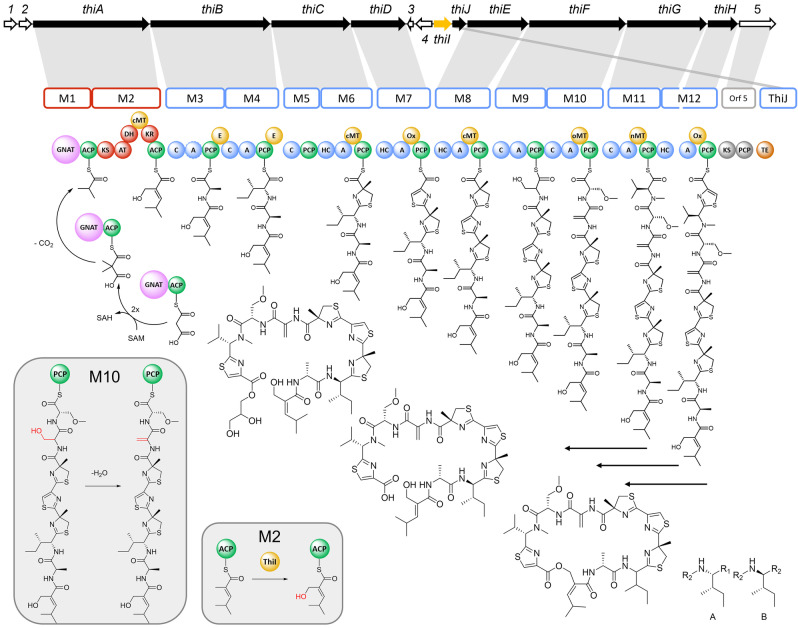
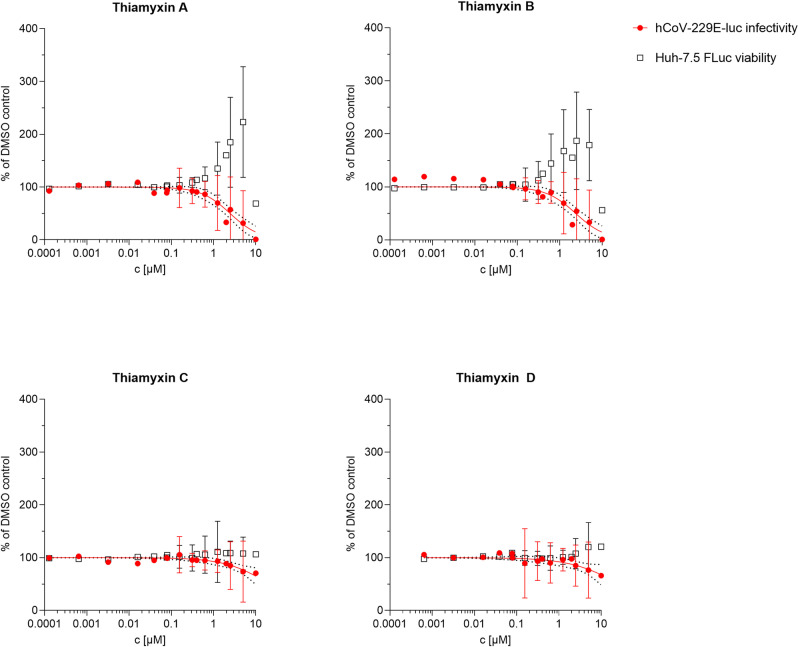
During our search for novel myxobacterial natural products, we discovered the thiamyxins: thiazole- and thiazoline-rich non-ribosomal peptide-polyketide hybrids with potent antiviral activity. We isolated four congeners of this unprecedented natural product family with the non-cyclized thiamyxin D fused to a glycerol unit at the C-terminus. Alongside their structure elucidation, we present a concise biosynthesis model based on biosynthetic gene cluster analysis and isotopically labelled precursor feeding. We report incorporation of a 2-(hydroxymethyl)-4-methylpent-3-enoic acid moiety by a GCN5-related N-acetyltransferase-like decarboxylase domain featuring polyketide synthase. The thiamyxins show potent inhibition of RNA viruses in cell culture models of corona, zika and dengue virus infection. Their potency up to a half maximal inhibitory concentration of 560 nM combined with milder cytotoxic effects on human cell lines indicate the potential for further development of the thiamyxins.

Keywords: Antiviral Agents; Biosynthesis; Depsipeptides; Natural Products; Structure Elucidation.


Conflict of interest statement

The authors declare no conflict of interest.

Figures

Figure 1
Figure 1
A) Characteristic chemical shifts (top, 1H NMR spectrum) and isotope pattern (bottom, mass spectrum) indicating the presence of thiazole and thiazoline in the thiamyxins. Mass spectra (top to bottom): measured spectrum of thiamyxin B (black), calculated spectrum for C43H60N9O8S4 (yellow) and C42H48N13O14 (grey) as an example for a possible sum formulae highlighting the intensity shift of the second isotope peak caused by 34S. B) Natural products from cyanobacteria and C) myxobacteria comprising thiazoline (yellow) and thiazole (blue) units with their most prominent biological activity.
Figure 2
Figure 2
Chemical structures of the four congeners of the thiamyxin family (A–D). N‐Me‐Val: N‐Methyl‐Valine, O‐Me‐Ser: O‐Methyl‐Serine, Dh‐Ala: Dehydroalanine, Me‐Thiazoline: Methylthiazoline, Ala: Alanine, HMMP: 2‐(hydroxymethyl)‐4‐methylpent‐3‐enoic acid. *Proposed stereochemistry based on observed chemical shifts and coupling constants, prevalence of l‐Ile and dallo‐Ile, as well as the presence of an epimerization domain in module 4 and 5.
Figure 3
Figure 3
Proposed biosynthetic pathway for the thiamyxins (Map not drawn to scale). Core PKS modules are marked in red and core NRPS modules in blue, epimerization, methylation and oxidation domains are marked yellow and ACP and PCP domains in green. The thioesterase is shown in orange and the GNAT domain in pink. Modules proposed to be non‐functional are marked in grey. The genes involved in the thiamyxin biosynthesis are marked in black and named thiA‐J. The remaining genes with unknown or unassigned function are shown blank and named ORF1‐5. The hydroxylation by ThiI is shown in in the right box and the water elimination of Serine to form Dehydroalanine (module 10) in the left box. Gene cluster color code: NRPS genes (blue), PKS genes (red). SAM=S‐adenosyl methionine; SAH=S‐adenosyl homocysteine.
Figure 4
Figure 4
Antiviral activity of thiamyxin A–D against HCoV‐229E‐luc (red) when simultaneously determining their effect on Huh‐7.5 Fluc cells (black). Renilla luciferase serves as reporter for viral load, firefly luciferase for cell viability. Measurements performed in technical duplicates of four independent biological experiments. Non‐linear regression curves (red) are given with 95 % confidence interval (black dots). Increase in cell viability over 100 % caused by reduction in viral load.

References

    1. None
    1. “WHO Coronavirus Disease (COVID-19) Dashboard|WHO Coronavirus Disease (COVID-19) Dashboard”, to be found under https://covid19.who.int/, 2020;
    1. Gorbalenya A. E., Baker S. C., Baric R. S., de Groot R. J., Drosten C., Gulyaeva A. A., Haagmans B. L., Lauber C., Leontovich A. M., Neuman B. W., Penzar D., Perlman St., Poon L. L. M., Samborskiy D. V., Sidorov I. A., Sola I., Ziebuhr J., Nat. Microbiol. 2020, 5, 536–544. - PMC - PubMed
    1. None
    1. Ireland C. M., Durso A. R., Newman R. A., Hacker M. P., J. Org. Chem. 1982, 47, 1807–1811;

Publication types