. 2023 Feb 18;76(4):620-630.
doi: 10.1093/cid/ciac814.

Strategies for Using Antigen Rapid Diagnostic Tests to Reduce Transmission of Severe Acute Respiratory Syndrome Coronavirus 2 in Low- and Middle-Income Countries: A Mathematical Modelling Study Applied to Zambia

Affiliations

Strategies for Using Antigen Rapid Diagnostic Tests to Reduce Transmission of Severe Acute Respiratory Syndrome Coronavirus 2 in Low- and Middle-Income Countries: A Mathematical Modelling Study Applied to Zambia

Alvin X Han et al. Clin Infect Dis. .

Abstract

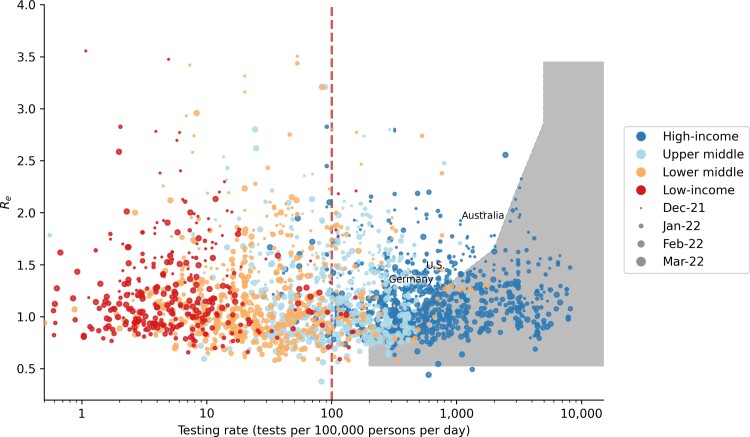
Background: Increasing the availability of antigen rapid diagnostic tests (Ag-RDTs) in low- and middle-income countries (LMICs) is key to alleviating global SARS-CoV-2 testing inequity (median testing rate in December 2021-March 2022 when the Omicron variant was spreading in multiple countries: high-income countries = 600 tests/100 000 people/day; LMICs = 14 tests/100 000 people/day). However, target testing levels and effectiveness of asymptomatic community screening to impact SARS-CoV-2 transmission in LMICs are unclear.

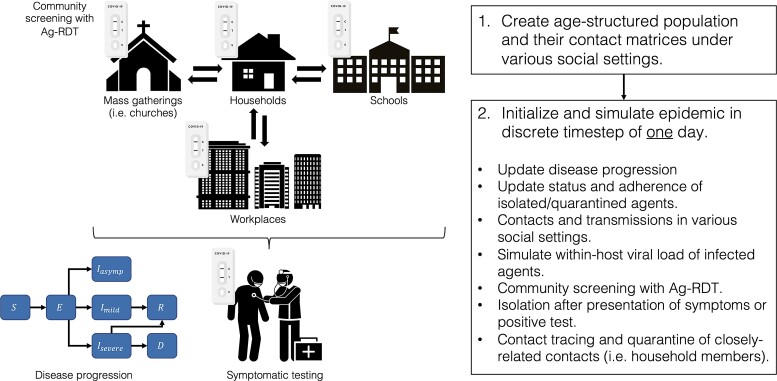
Methods: We used Propelling Action for Testing and Treating (PATAT), an LMIC-focused agent-based model to simulate coronavirus disease 2019 (COVID-19) epidemics, varying the amount of Ag-RDTs available for symptomatic testing at healthcare facilities and asymptomatic community testing in different social settings. We assumed that testing was a function of access to healthcare facilities and availability of Ag-RDTs. We explicitly modelled symptomatic testing demand from individuals without SARS-CoV-2 and measured impact based on the number of infections averted due to test-and-isolate.

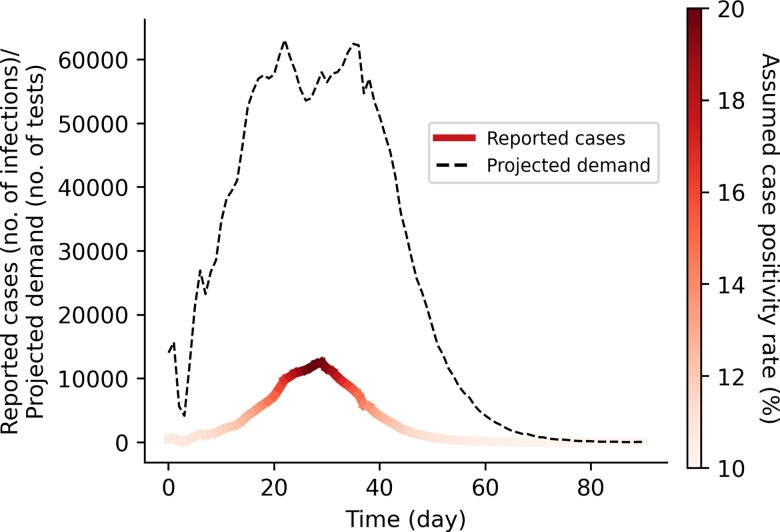
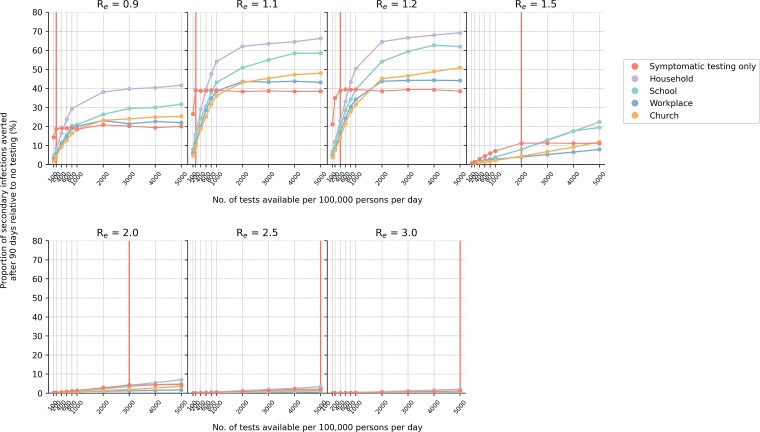
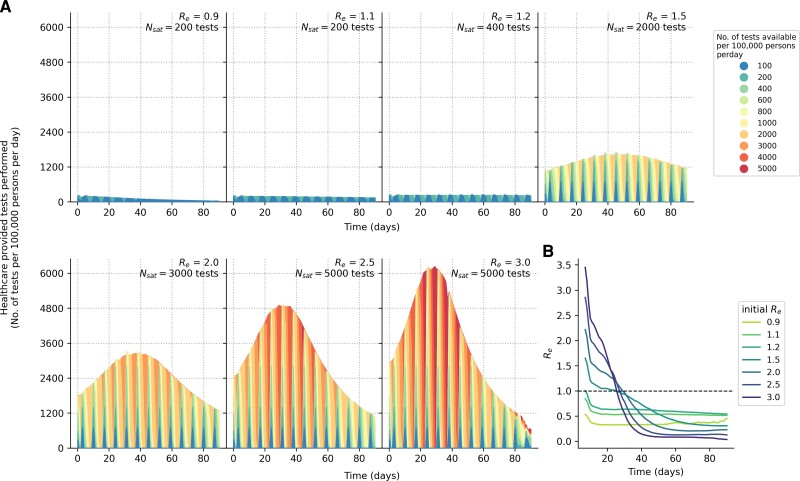
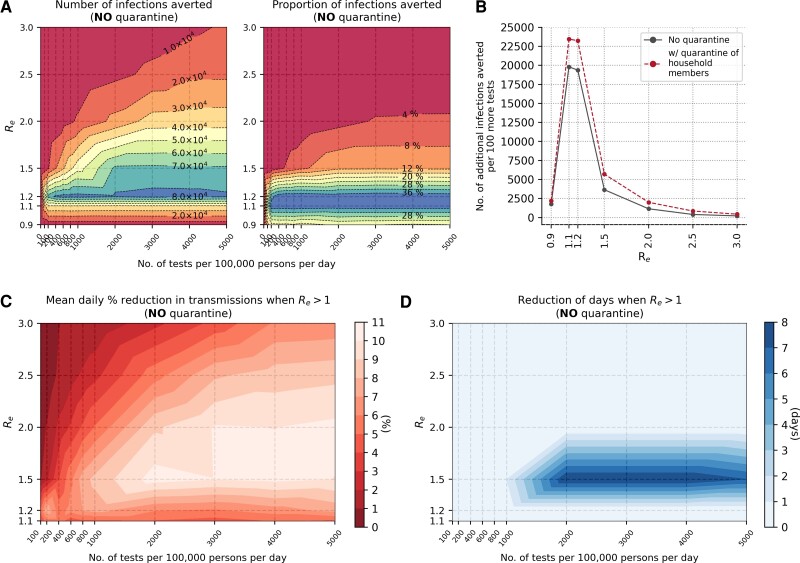
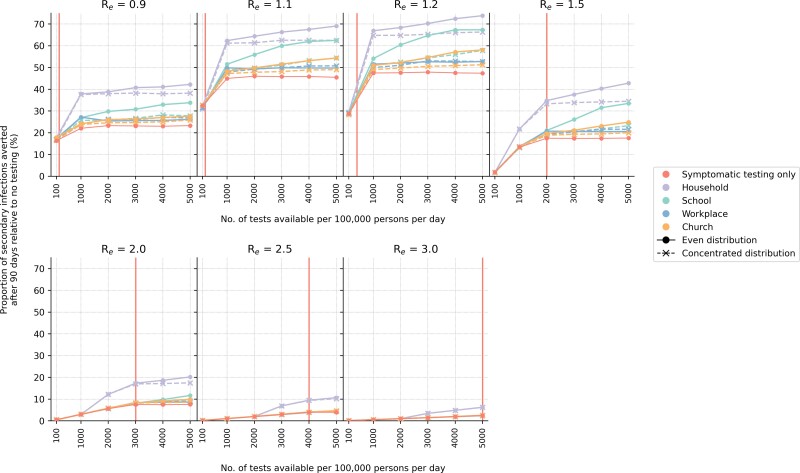
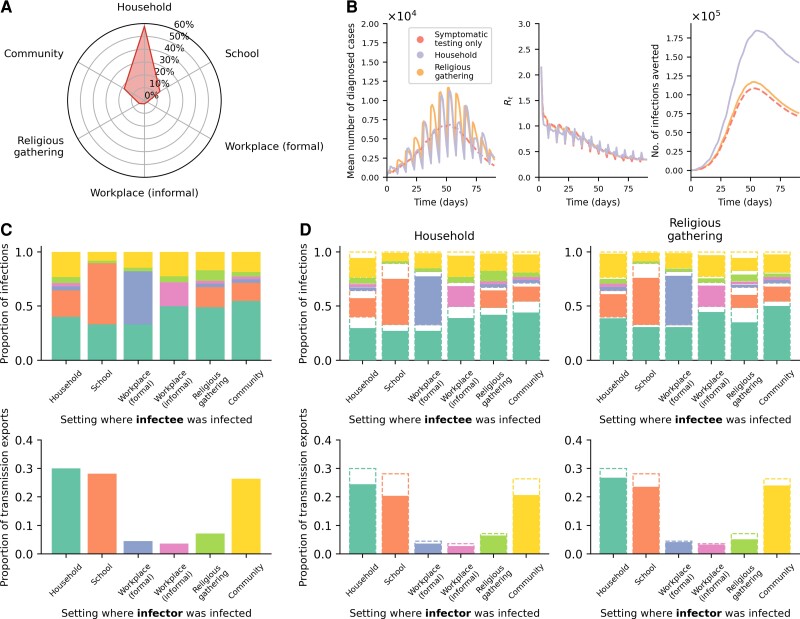
Results: Testing symptomatic individuals yields greater benefits than any asymptomatic community testing strategy until most symptomatic individuals who sought testing have been tested. Meeting symptomatic testing demand likely requires at least 200-400 tests/100 000 people/day, on average, as symptomatic testing demand is highly influenced by individuals without SARS-CoV-2. After symptomatic testing demand is satisfied, excess tests to proactively screen for asymptomatic infections among household members yield the largest additional infections averted.

Conclusions: Testing strategies aimed at reducing transmission should prioritize symptomatic testing and incentivizing test-positive individuals to adhere to isolation to maximize effectiveness.

Keywords: COVID-19; SARS-CoV-2; diagnostic testing; low- and middle-income countries.


Conflict of interest statement

Potential conflicts of interest. J. A. S., A. T., N. H., and E. H. are employed by Foundation for Innovative New Diagnostics (FIND), the global alliance for diagnostics. A. X. H. reports consulting fees from Boston University (paid to author). The other authors report no potential conflicts. All authors have submitted the ICMJE Form for Disclosure of Potential Conflicts of Interest. Conflicts that the editors consider relevant to the content of the manuscript have been disclosed.

Figures

Figure 1.
Figure 1.
Schematic of Propelling Action for Testing And Treating (PATAT) simulation model. Abbreviation: Ag-RDT, antigen rapid diagnostic test.
Figure 2.
Figure 2.
Projected symptomatic testing demand based on assumed case positivity rate. This projected demand includes both persons with SARS-CoV-2 who were tested and reported as well as those who seek symptomatic testing for other reasons (eg, individuals presenting COVID-19–like symptoms but who were not infected with SARS-CoV-2). Abbreviations: COVID-19, coronavirus disease 2019; SARS-CoV-2, severe acute respiratory syndrome coronavirus 2.
Figure 3.
Figure 3.
Impact of either using all available Ag-RDTs for symptomatic testing or a majority of them (85%) for community testing in various settings (even distribution only; without quarantine of household members). The proportion of secondary infections averted after 90 days relative to the no-testing baseline for a different number of tests available per 100 000 persons per day and assumed Re value is plotted for each test distribution strategy. The vertical red line denotes the number of tests required to saturate symptomatic testing demand (Figure 4). Abbreviation: Ag-RDT, antigen rapid diagnostic test.
Figure 4.
Figure 4.
Symptomatic testing demand during an epidemic (without quarantine of household members). A, Number of symptomatic tests performed per 100 000 persons per day over time for different Re values. Each differently colored shaded curve denotes a different number of tests available per 100 000 persons per day. We assumed that all healthcare facilities in the community will have new stocks of 1 week's worth of Ag-RDTs every Monday. The symptomatic testing demand includes both symptomatic individuals with SARS-CoV-2 who seek testing at healthcare facilities and those who seek symptomatic testing for other reasons based on assumed case positivity rates (see Methods section). The area between the curve plotting the testing rate needed to saturate symptomatic testing demand (Nsat) and the curve for testing rate <Nsat is the amount of symptomatic testing shortage accumulated over time between those 2 testing rates. B, Seven-day moving average of time-varying effective reproduction number (Re) over a simulated epidemic period (90 days) assuming that testing demand is fully satisfied. Abbreviations: Ag-RDT, antigen rapid diagnostic test; SARS-CoV-2, severe acute respiratory syndrome coronavirus 2.
Figure 5.
Figure 5.
Marginal impact of symptomatic testing prior to saturating demand (without quarantine of household members). A, Contour plots depicting infections averted relative to the no-testing baseline for simulations with different Re values and varying number of Ag-RDT availability. Left panel: Number of infections averted relative to the no-testing baseline after 90 days. Right panel: Proportion of secondary infections averted relative to the no-testing baseline after 90 days. B, Number of additional infections averted for every 100 more Ag-RDTs available prior to saturating symptomatic testing demand for different Re values. The dashed line shows a marginal benefit with quarantine of household members while the solid black line depicts that without quarantine. C, Mean daily percentage reduction in transmissions while time-varying Re of simulated epidemic is still >1 for different initial Re values and varying number of Ag-RDTs available for symptomatic testing only. D, Reduction in number of days when time-varying Re of simulated epidemic is >1 for different initial Re values and varying number of Ag-RDTs available for symptomatic testing only. Abbreviation: Ag-RDT, antigen rapid diagnostic test.
Figure 6.
Figure 6.
Symptomatic-testing-first strategy to community testing (without quarantine of household members). When community testing is performed under this strategy, the leftover tests from the previous week's stock allocated for symptomatic testing are used for community testing in various setting in the current week. Two different types of community test distribution approaches (even or concentrated; see Methods section) were simulated. The proportion of secondary infections averted after 90 days relative to the no-testing baseline for a different number of tests available per 100 000 persons per day and assumed Re value is plotted for each test distribution strategy. The vertical red line denotes the number of tests required to saturate symptomatic testing demand.
Figure 7.
Figure 7.
Routine community testing in households outperforms other settings. A, Average breakdown of infections based on the social setting where transmissions occurred for the simulations presented in this work. B, Results from simulations using different testing strategies where Re = 1.5, no quarantine of household members of positively tested individuals assumed, and Ag-RDT availability of 5000 tests per 100 000 persons per day. Community testing (even distribution) was performed with a symptomatic-testing-first approach. The mean total number of diagnosed cases (left), time-varying reproduction number (Re; middle), and number of infections averted (right) over the epidemic period are plotted. C, D, Transmissions across distinct social settings. The top row of stacked plots shows the proportion of infections stratified by the source settings where infectors were infected for each sink setting where their infectees were infected. The stacked bars are colored by the source settings as per the bottom row of bar plots. The bottom row of bar plots shows the contribution of transmission exports into other settings (ie, transmission events where the infectees were infected in a setting that is different from their infectors) from different source settings where the infectors were infected. C, The no-testing baseline results from the example case as in panel B. D, Results from either implementing a symptomatic-testing-first community testing in households (left panels) or religious gathering (right panels). The dashed bar outlines are the no-testing baseline results as in panel C. Abbreviation: Ag-RDT, antigen rapid diagnostic test.
Figure 8.
Figure 8.
Global reported COVID-19 testing rate between December 2021 and March 2022 when the Omicron BA.1 variant of concern spread rapidly across multiple countries. Each data point denotes the average weekly reported COVID-19 testing rate of a country against the average time-varying reproduction number (Re) computed in the same week and is colored by the income level of the country while sized by time (ie, month/year). The shaded area denotes the level of test availability we had estimated to saturate symptomatic testing demand given different equivalent initial Re values (Figure 4). The dashed vertical line at 100 tests per 100 000 persons per day is the minimum testing rate target set by the ACT-Accelerator diagnostics pillar. Testing rate data were sourced from the SARS-CoV-2 Test Tracker by FIND (https://www.finddx.org/covid-19/test-tracker/), whereas Re values were computed from reported COVID-19 case counts (https://github.com/epiforecasts/covid-rt-estimates) [28]. Abbreviations: ACT, Access to COVID-19 Tools; COVID-19, coronavirus disease 2019; FIND, Foundation for Innovative New Diagnostics; SARS-CoV-2, severe acute respiratory syndrome coronavirus 2.

References

    1. Dong E, Du H, Gardner L. An interactive web-based dashboard to track COVID-19 in real time. Lancet Infect Dis 2020; 20:533–4. - PMC - PubMed
    1. Ye Y, Zhang Q, Wei X, Cao Z, Yuan H-Y, Zeng DD. Equitable access to COVID-19 vaccines makes a life-saving difference to all countries. Nat Hum Behav 2022; 6:207–21. - PMC - PubMed
    1. Viana R, Moyo S, Amoako DG, et al. Rapid epidemic expansion of the SARS-CoV-2 Omicron variant in Southern Africa. Nature 2022; 603:679–86. - PMC - PubMed
    1. van der Straten K, Guerra D, van Gils MJ, et al. Antigenic cartography using sera from sequence-confirmed SARS-CoV-2 variants of concern infections reveals antigenic divergence of Omicron. Immunity 2022; 55:1725–1731.e4. 10.1016/j.immuni.2022.07.018. - DOI - PMC - PubMed
    1. Batista C, Hotez P, Amor YB, et al. The silent and dangerous inequity around access to COVID-19 testing: a call to action. EClinicalMedicine 2022; 43:101230. - PMC - PubMed

Publication types

Supplementary concepts