. 2022 Oct 18;3(10):100779.
doi: 10.1016/j.xcrm.2022.100779. Epub 2022 Sep 26.

Longitudinal characterization of circulating neutrophils uncovers phenotypes associated with severity in hospitalized COVID-19 patients

Affiliations

Longitudinal characterization of circulating neutrophils uncovers phenotypes associated with severity in hospitalized COVID-19 patients

Thomas J LaSalle et al. Cell Rep Med. .

Abstract

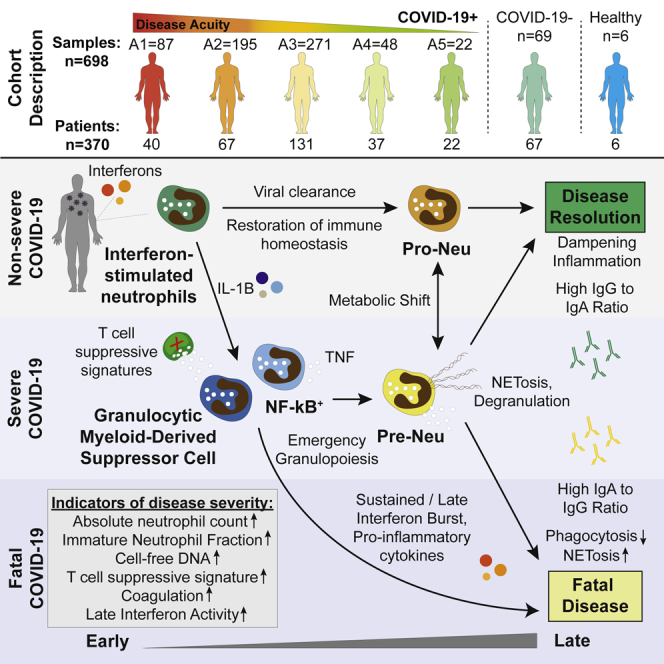
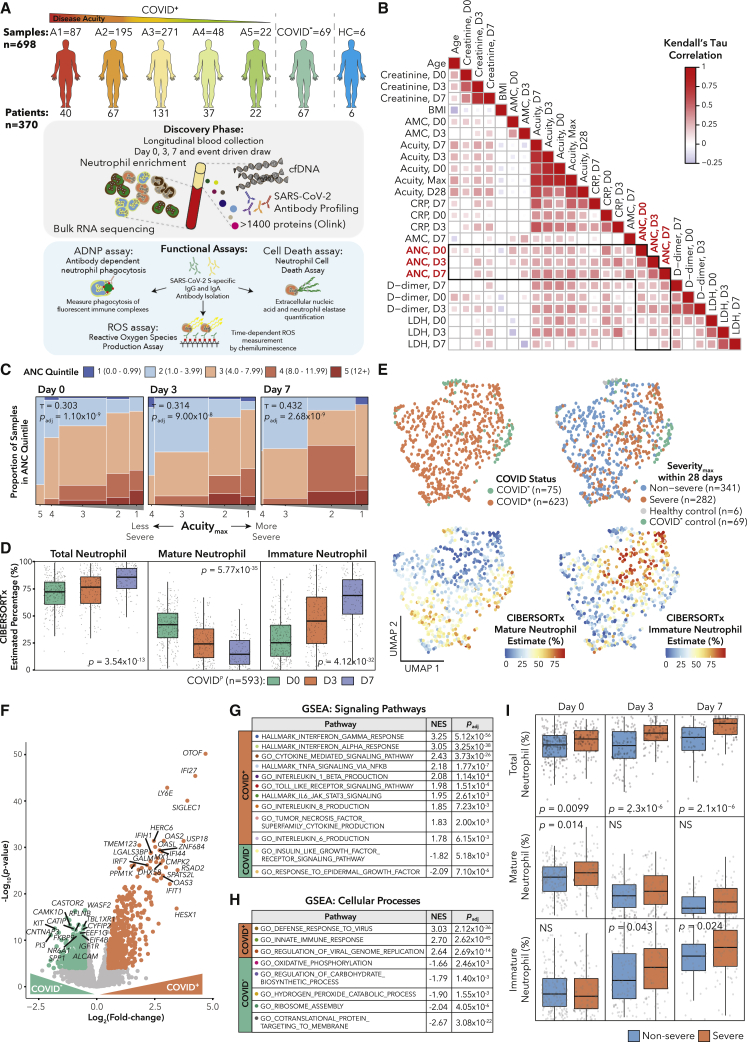
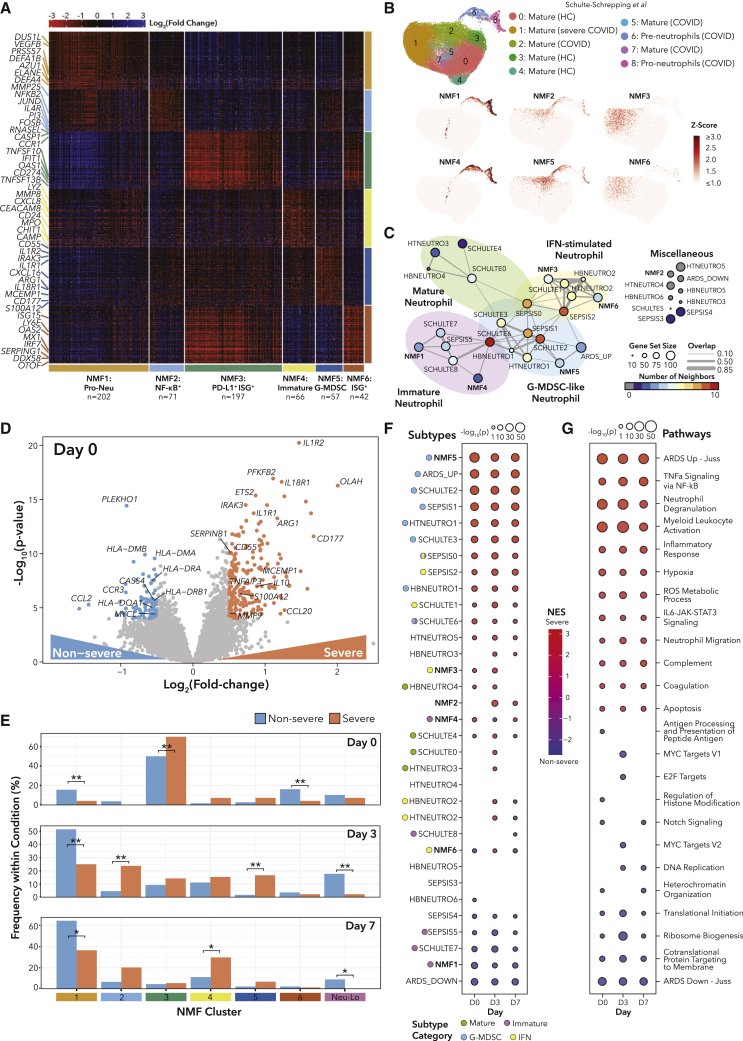
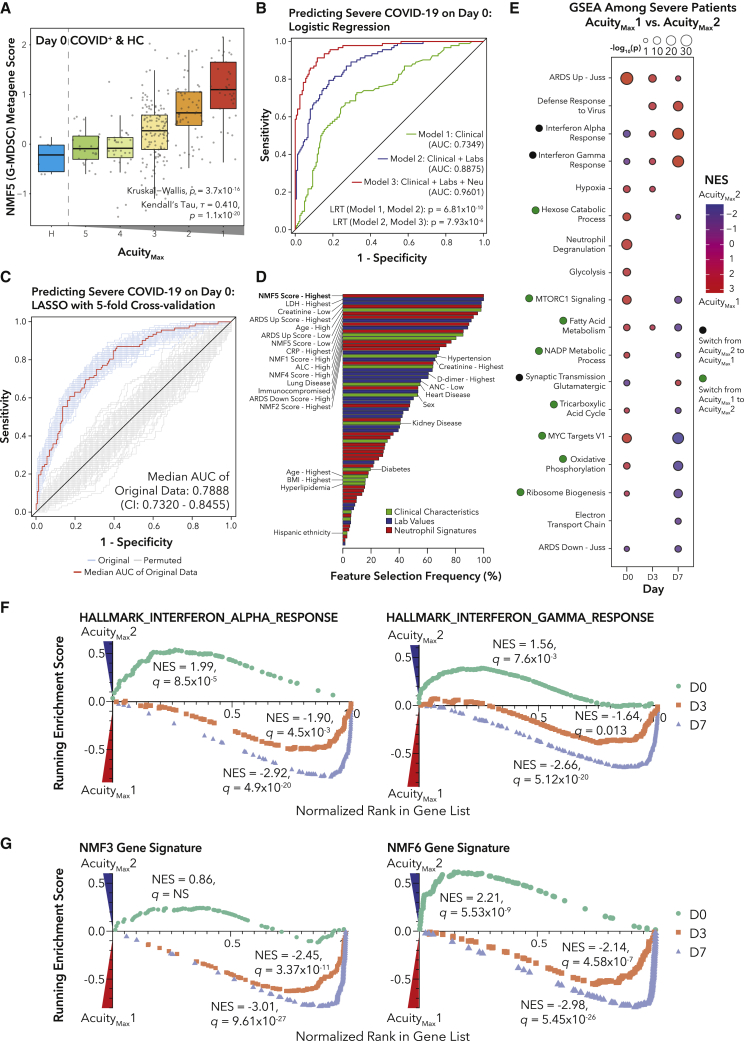
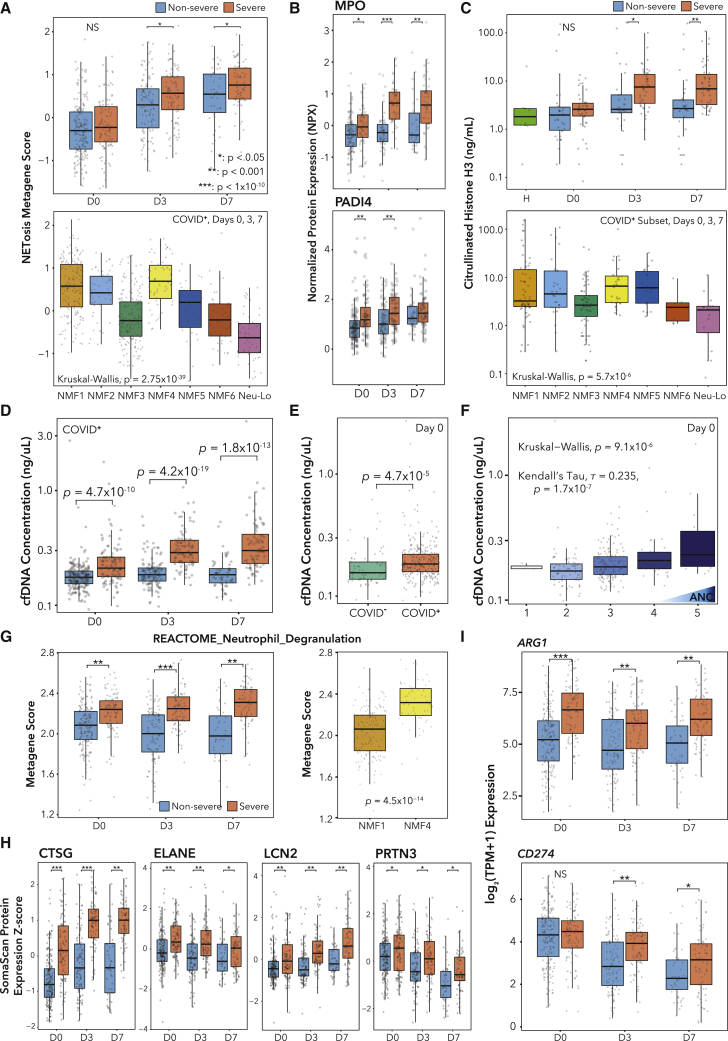
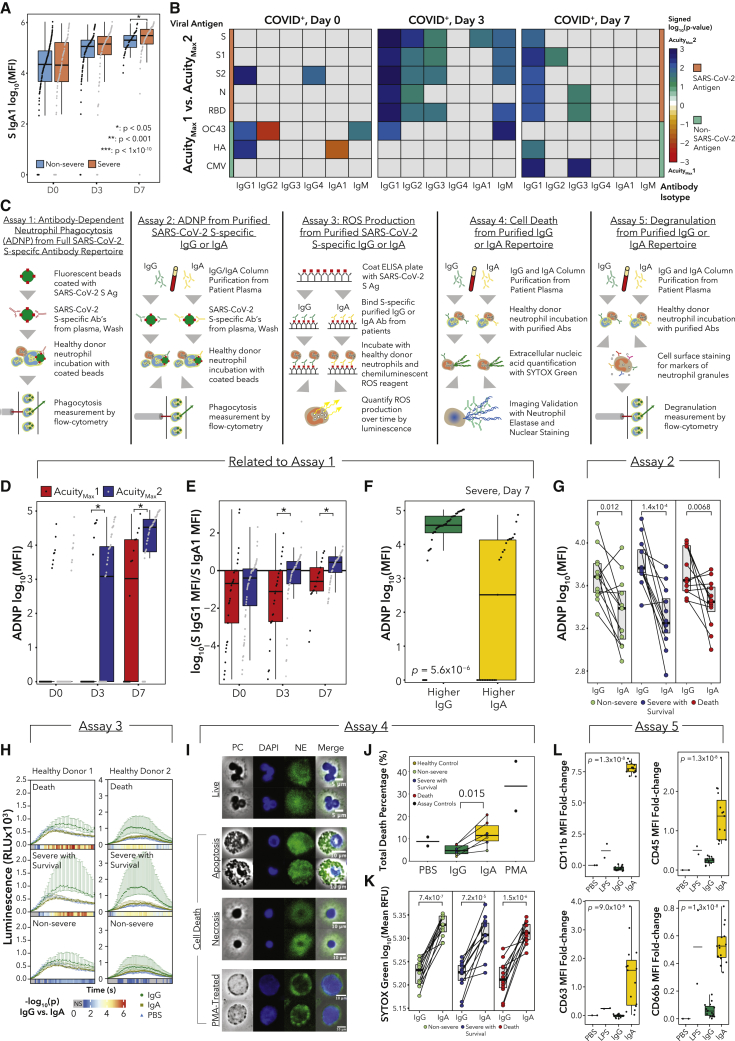
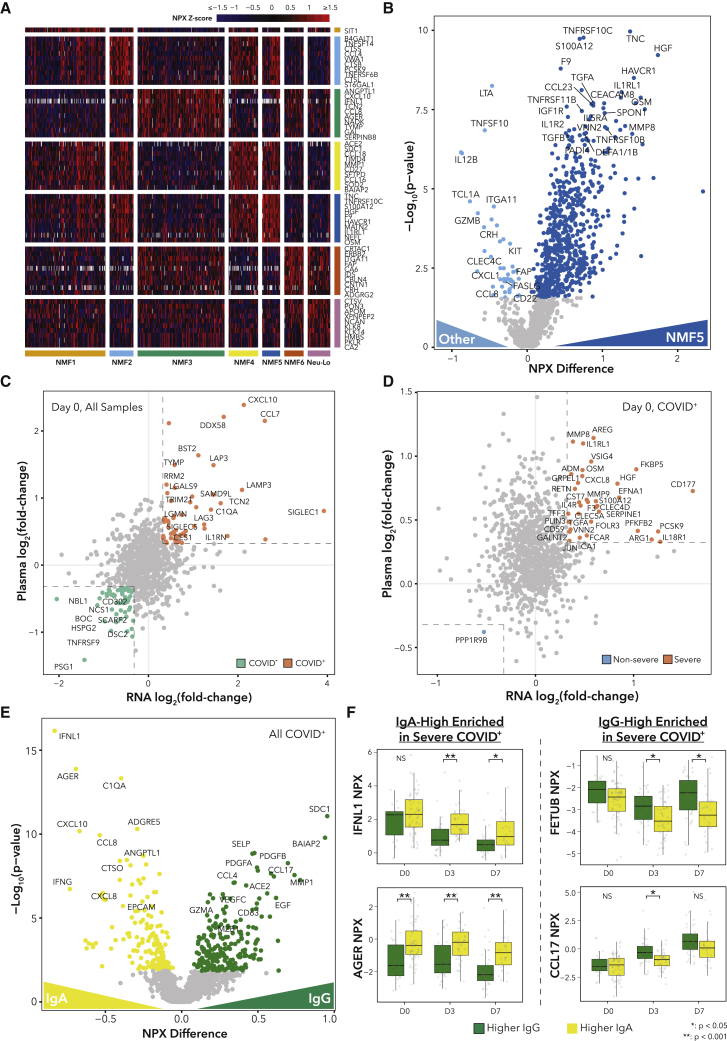
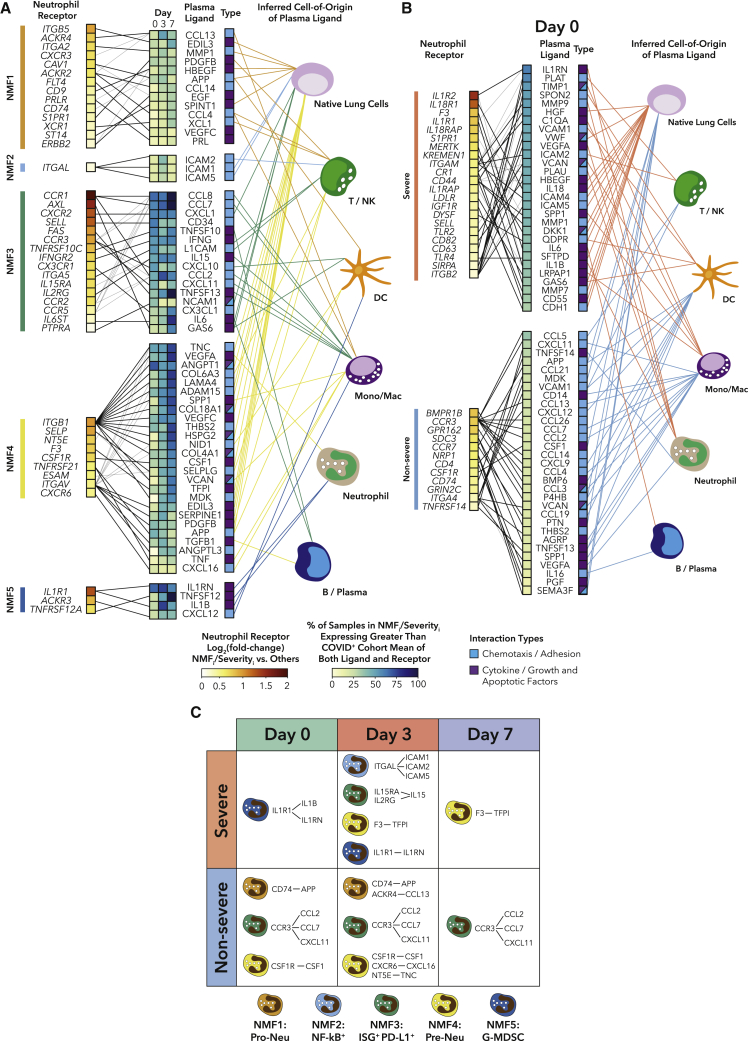
Mechanisms of neutrophil involvement in severe coronavirus disease 2019 (COVID-19) remain incompletely understood. Here, we collect longitudinal blood samples from 306 hospitalized COVID-19+ patients and 86 controls and perform bulk RNA sequencing of enriched neutrophils, plasma proteomics, and high-throughput antibody profiling to investigate relationships between neutrophil states and disease severity. We identify dynamic switches between six distinct neutrophil subtypes. At days 3 and 7 post-hospitalization, patients with severe disease display a granulocytic myeloid-derived suppressor cell-like gene expression signature, while patients with resolving disease show a neutrophil progenitor-like signature. Humoral responses are identified as potential drivers of neutrophil effector functions, with elevated severe acute respiratory syndrome coronavirus 2 (SARS-CoV-2)-specific immunoglobulin G1 (IgG1)-to-IgA1 ratios in plasma of severe patients who survived. In vitro experiments confirm that while patient-derived IgG antibodies induce phagocytosis in healthy donor neutrophils, IgA antibodies predominantly induce neutrophil cell death. Overall, our study demonstrates a dysregulated myelopoietic response in severe COVID-19 and a potential role for IgA-dominant responses contributing to mortality.

Keywords: COVID-19; G-MDSC; IgA; NETosis; SARS-CoV-2; degranulation; neutrophil; transcriptomics.


Conflict of interest statement

Declaration of interests M.S.-F. received funding from Bristol-Myers Squibb. G.A. is a founder of Seromyx Systems Inc. N.H. holds equity in Biontech and holds equity in and advises Danger Bio.

Figures

None
Graphical abstract
Figure 1
Figure 1
SARS-CoV-2 infection induces distinct neutrophil profiles (A) Schematic of cohort and study methodology. (B) Correlation heatmap of clinical variable correlations with absolute neutrophil counts (ANCs) on day 0, 3, or 7 with q < 0.05 in COVID-19+ patients. (C) Ordinal correlation between ANC quintile and acuityMax (AMax) for COVID-19+ patients. (D) Comparison of CIBERSORTx total, mature, and immature neutrophil fractions on days 0, 3, and 7 for COVID-19+ patients by Kruskal-Wallis test (STAR methods). (E) Uniform manifold approximation and projection (UMAP) plots of bulk RNA-seq samples that passed quality control. (F) Volcano plot of genes DE between COVID-19+ and COVID-19 patients hospitalized with respiratory disease on day 0. Colored circles indicate log2(fold change)>0.5 (log2(FC)) and p < 10−4 (G and H) Gene set enrichment analysis (GSEA) for (G) signaling pathways and (H) cellular processes from MSigDB for samples on day 0 from (F). (I) Boxplots of CIBERSORTx total, mature, and immature neutrophil percentages in severe and non-severe patients with Wilcoxon rank-sum p values. See also Figure S1 and Table S1.
Figure 2
Figure 2
Severe outcomes are associated with transitions between neutrophil states (A) Heatmap of marker genes for all patients grouped by subtype using NMF clustering (STAR Methods). (B) UMAPs of scRNA data from Bonn Cohort 2. (C) Network diagram displaying relationships between NMF subtype marker genes and published neutrophil signature genes. (D) Volcano plot of genes DE between COVID-19+ severe and non-severe patients. Colored points indicate log2(FC) > 0.5 and p < 10−4. (E) Bar plots of proportions of COVID-19+ samples in each NMF cluster. Bar heights indicate percentages of COVID-19+ samples for each time point separately. ∗q < 0.05, ∗∗q < 0.01 by Fisher’s exact test for each time point separately, with false discovery rate (FDR) correction across all days. (F and G) GSEA for genes DE between COVID-19+ severe and non-severe patients. See also Figures S2 and S3 and Table S2.
Figure 3
Figure 3
Neutrophil metabolism and dysregulated IFN signaling are associated with severity and acuity (A) Boxplots of NMF5 metagene score for healthy and COVID-19+ samples grouped by AMax. (B) Receiver operating characteristic (ROC) curve for performance of logistic regressions predicting COVID-19 severity on day 0. Significance of model improvement determined by likelihood ratio tests. (C) ROC curve of performance of a LASSO model of COVID-19 severity on day 0 (STAR Methods) with median AUC curve across cross-validation repeats in red. (D) Bar plot of inclusion frequency for each variable in the LASSO model. (E) GSEA for genes DE between COVID-19+ patients with AMax1 (death) or AMax2 (intubation, survival). (F) GSEA enrichment plots for gene sets with genes ranked by DE in (E). (G) GSEA enrichment plots for NMF3 and NMF6 gene signatures with genes ranked by DE in (E). See also Figure S3 and Table S3.
Figure 4
Figure 4
Transcriptomics, proteomics, and cell-free DNA (cfDNA) analyses identify neutrophil effector function signatures associated with severe COVID-19 outcomes (A) Boxplots of NETosis metagene score over time split by severityMax (top) and across NMF clusters (bottom). (B) Olink plasma proteomics values over time split by severityMax. (C) Citrullinated histone H3 in patient plasma. H = healthy (n = 6), n = 32 non-severe, and n = 46 severe patients. (D–F) cfDNA concentration, arranged by (D) day and severityMax, (E) COVID-19 status, and (F) ANC. (G) Pathway metagene score for REACTOME_NEUTROPHIL_DEGRANULATION. (H) SomaScan protein expression Z scores. (I) Expression of ARG1 and CD274. p values for Wilcoxon rank-sum tests (A [top], B–E, and G–I). See also Figure S3 and Table S3.
Figure 5
Figure 5
Antibody profiles are major drivers of neutrophil function (A) Plasma SARS-CoV-2 spike (S) protein-specific IgA1 log10(MFI) values. (B) Heatmaps displaying the signed (by FC) −log10(p) comparing levels of antigen-specific antibody isotypes between AMax1 and AMax2. Rows indicate antigens: SARS-CoV-2 (S, S1, S2, N, and receptor-binding domain [RBD]), human coronavirus OC43, influenza hemagglutinin (HA), and cytomegalovirus (CMV). (C) Schematics for functional assays. (D) Background-corrected antibody-dependent neutrophil phagocytosis (ADNP) assay. (E) Log10 ratio of S-specific IgG1 to IgA1 MFI. (F) Boxplots of background-corrected ADNP log10(MFI) values for severe patients on day 7, separated by IgG/IgA ratios. (G) Paired-line plots of ADNP log10(MFI) values showing effects of SARS-CoV-2 S-specific IgG or IgA from day 7 plasma samples (n = 12 per condition). (H) Reactive oxygen species luminescence of neutrophils exposed to IgG:S or IgA:S ICs or PBS. Color bars display the −log10(p) between IgG and IgA at each time point, with gray indicating no significant difference (n = 12 per condition). (I) Representative microscopy images of neutrophil morphologies. PC, phase contrast; DAPI, DNA stain; NE, neutrophil elastase. Scale bars are indicated for each row of images. (J) Mean percentage of cells undergoing any form of cell death quantified by fluorescence microscopy (controls n = 2 each, IgG/IgA n = 6 each). (K) SYTOX Green Nucleic Acid Stain log10(RFU) from neutrophils exposed to free IgG or IgA (n = 12 per condition). (L) MFI FC values of surface markers of neutrophil degranulation (controls n = 2 each, IgG/IgA n = 15 each). p values for Wilcoxon rank-sum tests (A and L). See also Figure S4 and Table S4.
Figure 6
Figure 6
Alterations in the plasma proteome are associated with neutrophil subtypes and antibody profiles (A) Heatmap displaying scaled expression values for subtype-enriched proteins. (B) DE proteins. Colored points indicate q < 0.05. (C and D) Scatterplot comparing the log2(FC) values for neutrophil RNA-seq with the log2(FC) of the plasma proteomic data between (C) COVID-19+/− patients or (D) COVID-19+ severe and non-severe patients. Colored points indicate log2(FC) > 1.25 in mRNA and protein. (E) DE proteins in matched plasma samples between samples with IgA > IgG or IgA < IgG. Colored points indicate q < 0.05. (F) NPX (normalized protein expression) values for selected plasma proteins. p values for Wilcoxon rank-sum tests. See also Table S5.
Figure 7
Figure 7
Ligand-receptor interactions in plasma are potential drivers of neutrophil phenotype and severity (A) Ligand-receptor (L-R) analysis for DE ligands in plasma and receptors on neutrophils between NMF clusters for all COVID-19+ samples (STAR Methods). (B) L-R analysis for DE ligands in plasma and receptors on neutrophils between COVID-19+ severe and non-severe samples on day 0. (C) Table highlighting overlap between neutrophil NMF subtype L-R interactions and severity interactions. See also Figures S5–S7 and Table S5.

Update of

References

    1. Blanco-Melo D., Nilsson-Payant B.E., Liu W.C., Uhl S., Hoagland D., Møller R., Jordan T.X., Oishi K., Panis M., Sachs D., et al. Imbalanced host response to SARS-CoV-2 drives development of COVID-19. Cell. 2020;181:1036–1045.e9. - PMC - PubMed
    1. Tiwari-Heckler S., Rauber C., Longhi M.S., Zörnig I., Schnitzler P., Jäger D., Giese T., Merle U. Dysregulated host response in severe acute respiratory syndrome coronavirus 2-induced critical illness. Open Forum Infect. Dis. 2021;8:ofab019. - PMC - PubMed
    1. Lucas C., Wong P., Klein J., Castro T.B.R., Silva J., Sundaram M., Ellingson M.K., Mao T., Oh J.E., Israelow B., et al. Longitudinal analyses reveal immunological misfiring in severe COVID-19. Nature. 2020;584:463–469. - PMC - PubMed
    1. Zhang Q., Meng Y., Wang K., Zhang X., Chen W., Sheng J., Qiu Y., Diao H., Li L. Inflammation and antiviral immune response associated with severe progression of COVID-19. Front. Immunol. 2021;12:631226. - PMC - PubMed
    1. Bost P., De Sanctis F., Canè S., Ugel S., Donadello K., Castellucci M., Eyal D., Fiore A., Anselmi C., Barouni R.M., et al. Deciphering the state of immune silence in fatal COVID-19 patients. Nat. Commun. 2021;12:1428. - PMC - PubMed

Publication types