. 2022 Oct;6(10):e793-e803.
doi: 10.1016/S2542-5196(22)00202-9.

Effects of precipitation, heat, and drought on incidence and expansion of coccidioidomycosis in western USA: a longitudinal surveillance study

Affiliations

Effects of precipitation, heat, and drought on incidence and expansion of coccidioidomycosis in western USA: a longitudinal surveillance study

Jennifer R Head et al. Lancet Planet Health. 2022 Oct.

Abstract

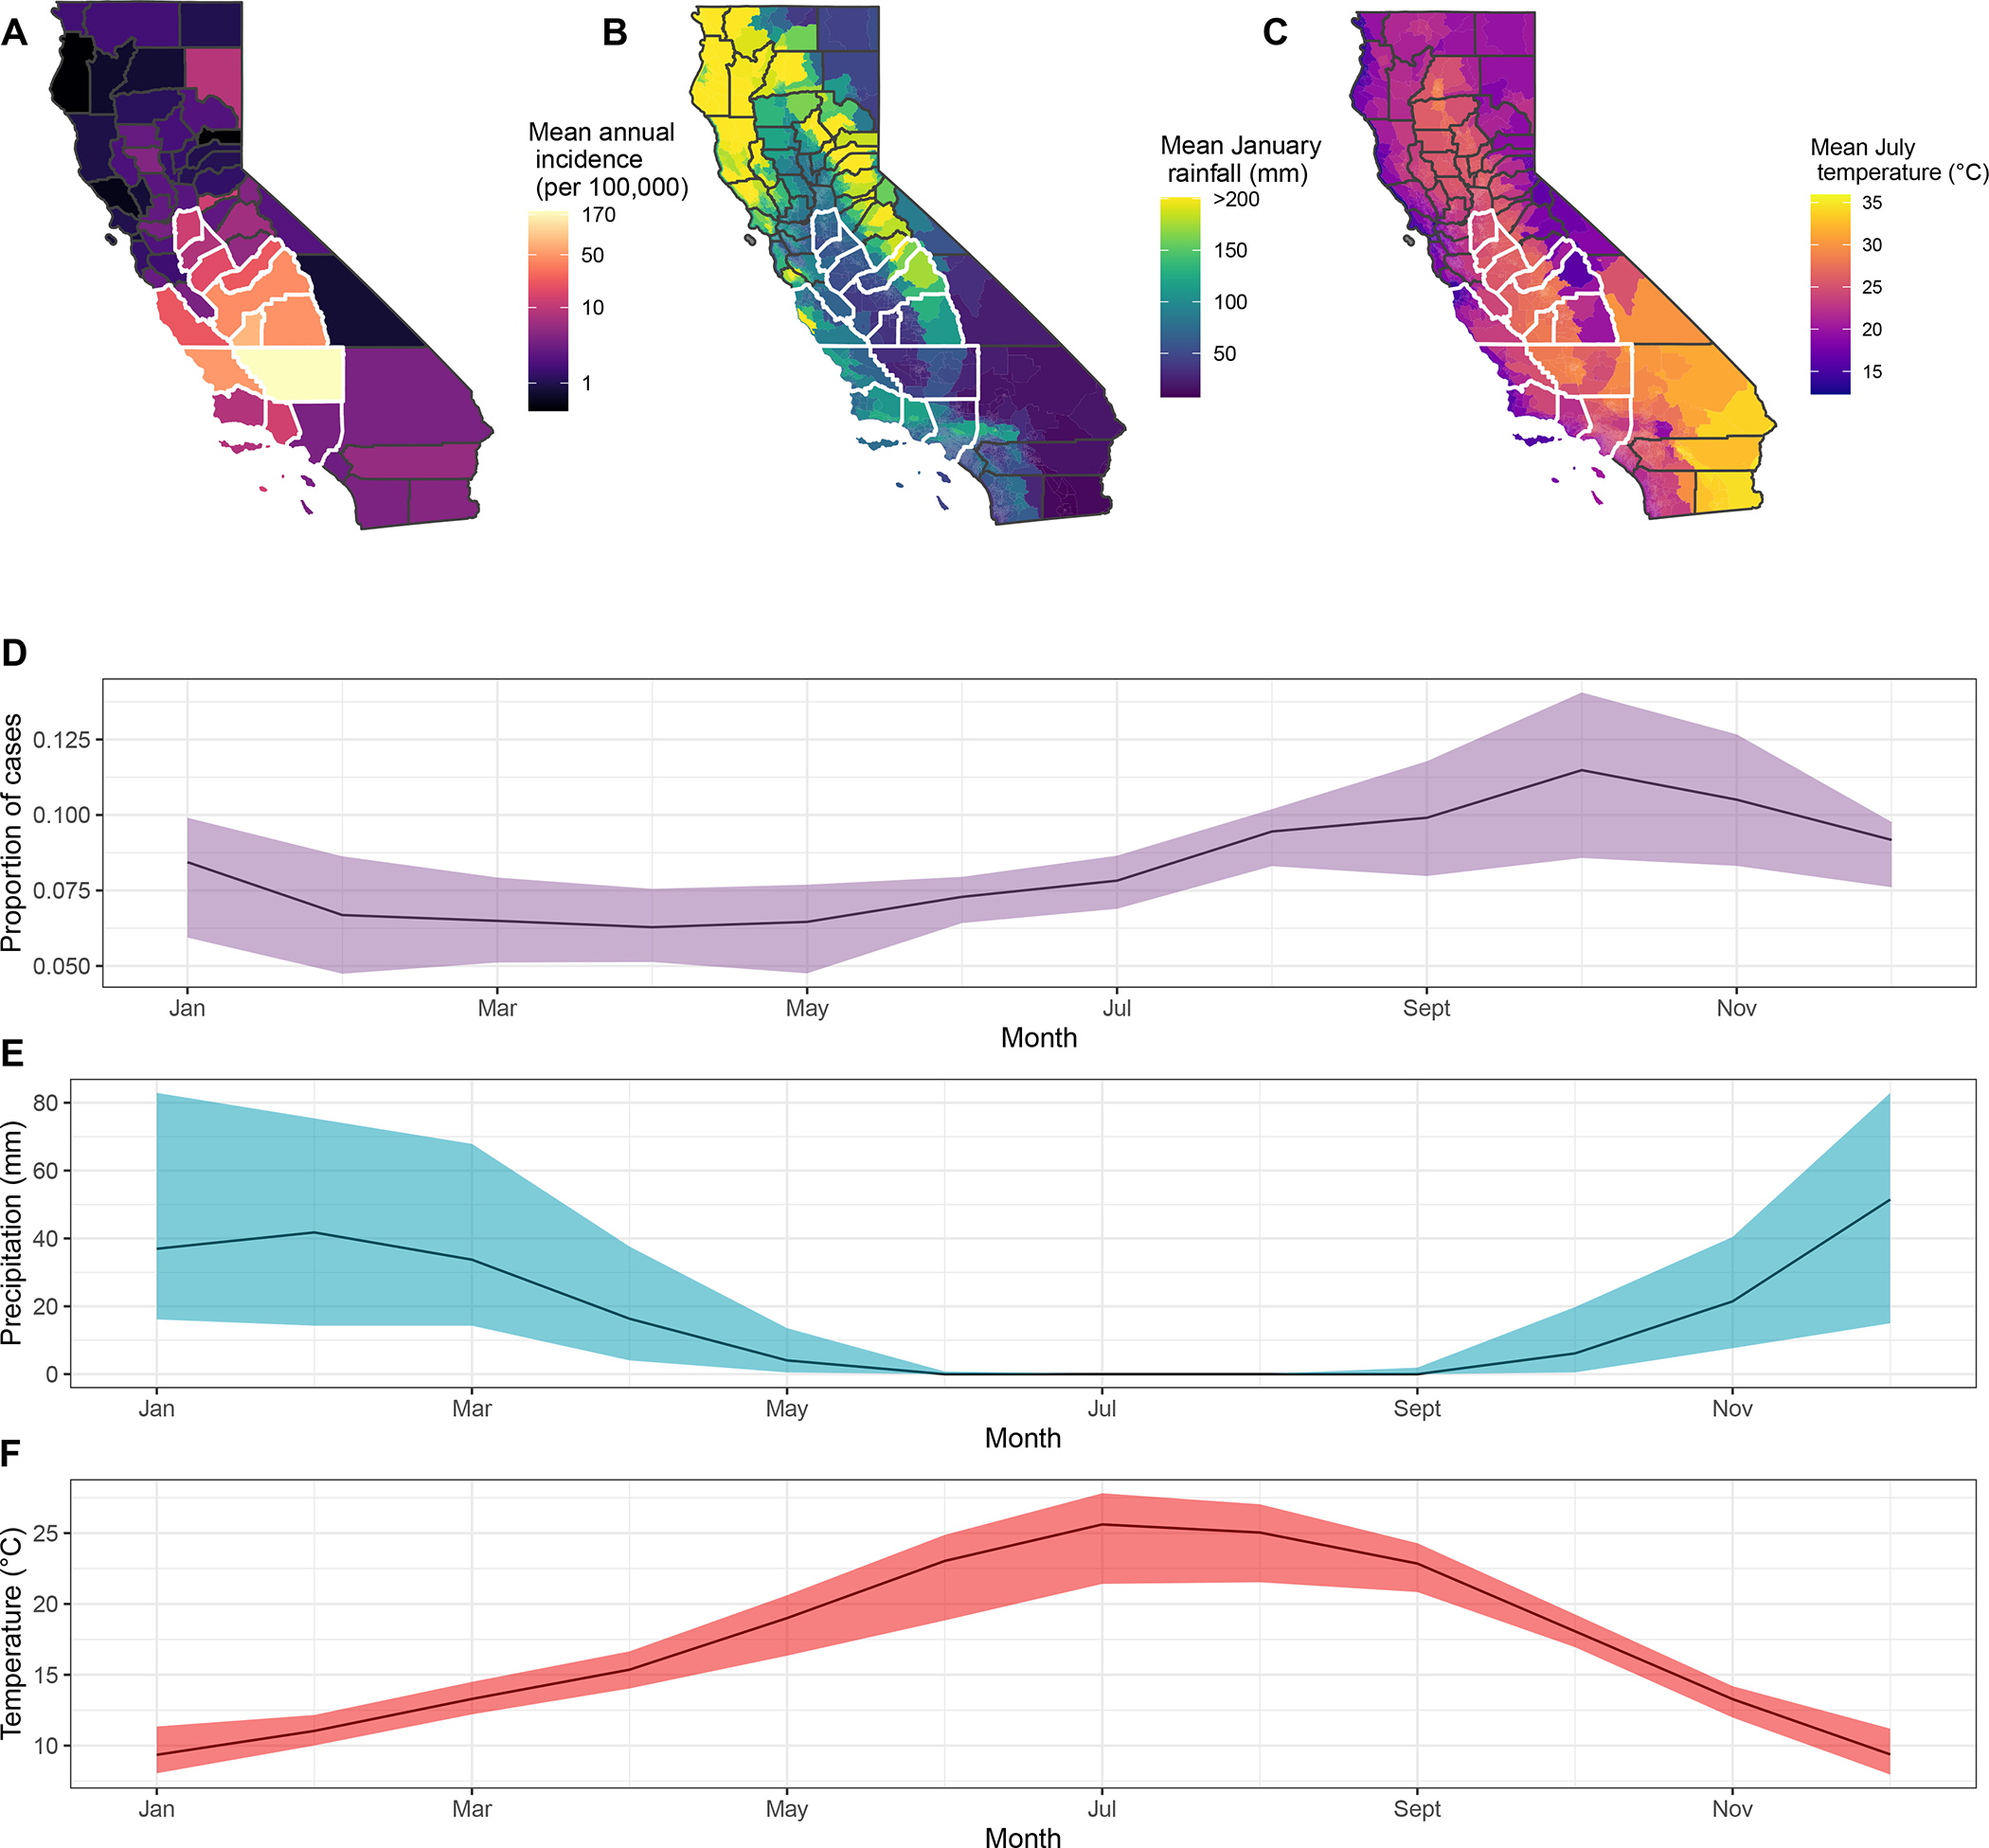
Background: Drought is an understudied driver of infectious disease dynamics. Amidst the ongoing southwestern North American megadrought, California (USA) is having the driest multi-decadal period since 800 CE, exacerbated by anthropogenic warming. In this study, we aimed to examine the influence of drought on coccidioidomycosis, an emerging infectious disease in southwestern USA.

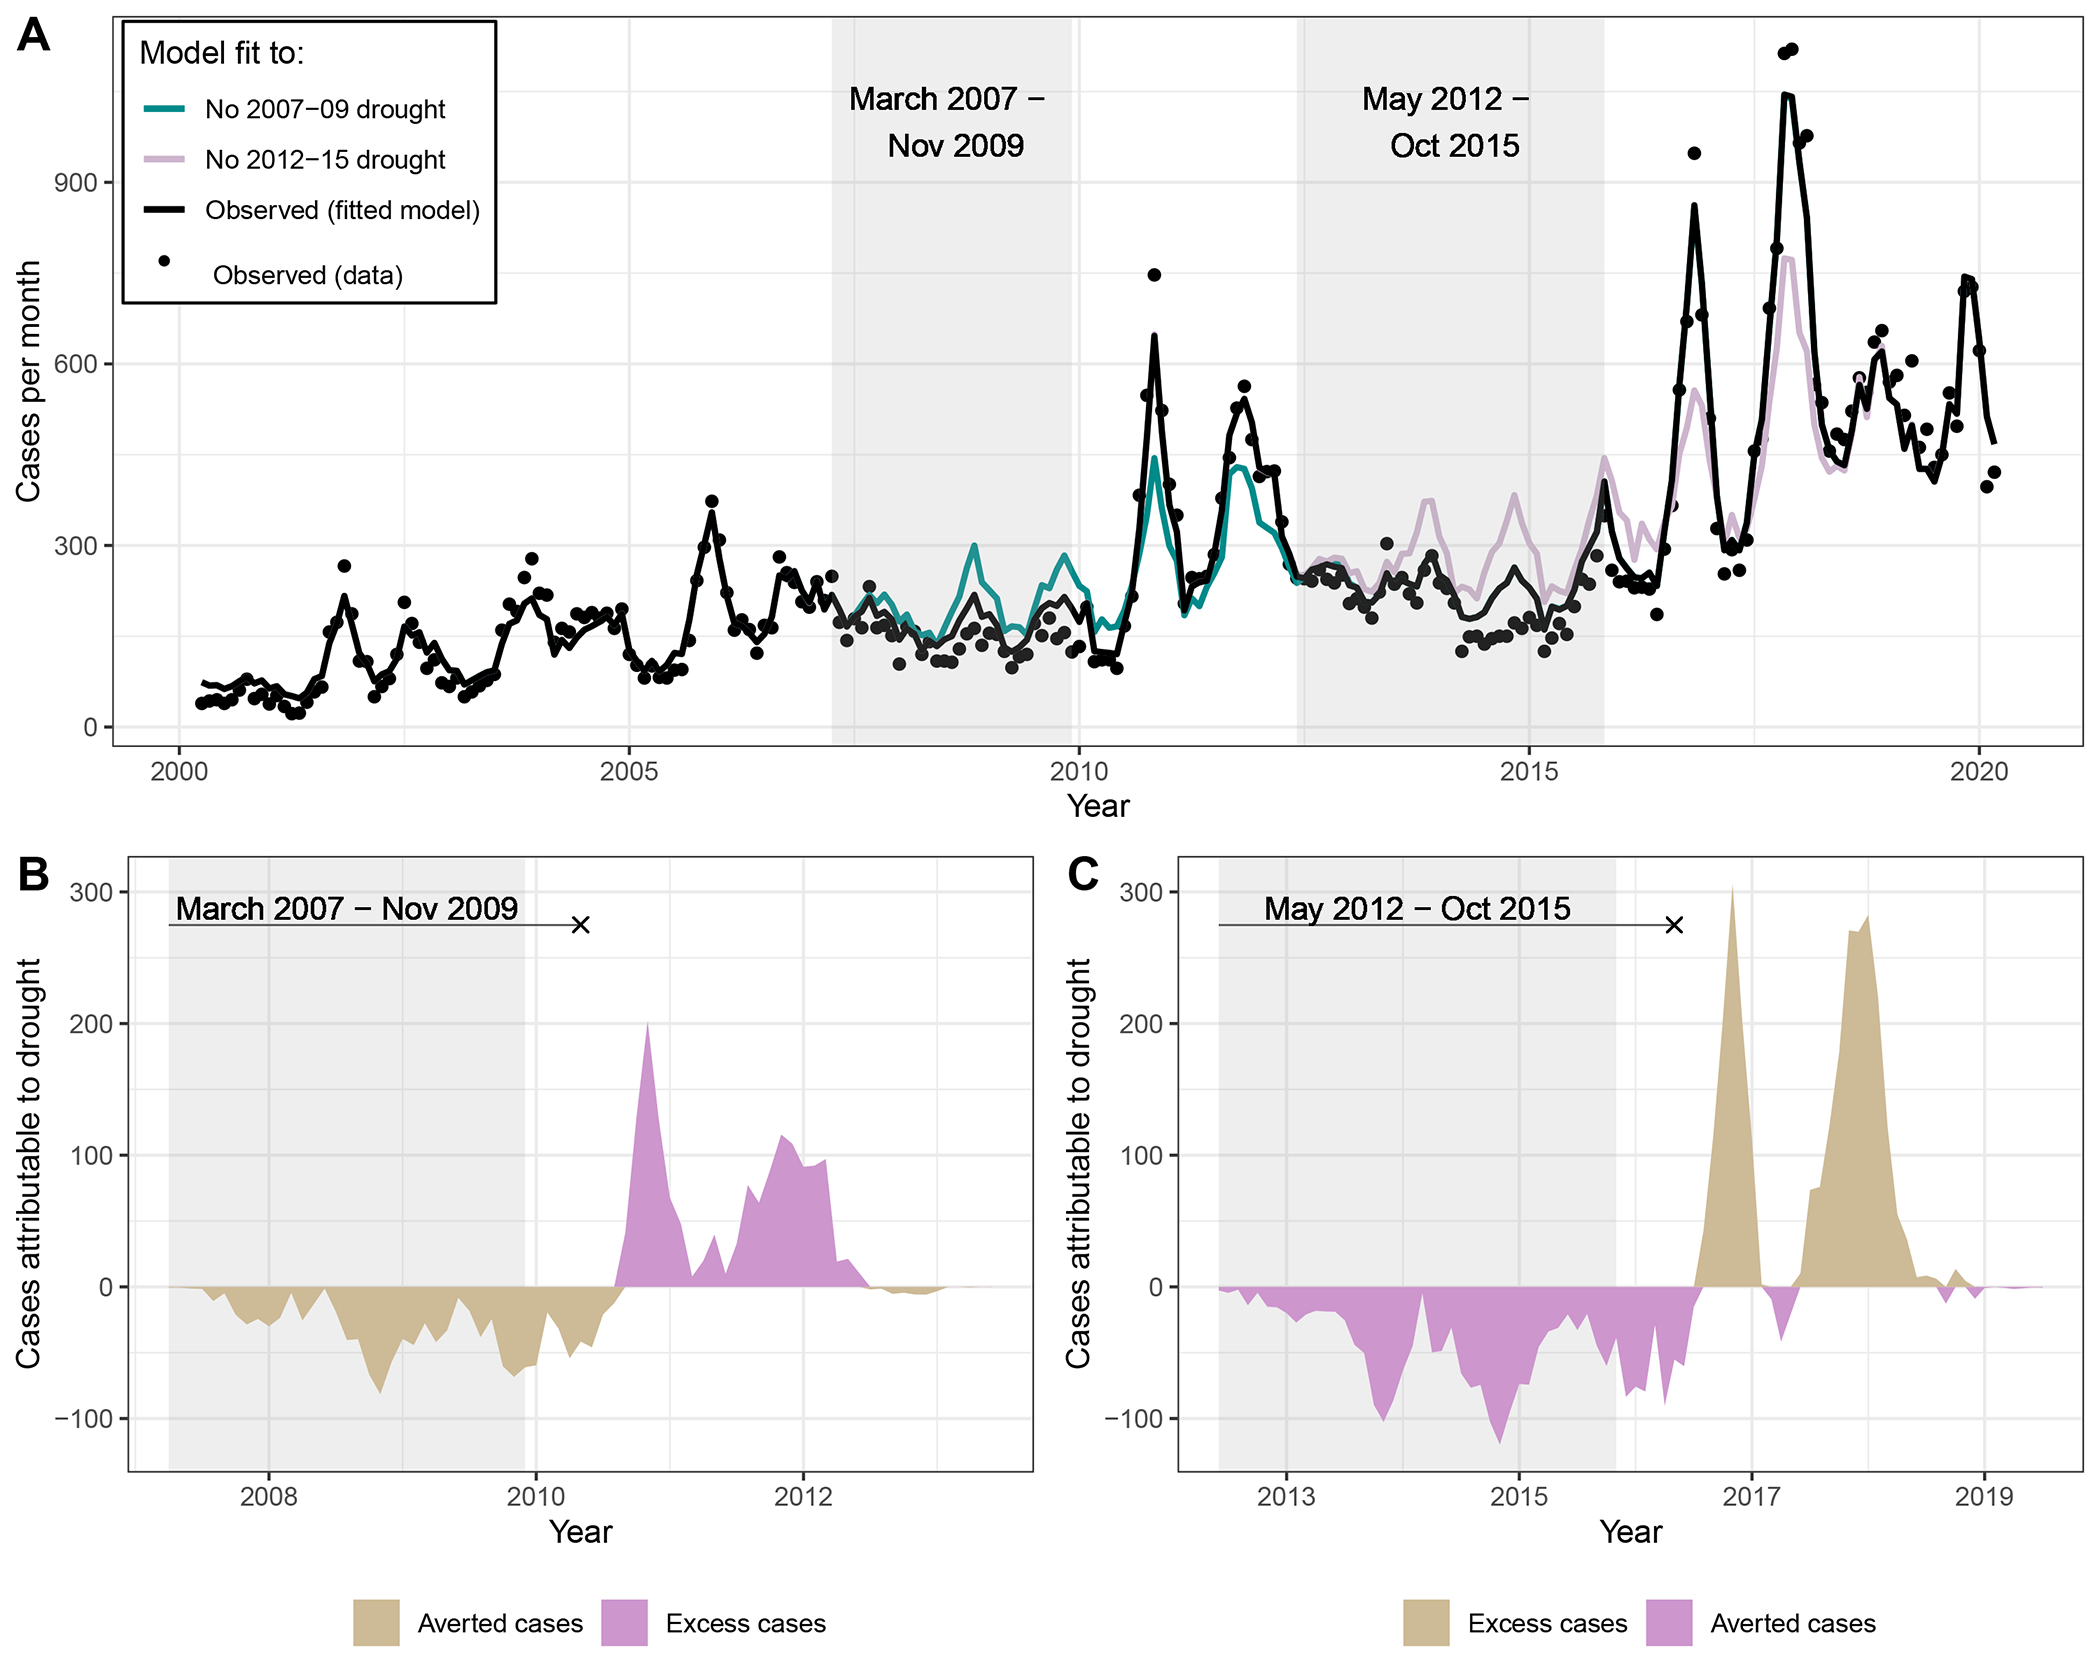
Methods: We analysed California census tract-level surveillance data from 2000 to 2020 using generalised additive models and distributed monthly lags on precipitation and temperature. We then developed an ensemble prediction algorithm of incident cases of coccidioidomycosis per census tract to estimate the counterfactual incidence that would have occurred in the absence of drought.

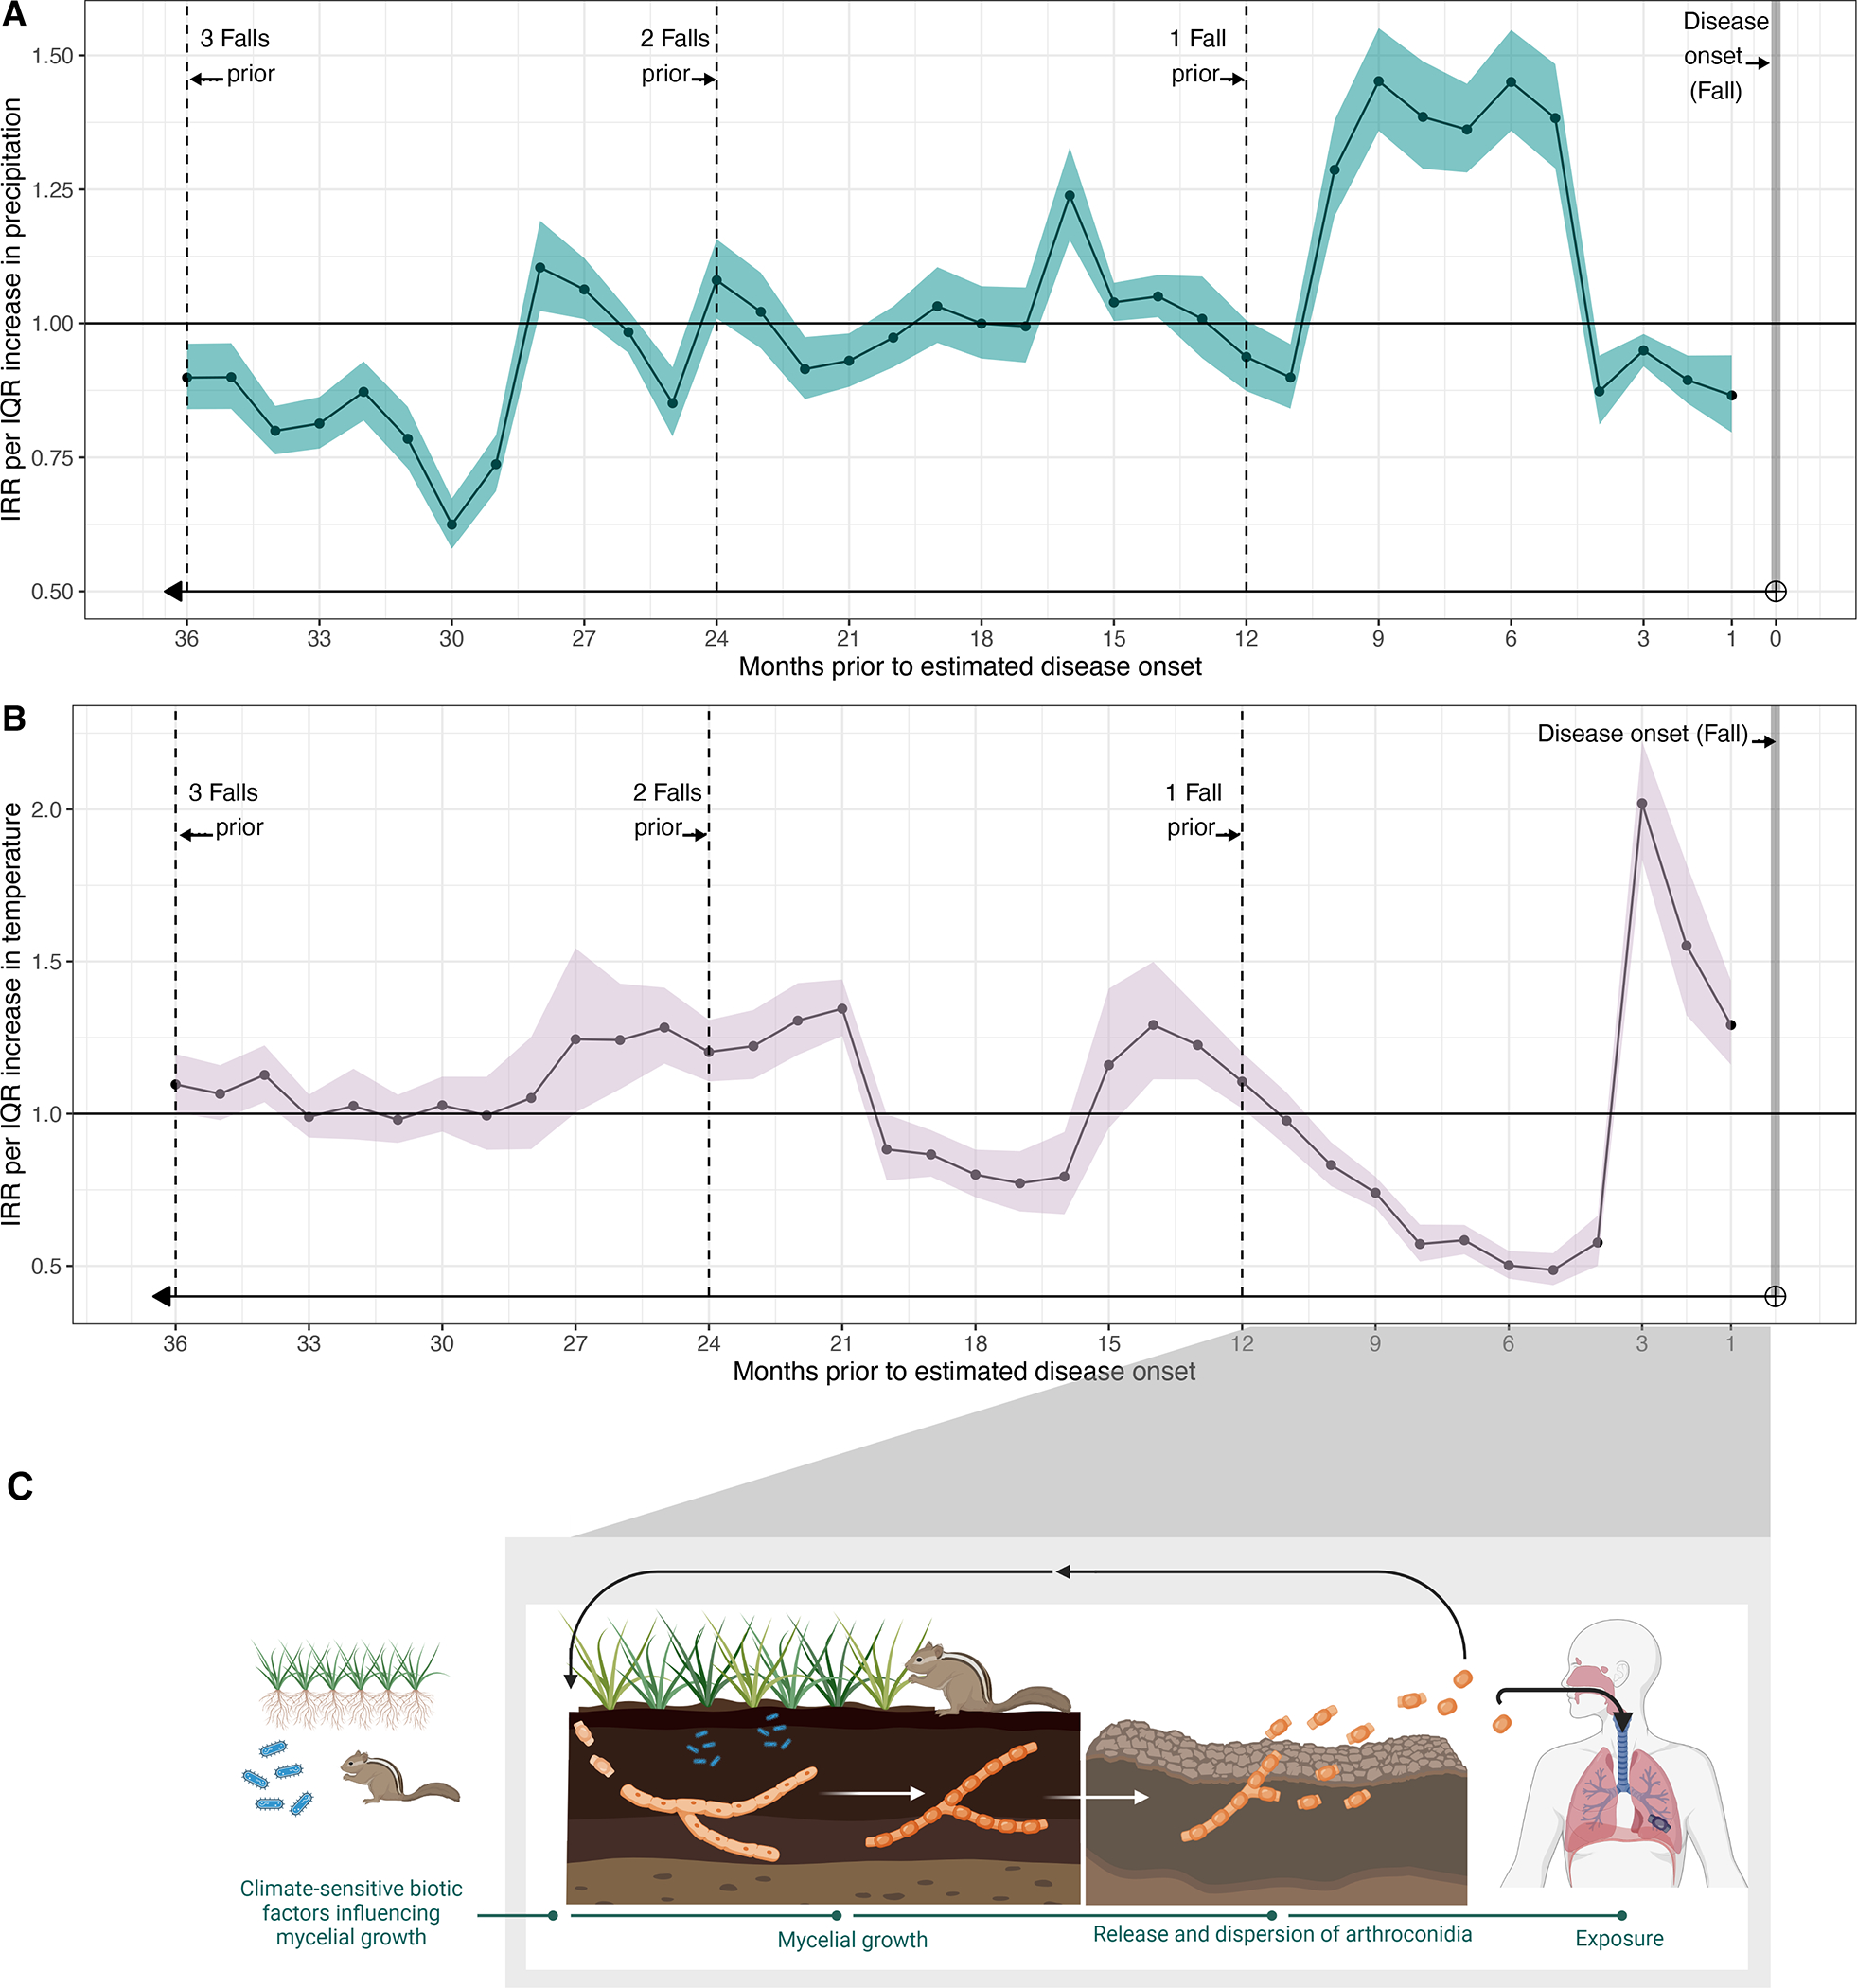
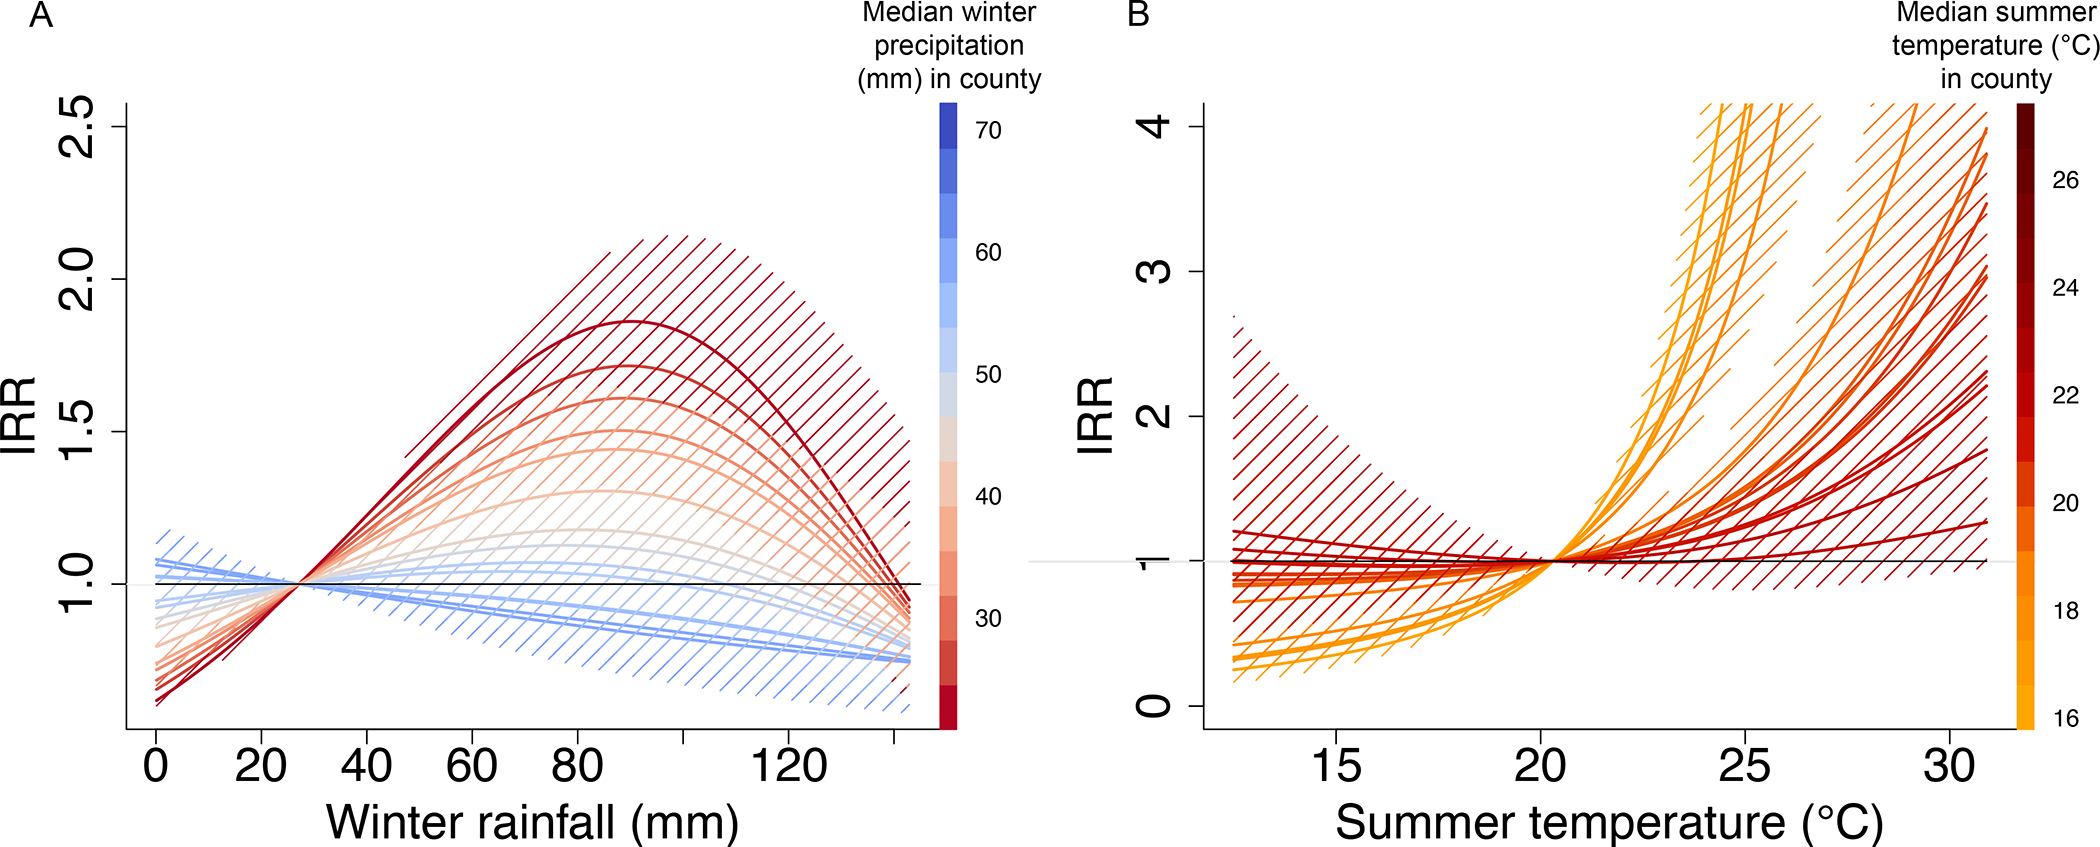
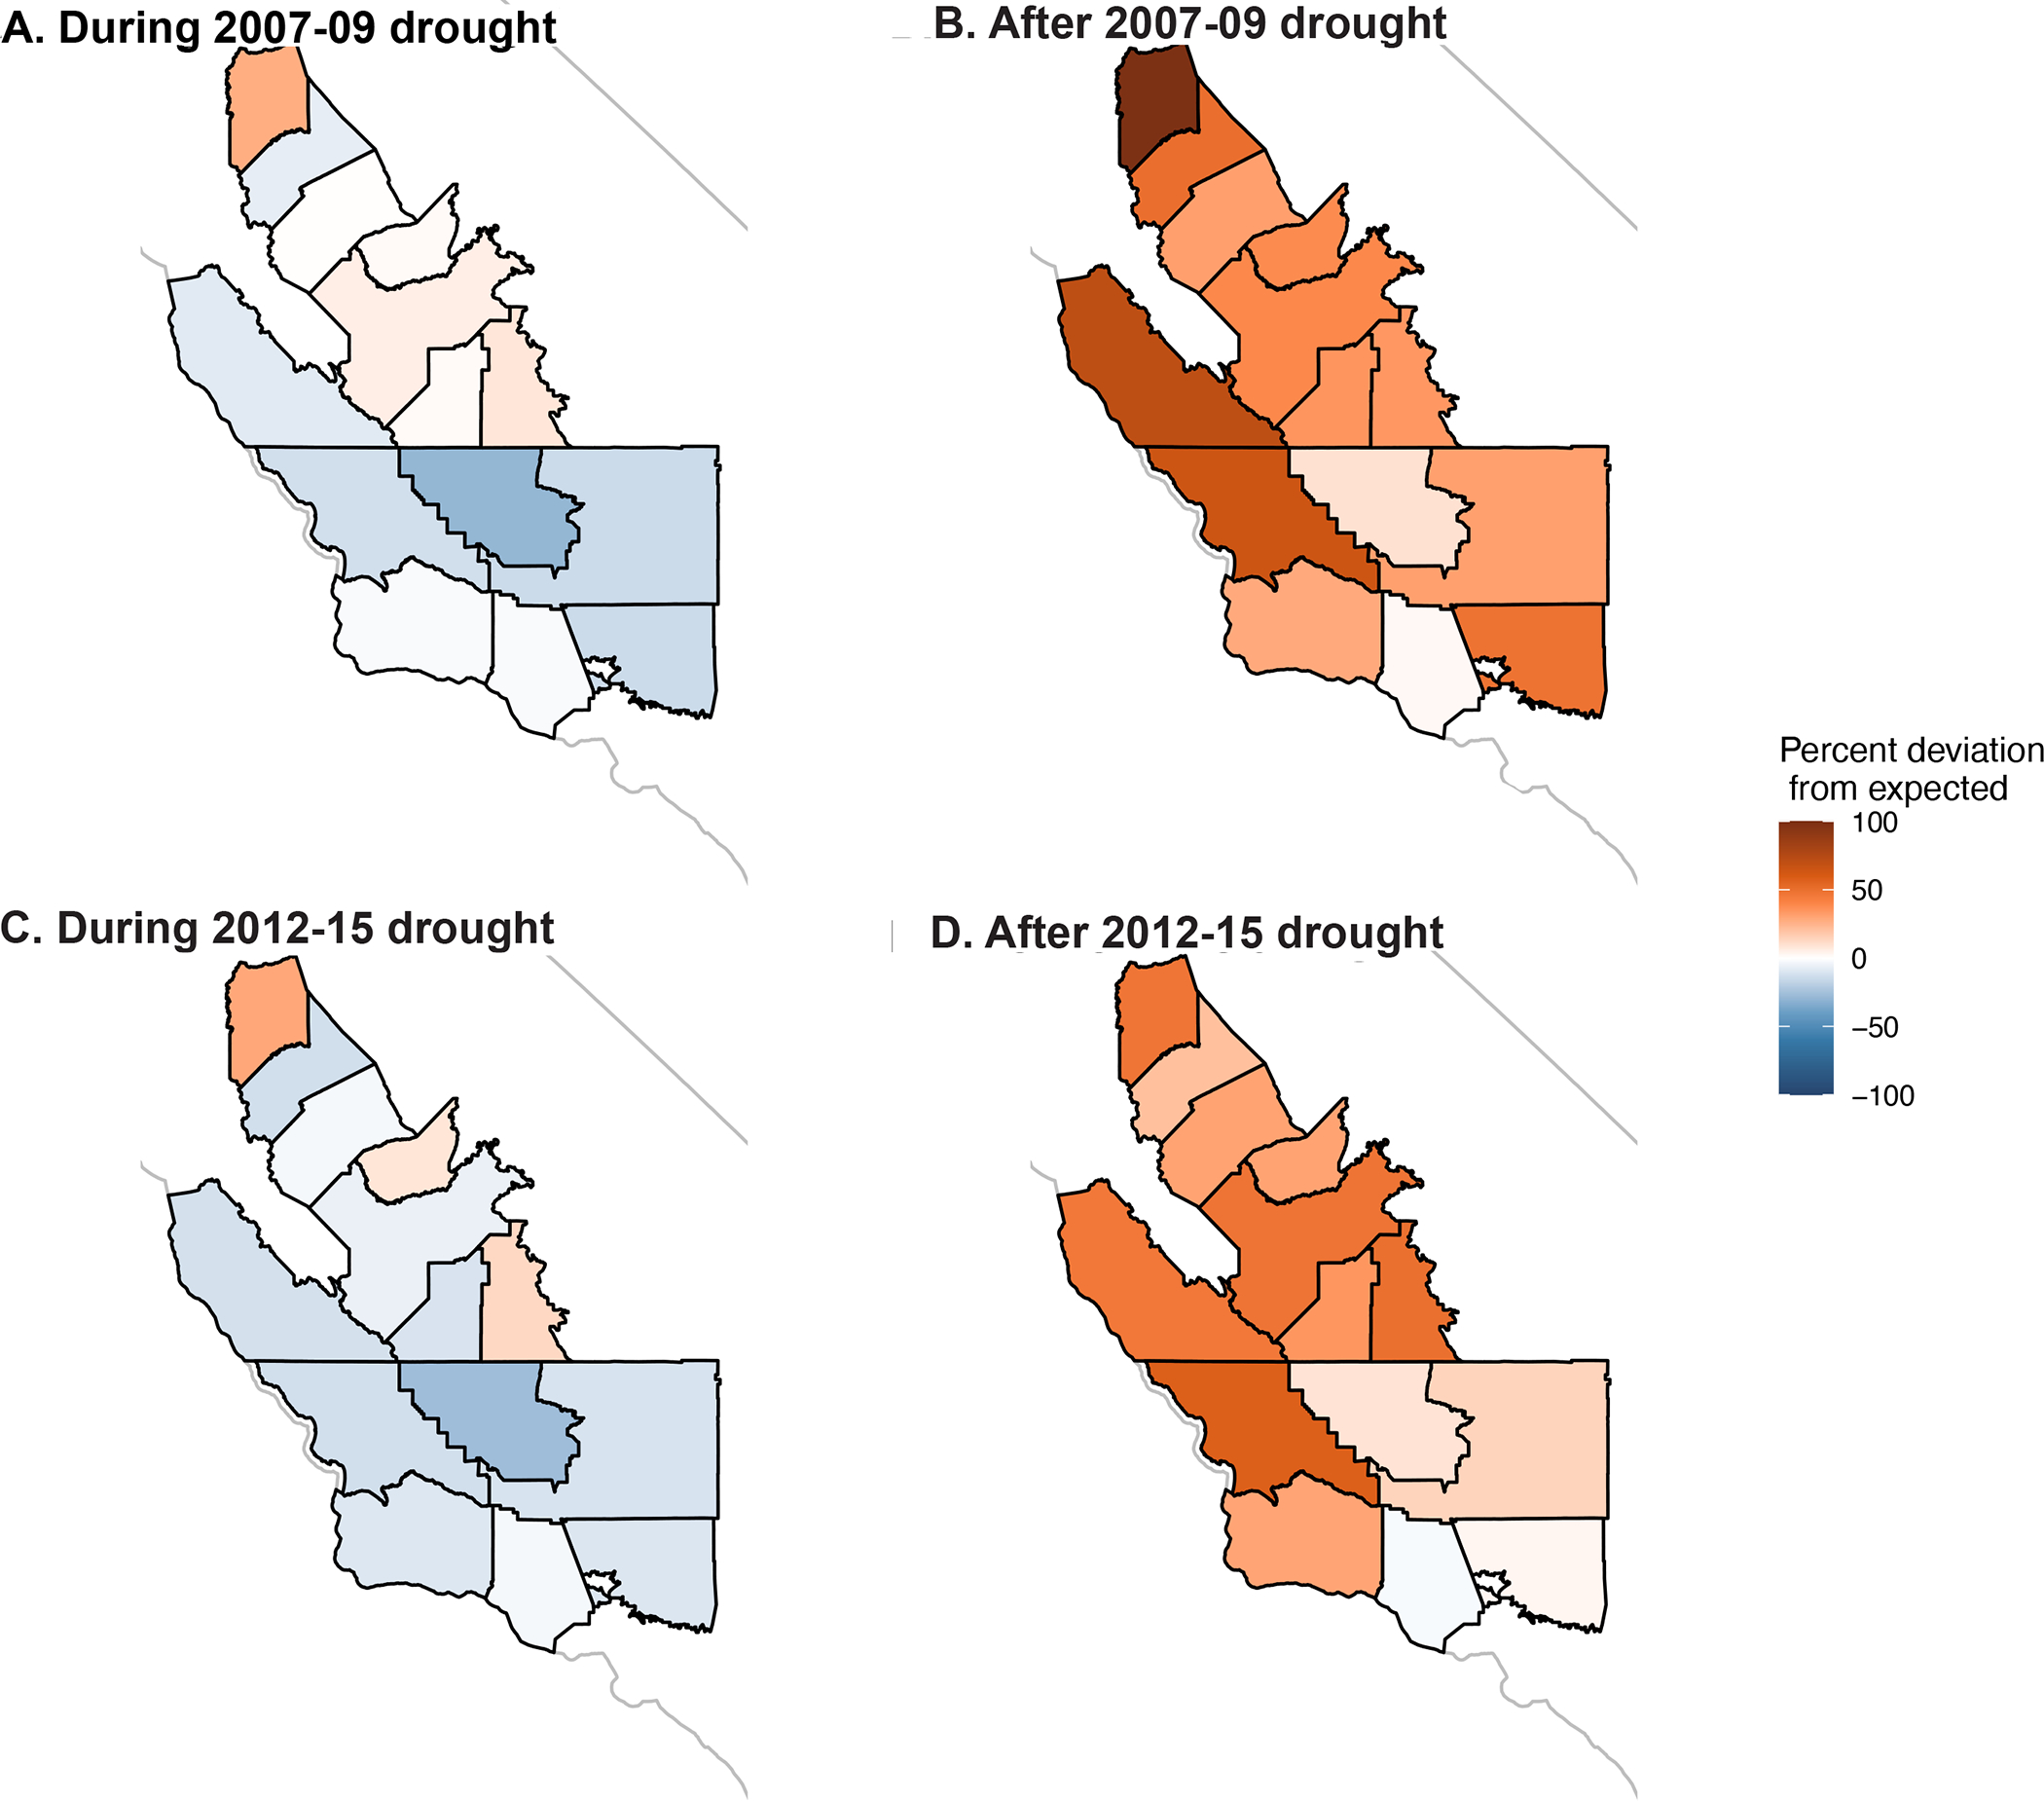
Findings: Between April 1, 2000, and March 31, 2020, there were 81 448 reported cases of coccidioidomycosis throughout California. An estimated 1467 excess cases of coccidioidomycosis were observed in California in the 2 years following the drought that occurred between 2007 and 2009, and an excess 2649 drought-attributable cases of coccidioidomycosis were observed in the 2 years following the drought that occurred between 2012 and 2015. These increased numbers of cases more than offset the declines in cases that occurred during drought. An IQR increase in summer temperatures was associated with 2·02 (95% CI 1·84-2·22) times higher incidence in the following autumn (September to November), and an IQR increase in precipitation in the winter was associated with 1·45 (1·36-1·55) times higher incidence in the autumn. The effect of winter precipitation was 36% (25-48) stronger when preceded by two dry, rather than average, winters. Incidence in arid counties was most sensitive to precipitation fluctuations, while incidence in wetter counties was most sensitive to temperature.

Interpretation: In California, multi-year cycles of dry conditions followed by a wet winter increases transmission of coccidioidomycosis, especially in historically wetter areas. With anticipated increasing frequency of drought in southwestern USA, continued expansion of coccidioidomycosis, along with more intense seasons, is expected. Our results motivate the need for heightened precautions against coccidioidomycosis in seasons that follow major droughts.

Funding: National Institutes of Health.


Conflict of interest statement

Declaration of interests We declare no competing interests.

Figures

Figure 1.
Figure 1.
Average annual incidence of coccidioidomycosis (A) between 2000 and 2020. Mean total monthly precipitation (B) during January between 2000–2020. Average daily temperature (C) during July between 2000–2020. Counties outlined in white were included in analyses. Mean (dark line) and interquartile range (shaded area) of the proportion of annual cases (D) with an estimated date of onset per month, between 2000 and 2020 in the study region. Median (dark line) and interquartile range (shaded area) of monthly total precipitation (mm) (E) and mean daily temperature (degrees Celsius) (F) between 2000 and 2020 in the study region.
Figure 2.
Figure 2.
Results of distributed lag, generalized additive model testing the association between fall (September – November) incidence rates and lagged meteorological variables. Incidence rate ratios (IRRs) express the effect of an interquartile range (IQR) increase in precipitation (A) or temperature (B) in months prior to the estimated date of disease onset, with confidence intervals shown by shading. The horizontal line at one indicates null association (IRR=1). Panel C displays the saprobic lifecycle of Coccidioides and maps the hypothesized grow and blow cycle to the intra-annual wet-dry patterns. Inter-annual influences affecting mycelial growth might include biota, small mammals, and soil dwelling microbial competitors (in blue). These factors may be influenced by climate across inter-annual time scales
Figure 3.
Figure 3.
Increases in winter precipitation or summer temperature had the greatest effect in regions where rain was scarce or temperatures were low, respectively. (A) Estimated exposure-response relationships expressed as incidence rate ratios (IRR; colored lines) corresponding to the effect of changing winter precipitation and (B) summer temperature from a reference level to the value shown. The reference level for the IRR is the 25th percentile for the study region (for which IRR=1). Each line indicates an exposure-response relationship expressed as the incidence rate ratio for a given temperature or precipitation value compared to the incidence rate at the 25th percentile condition for a given county, based on the county’s median winter precipitation (A) or median mean summer temperature (B). Dashed regions around the solid lines indicate 95% confidence intervals. IRR = incidence rate ratio
Figure 4.
Figure 4.
Droughts were associated with reduced incidence during the drought, and excess incidence following the drought. (A) Observed incidence (black dots) by month within the study region. Black line is the model fit under the observed environmental conditions. Color lines represent the expected incidence under the counterfactual intervention if the 2007–09 drought did not occur (cyan) or the 2012–15 drought did not occur (pink). Counterfactual scenarios were generated by setting temperatures observed to be higher than historical averages, and precipitation values observed to be below historical averages, deterministically to their average values. Gray boxes indicate the drought period. (B and C) Difference between expected cases and counterfactual cases if the 2007–09 (B) and the 2012–15 (C) droughts had not occurred, respectively. In B and C, the line symbol “——x” indicates the period that encompasses the drought and lasts until the end of the transmission season (March 31).
Figure 5.
Figure 5.
Estimated percent deviation in observed incident cases compared to the number expected in the absence of drought during (A and C) and in the two years following (B and D) the 2007–09 (A, B) and 2012–15 (C, D) droughts across the 14 counties in the study region. California state outline shown in light gray.

References

    1. Galgiani JN, Ampel NM, Blair JE, Catanzaro A, Johnson RH, Stevens DA, et al. Coccidioidomycosis. Clin Infect Dis. 2005;41(9):1217–23. - PubMed
    1. Cooksey GLS, Nguyen A, Vugia D, Jain S. Regional Analysis of Coccidioidomycosis Incidence—California, 2000–2018. Morbidity and Mortality Weekly Report. 2020;69(48):1817. - PMC - PubMed
    1. Gorris ME, Treseder KK, Zender CS, Randerson JT. Expansion of Coccidioidomycosis Endemic Regions in the United States in Response to Climate Change. GeoHealth. 2019;3(10):308–27. - PMC - PubMed
    1. Williams AP, Cook BI, Smerdon JE. Rapid intensification of the emerging southwestern North American megadrought in 2020–2021. Nature Climate Change. 2022.
    1. Diffenbaugh NS, Swain DL, Touma D. Anthropogenic warming has increased drought risk in California. Proceedings of the National Academy of Sciences. 2015;112(13):3931–6. - PMC - PubMed

Publication types