. 2022 Oct 8;20(1):387.
doi: 10.1186/s12916-022-02534-7.

Identifying optimal vaccination scenarios to reduce varicella zoster virus transmission and reactivation

Affiliations

Identifying optimal vaccination scenarios to reduce varicella zoster virus transmission and reactivation

Kevin M Bakker et al. BMC Med. .

Abstract

Background: Varicella zoster virus (VZV) is one of the eight known human herpesviruses. Initial VZV infection results in chickenpox, while viral reactivation following a period of latency manifests as shingles. Separate vaccines exist to protect against both initial infection and subsequent reactivation. Controversy regarding chickenpox vaccination is contentious with most countries not including the vaccine in their childhood immunization schedule due to the hypothesized negative impact on immune-boosting, where VZV reactivation is suppressed through exogenous boosting of VZV antibodies from exposure to natural chickenpox infections.

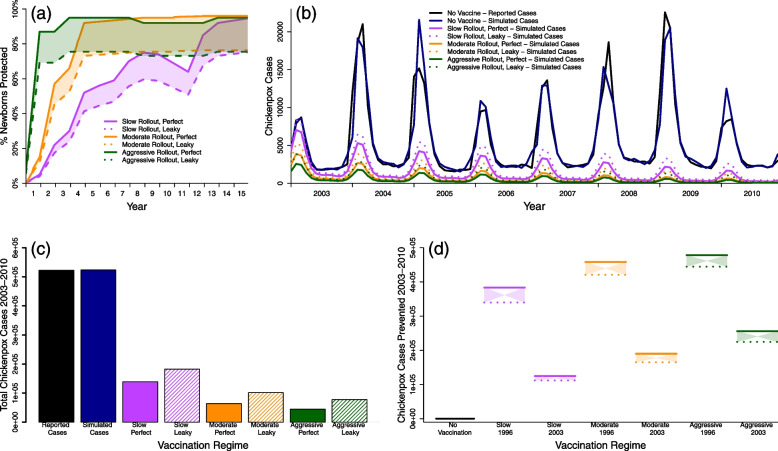
Methods: Population-level chickenpox and shingles notifications from Thailand, a country that does not vaccinate against either disease, were previously fitted with mathematical models to estimate rates of VZV transmission and reactivation. Here, multiple chickenpox and shingles vaccination scenarios were simulated and compared to a model lacking any vaccination to analyze the long-term impacts of VZV vaccination.

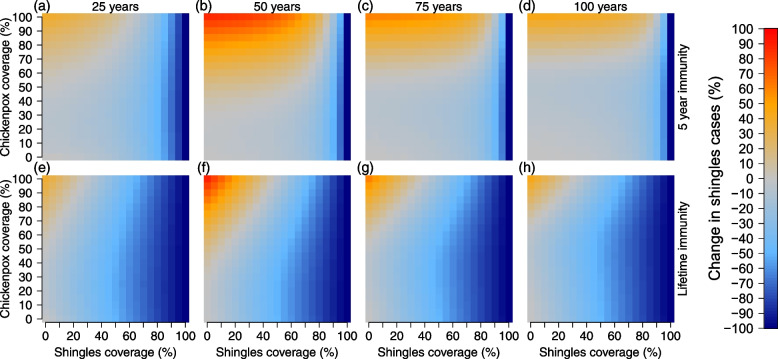
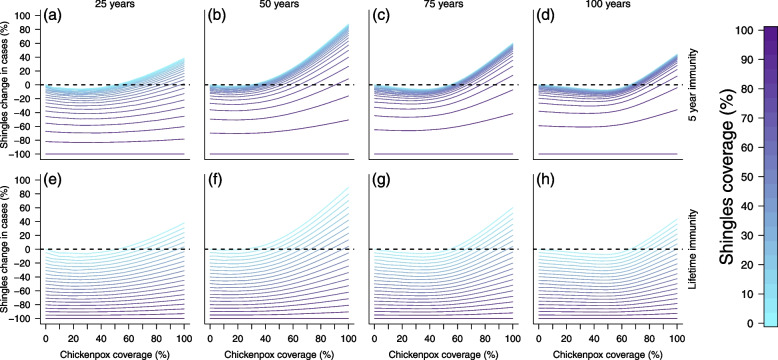
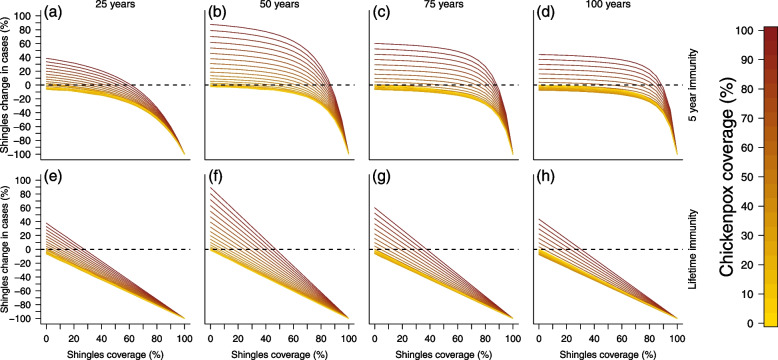
Results: As expected, simulations suggested that an introduction of the chickenpox vaccine, at any coverage level, would reduce chickenpox incidence. However, chickenpox vaccine coverage levels above 35% would increase shingles incidence under realistic estimates of shingles coverage with the current length of protective immunity from the vaccine. A trade-off between chickenpox and shingles vaccination coverage was discovered, where mid-level chickenpox coverage levels were identified as the optimal target to minimize total zoster burden. Only in scenarios where shingles vaccine provided lifelong immunity or coverage exceeded current levels could large reductions in both chickenpox and shingles be achieved.

Conclusions: The complicated nature of VZV makes it impossible to select a single vaccination scenario as universal policy. Strategies focused on reducing both chickenpox and shingles incidence, but prioritizing the latter should maximize efforts towards shingles vaccination, while slowly incorporating chickenpox vaccination. Alternatively, countries may wish to minimize VZV complications of both chickenpox and shingles, which would lead to maximizing vaccine coverage levels across both diseases. Balancing the consequences of vaccination to overall health impacts, including understanding the impact of an altered mean age of infection for both chickenpox and shingles, would need to be considered prior to any vaccine introduction.

Keywords: Chickenpox; Mathematical modeling; Shingles; Vaccination; Varicella zoster virus.


Conflict of interest statement

The authors declare that they have no competing interests.

Figures

Fig. 1
Fig. 1
Best fit model simulations under various immunization approaches. For all panels; reported chickenpox cases (black), simulated chickenpox cases without vaccination (blue), simulated chickenpox cases utilizing the data from the (slow) 1984 measles vaccine roll-out in Thailand (magenta), simulated chickenpox cases utilizing the data from the (moderate) 1992 hepatitis B, 3rd dose vaccine roll-out in Thailand (orange), and simulated chickenpox cases utilizing the (aggressive) 2006 Japanese Encephalitis roll-out in Thailand (green). a Uptake levels for the 3 roll-outs with perfect (solid line) and leaky (dashed line) uptake. Colored regions between dashed and solid lines represent realistic ranges of coverage. b Time series of simulated cases under various immunization roll-outs, during our study period (2003–2010) if vaccination had started in 1996. c Total reported, simulated, and immunization estimates for chickenpox cases over our 8 year study period (2003–2010). d Chickenpox cases prevented under various conditions, including if vaccination had started in 1996 or 2003. X-axis labels represent vaccine coverage, vaccine start date, with dashed lines representing leaky vaccines and solid representing perfect vaccines
Fig. 2
Fig. 2
Percent change in shingles cases compared to no vaccination, using a 20 year protection from chickenpox vaccination. Top row (ad) simulations provided 5 years of immunity from shingles vaccination and bottom row (eh) simulations provided lifetime immunity from shingles vaccination. Each column represents the number of years after vaccine introduction: a and e 25 years, b and f 50 years, c and g 75 years, and d and h 100 years. Shingles and chickenpox vaccine coverage (%) are shown on the x- and y-axes. Color scale on the right indicates the largest decrease in shingles cases can be seen in dark blue, while the largest increase in shingles cases can be seen in red
Fig. 3
Fig. 3
Cross section of Fig. 2. Top row represents simulations with 5 years of shingles vaccine immunity and the bottom row represents simulations with lifetime shingles vaccine immunity. Each column visualizes vaccination impact after 25 (left), 50 (middle left), 75 (middle right), and 100 (right) years. X-axes represent the chickenpox vaccination coverage, while the y-axes represents the change in shingles cases from the null vaccination simulation. Colors represent shingles vaccination coverage with a gradient from no vaccination (light blue) to fully vaccinated (dark purple). Dotted line at 0 identifies where there would be an increase (above the line) or decrease (below the line) in shingles cases compared to the simulation lacking vaccination
Fig. 4
Fig. 4
Cross section of Fig. 2. Top row represents simulations with 5 years of shingles vaccine immunity and the bottom row represents simulations with lifetime shingles vaccine immunity. Each column visualizes vaccination impact after 25 (left), 50 (middle left), 75 (middle right), and 100 (right) years. X-axes represent the shingles vaccination coverage, while the y-axes represents the change in shingles cases from the null vaccination simulation. Colors represent chickenpox vaccination coverage with a gradient from no vaccination (yellow) to fully vaccinated (dark red). Dotted line at 0 identifies where there would be an increase (above the line) or decrease (below the line) in shingles cases compared to the simulation lacking vaccination
Fig. 5
Fig. 5
a Model schematic, which includes susceptible (S), exposed (E), vaccinated against chickenpox (VVZ), infected with chickenpox (IVZ), vaccinated against shingles (VHZ), recovered from chickenpox (L1), infected with shingles (IHZ), and recovered from shingles (L2) classes. Births entered the model through either the S class or the vaccinated against chickenpox (VVZ) class depending on chickenpox vaccination (iii). Natural death occurred in all classes and is indicated by an arrow leaving each class at the bottom. b Vaccination simulations varied by chickenpox vaccination roll-out (i), chickenpox vaccination uptake (ii), shingles coverage (iii), and length of shingles immunity (iv). A model without any vaccination was also simulated where all values (i)-(iv) were set to 0

Similar articles

Cited by

References

    1. Sauerbrei A. Diagnosis, antiviral therapy, and prophylaxis of varicella-zoster virus infections. Eur J Clin Microbiol Infect Dis. 2016;35(5):723–34. - PubMed
    1. Wells MW. The Seasonal Patterns of Measles and Chicken Pox. Am J Hyg. 1944;40(3):279–317.
    1. Yawn BP, Gilden D. The Global Epidemiology of Herpes Zoster. Neurology. 2013;81:928–30. doi: 10.1212/WNL.0b013e3182a3516e. - DOI - PMC - PubMed
    1. Sengupta N, Brewer J. A global perspective of the epidemiology and burden of varicella-zoster virus. Curr Pediatr Rev. 2009;5(4):207–28. doi: 10.2174/157339609791317315. - DOI
    1. WHO. Background Paper on Varicella Vaccine: SAGE Working Group on Varicella and Herpes Zoster Vaccines. 2014. http://www.who.int/immunization/sage/meetings/2014/april/1_SAGE_varicell.... Accessed 15 Sept 2015.

Publication types