. 2022 Oct 8;20(1):459.
doi: 10.1186/s12967-022-03669-0.

Pivotal interplays between fecal metabolome and gut microbiome reveal functional signatures in cerebral ischemic stroke

Affiliations

Pivotal interplays between fecal metabolome and gut microbiome reveal functional signatures in cerebral ischemic stroke

Lanlan Zhao et al. J Transl Med. .

Abstract

Background: Integrative analysis approaches of metagenomics and metabolomics have been widely developed to understand the association between disease and the gut microbiome. However, the different profiling patterns of different metabolic samples in the association analysis make it a matter of concern which type of sample is the most closely associated with gut microbes and disease. To address this lack of knowledge, we investigated the association between the gut microbiome and metabolomic profiles of stool, urine, and plasma samples from ischemic stroke patients and healthy subjects.

Methods: We performed metagenomic sequencing (feces) and untargeted metabolomics analysis (feces, plasma, and urine) from ischemic stroke patients and healthy volunteers. Differential analyses were conducted to find key differential microbiota and metabolites for ischemic stroke. Meanwhile, Spearman's rank correlation and linear regression analyses were used to study the association between microbiota and metabolites of different metabolic mixtures.

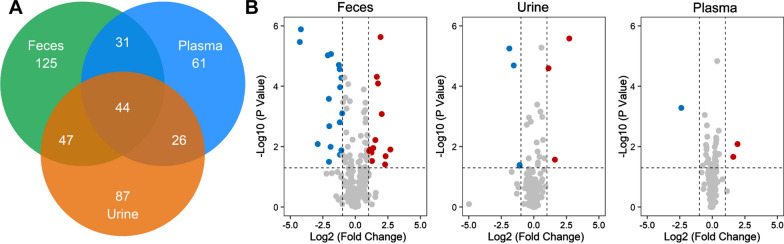
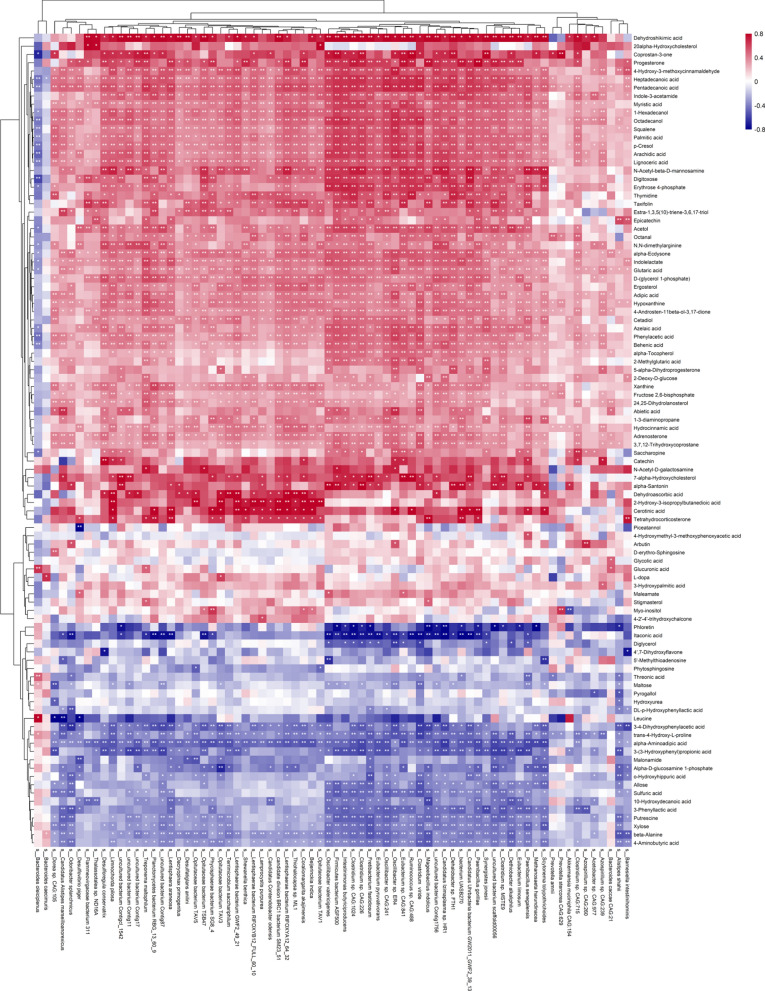
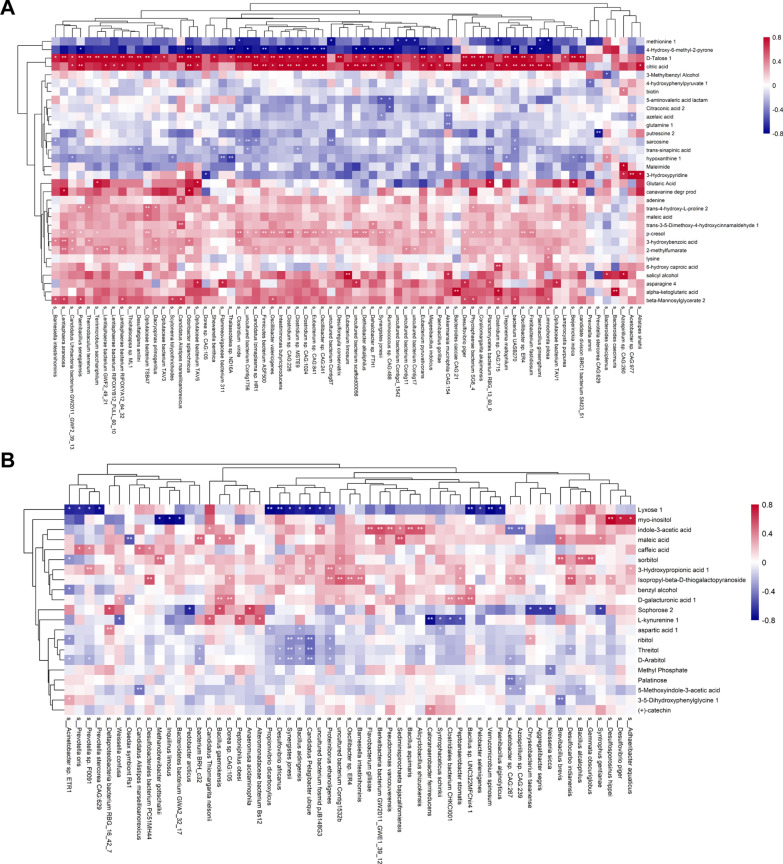
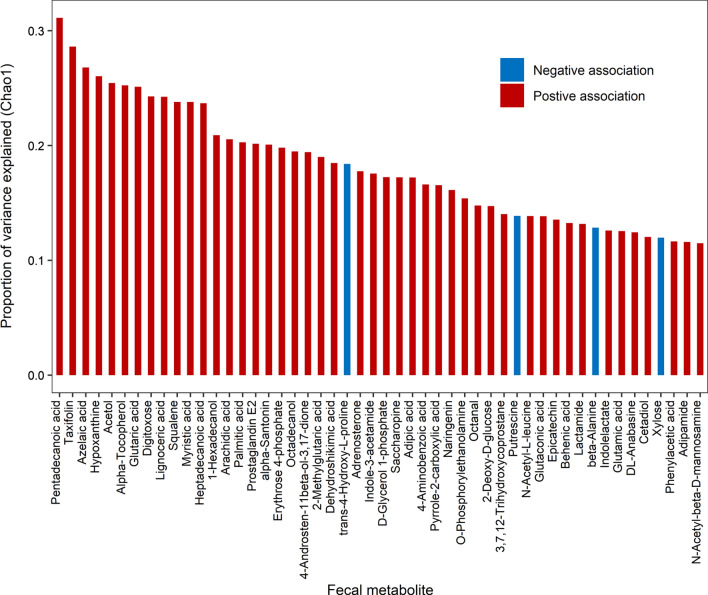
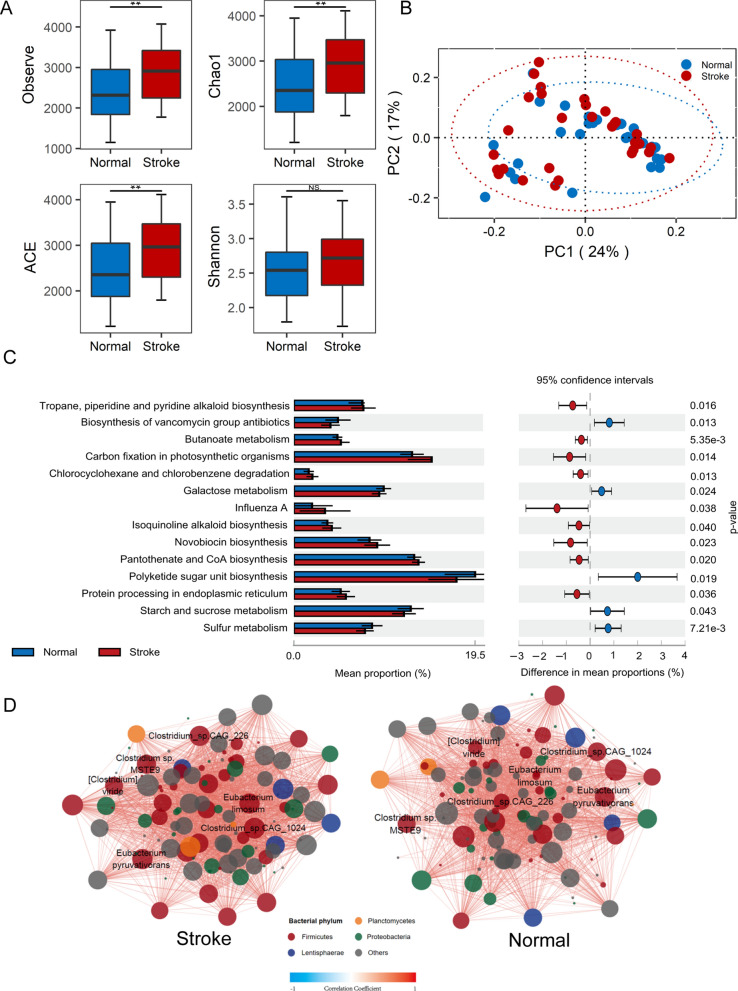
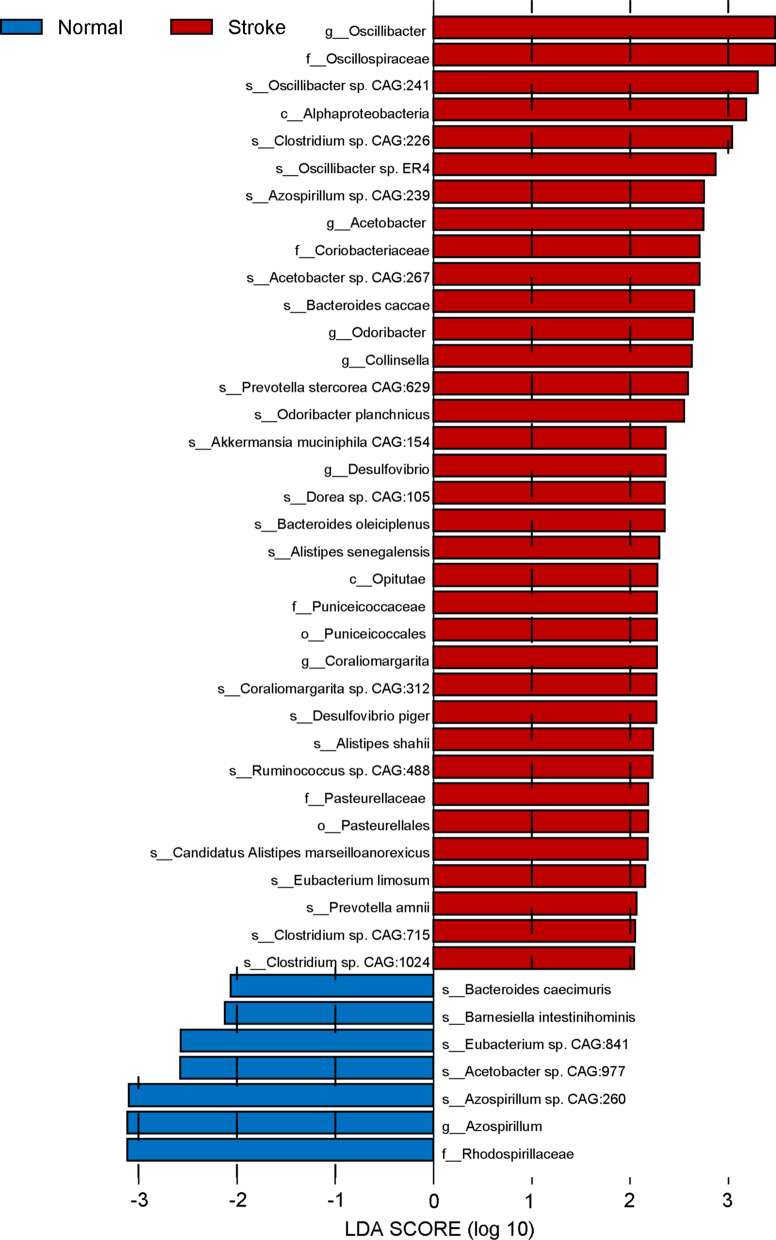
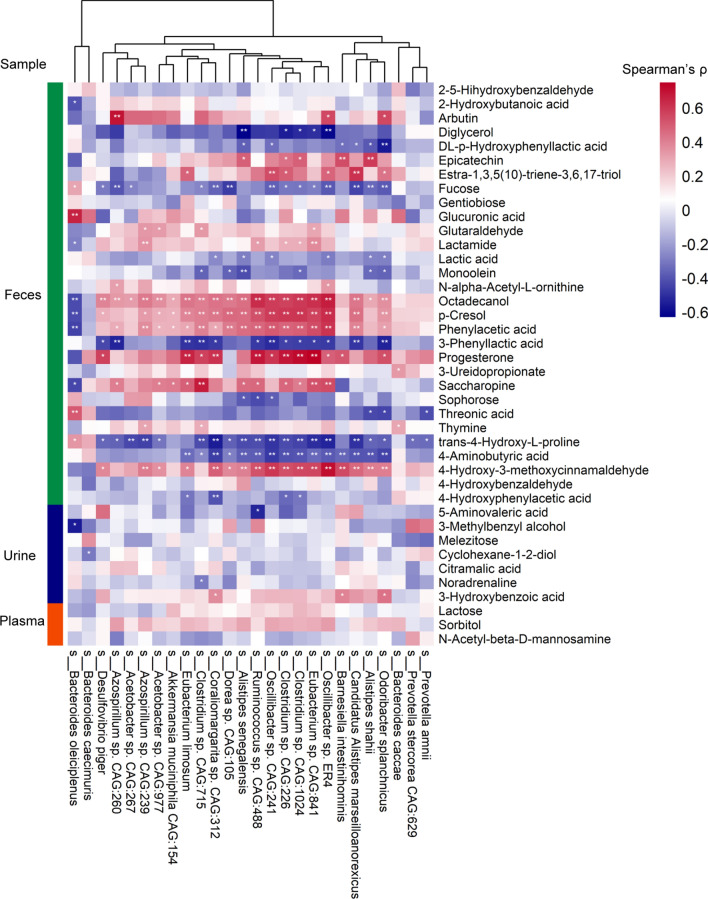
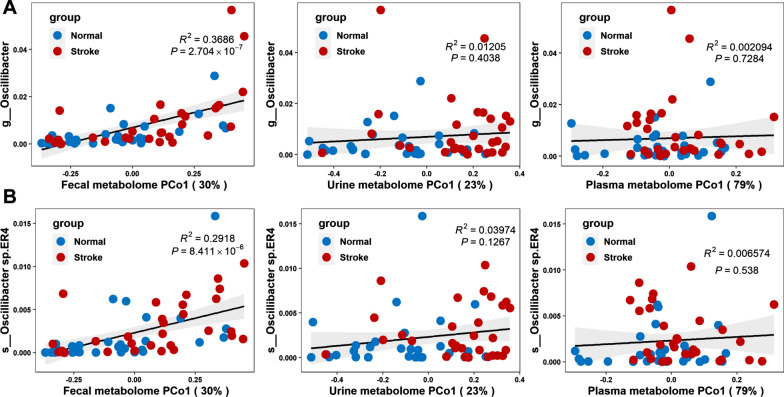
Results: Untargeted metabolomics analysis shows that feces had the most abundant features and identified metabolites, followed by urine and plasma. Feces had the highest number of differential metabolites between ischemic stroke patients and the healthy group. Based on the association analysis between metagenomics and metabolomics of fecal, urine, and plasma, fecal metabolome showed the strongest association with the gut microbiome. There are 1073, 191, and 81 statistically significant pairs (P < 0.05) in the correlation analysis for fecal, urine, and plasma metabolome. Fecal metabolites explained the variance of alpha-diversity of the gut microbiome up to 31.1%, while urine and plasma metabolites only explained the variance of alpha-diversity up to 13.5% and 10.6%. Meanwhile, there were more significant differential metabolites in feces than urine and plasma associated with the stroke marker bacteria.

Conclusions: The systematic association analysis between gut microbiome and metabolomics reveals that fecal metabolites show the strongest association with the gut microbiome, followed by urine and plasma. The findings would promote the association study between the gut microbiome and fecal metabolome to explore key factors that are associated with diseases. We also provide a user-friendly web server and a R package to facilitate researchers to conduct the association analysis of gut microbiome and metabolomics.

Keywords: Gut microbiota; Integrative analysis; Ischemic stroke; Metabolomics; Microbiome.


Conflict of interest statement

The authors declare that they have no competing interests.

Figures

Fig. 1
Fig. 1
Metabolic profiling analysis of metabolic mixtures in feces, urine and plasma. A Venn diagram of number of identified metabolites in feces, urine, and plasma. B Volcano plots of metabolite changes of CIS versus control in feces, urine, and plasma. Each dot represents a metabolite identified in the sample. Blue dot represents a metabolite that is downregulated in the CIS. Red dot represents a metabolite that is upregulated in the CIS
Fig. 2
Fig. 2
Heatmap of the Spearman’s rank correlation of species and fecal metabolites. 7056 pairs of correlations with 72 bacteria species and 98 fecal metabolites were plotted. Red squares indicate positive associations between these microbial species and clinical indexes. Blue squares indicate negative associations. The statistical significance was denoted inside the squares (*P < 0.05, **P < 0.01)
Fig. 3
Fig. 3
Heatmap of the Spearman’s rank correlation of species and urinary or plasma metabolites. Red squares indicate positive associations between these microbial species and clinical indexes. Blue squares indicate negative associations. The statistical significance was denoted inside the squares (*P < 0.05; **P < 0.01). A 2272 pairs of correlations with 71 bacteria species and 32 urinary metabolites were plotted. B 1197 pairs of correlations with 57 bacteria species and 21 plasma metabolites were plotted
Fig. 4
Fig. 4
The proportion of variance in Chao1 diversity explained by each fecal metabolite. Red bar denotes positive associations between metabolite and Chao1 diversity, while blue bar denotes negative associations
Fig. 5
Fig. 5
Gut microbiota taxonomic and functional comparison between CIS and the controls. A depicts the indices of alpha-diversity. B depicts the Principal Coordinates Analysis (PCoA) of beta-diversity. Each point represents a single sample in CIS and the controls. The two principal components (PC1 and PC2) explained 24% and 17%. C shows the relative abundance of KEGG pathways of functional annotations in the gut microbiota. The barplot with 95% confidence intervals denote the significantly different KEGG pathways between CIS and controls. D Gut bacterium-bacterium ecological network in CIS versus the controls. Correlations between taxa were calculated through Spearman’s rank correlation analysis. Statistical significance was determined for all pairwise comparisons. Only statistically significant correlations (P < 0.05) with |r|> 0.5 were plotted. The size of node, corresponding to individual microbial species, is proportional to the number of significant inter-species correlations. The color of node indicates the phylum to which the corresponding microbial species belong to. The color intensity of connective lines is proportional to the correlation coefficient, where blue lines indicate inverse correlations and red lines indicate positive correlations
Fig. 6
Fig. 6
Histograms of significantly diferent abundant taxa with LDA score (log10) > 2.0 and P < 0.05
Fig. 7
Fig. 7
Heatmap of the Spearman’s rank correlation of significantly differential species and metabolites. The statistical significance was denoted inside the squares (*P < 0.05, **P < 0.01)
Fig. 8
Fig. 8
Association between bactriea data and the first principal coordinate (PCo1) of metabolomics data. R2 and its significance were calculated using the ischemic stroke and control samples together. The black line and gray area show a linear model and its 95% confidence interval describing the overall trend. A Correlation between Oscillibacter and the first principal coordinate (PCo1) of fecal, urine, and plasma metabolomics data. B Correlation between Oscillibacter sp.ER4 and the first principal coordinate (PCo1) of fecal, urine, and plasma metabolomics data

Similar articles

Cited by

References

    1. Wang H, Gou W, Su C, Du W, Zhang J, Miao Z, et al. Association of gut microbiota with glycaemic traits and incident type 2 diabetes, and modulation by habitual diet: a population-based longitudinal cohort study in Chinese adults. Diabetologia. 2022;65(9):1572. doi: 10.1007/s00125-022-05737-y. - DOI - PMC - PubMed
    1. Fromentin S, Forslund SK, Chechi K, Aron-Wisnewsky J, Chakaroun R, Nielsen T, et al. Microbiome and metabolome features of the cardiometabolic disease spectrum. Nat Med. 2022;28:303–314. doi: 10.1038/s41591-022-01688-4. - DOI - PMC - PubMed
    1. Talmor-Barkan Y, Bar N, Shaul AA, Shahaf N, Godneva A, Bussi Y, et al. Metabolomic and microbiome profiling reveals personalized risk factors for coronary artery disease. Nat Med. 2022;28:295–302. doi: 10.1038/s41591-022-01686-6. - DOI - PubMed
    1. Tang WHW, Kitai T, Hazen SL. Gut microbiota in cardiovascular health and disease. Circ Res. 2017;120:1183–1196. doi: 10.1161/CIRCRESAHA.117.309715. - DOI - PMC - PubMed
    1. Wu J, Wang K, Wang X, Pang Y, Jiang C. The role of the gut microbiome and its metabolites in metabolic diseases. Protein Cell. 2021;12:360–373. doi: 10.1007/s13238-020-00814-7. - DOI - PMC - PubMed

Publication types

Substances