

Deletion patterns, genetic variability and protein structure of pfhrp2 and pfhrp3: implications for malaria rapid diagnostic test in Amhara region, Ethiopia
- PMID: 36209103
- PMCID: PMC9548178
- DOI: 10.1186/s12936-022-04306-3
Deletion patterns, genetic variability and protein structure of pfhrp2 and pfhrp3: implications for malaria rapid diagnostic test in Amhara region, Ethiopia
Abstract
Background: Although rapid diagnostic tests (RDTs) play a key role in malaria-control strategies, their efficacy has been threatened by deletion and genetic variability of the genes pfhrp2/3. This study aims to characterize the deletion, genetic patterns and diversity of these genes and their implication for malaria RDT effectiveness, as well as their genetic evolution in the Amhara region of Ethiopia.
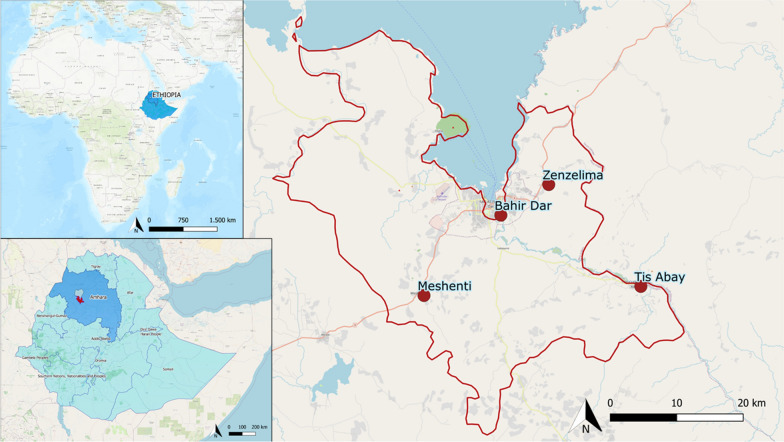
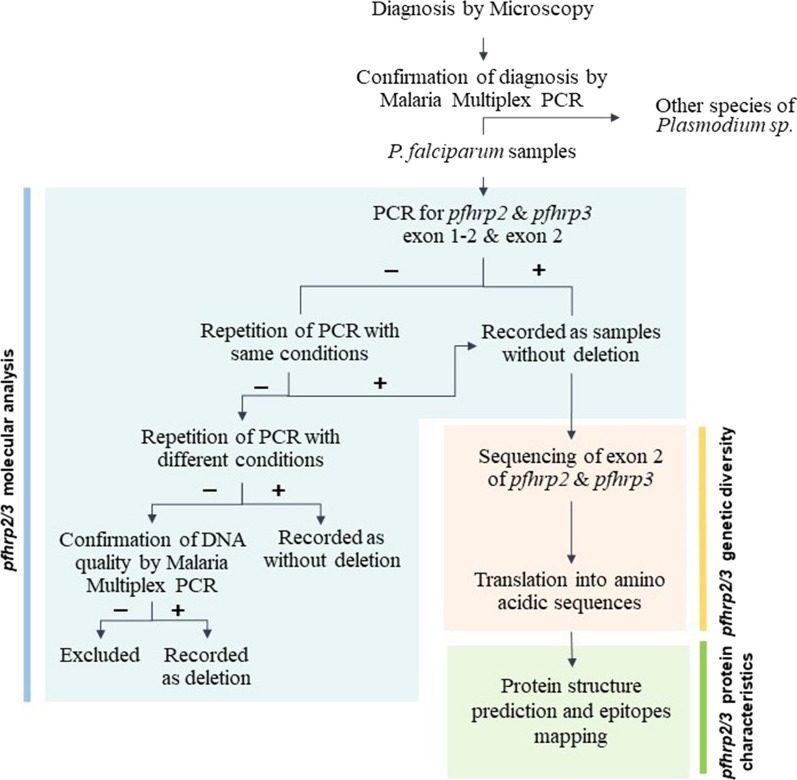
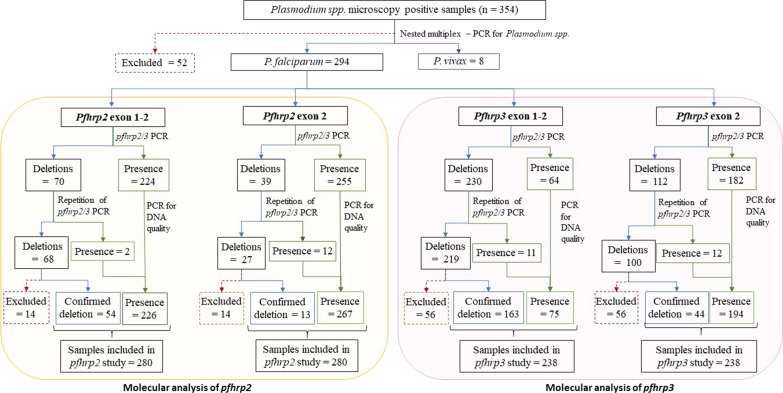
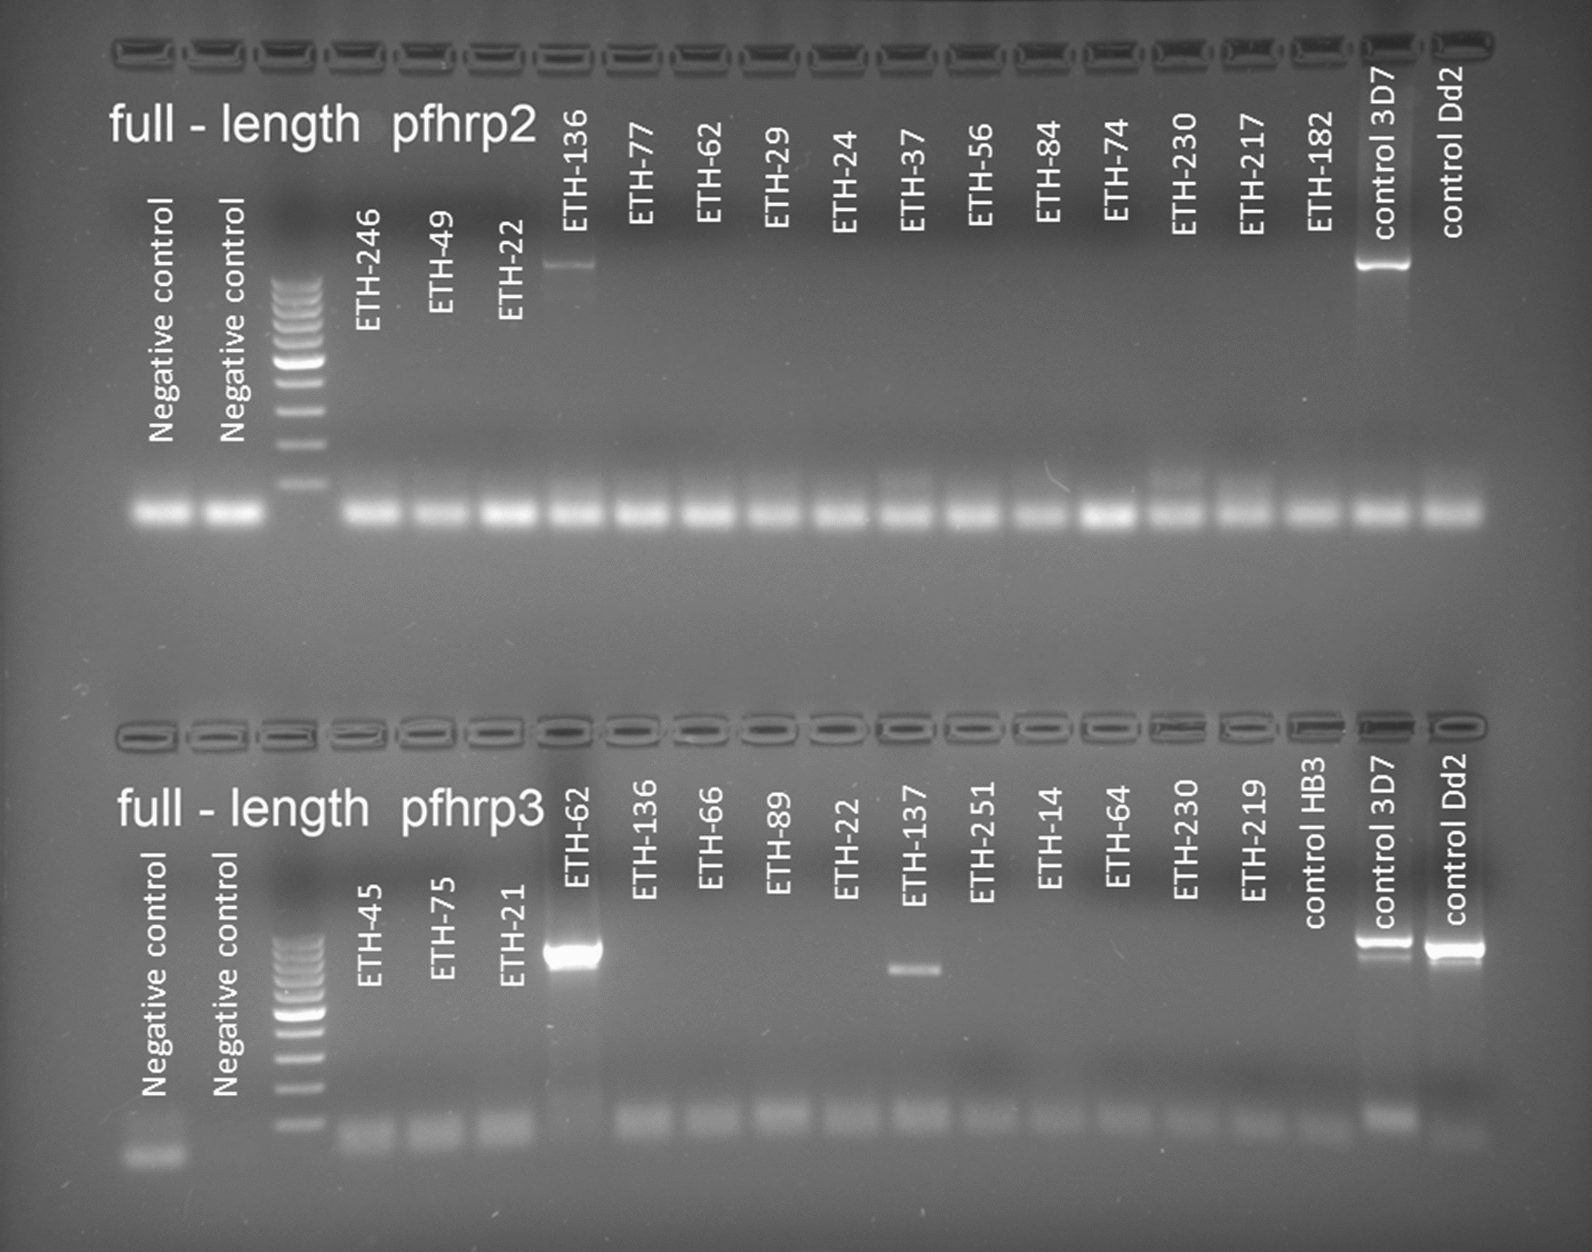
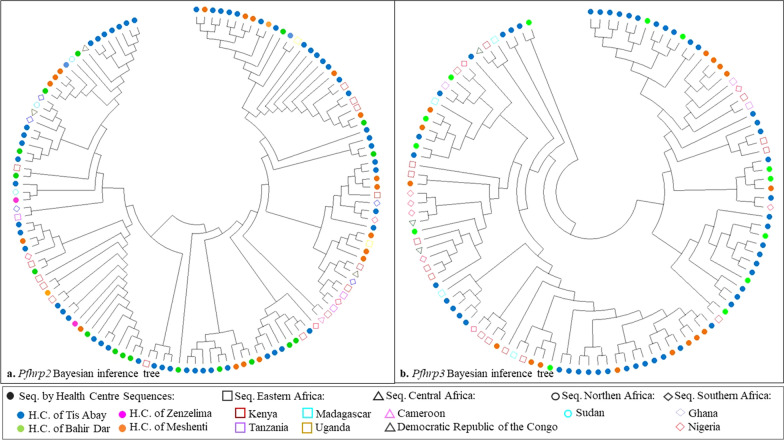
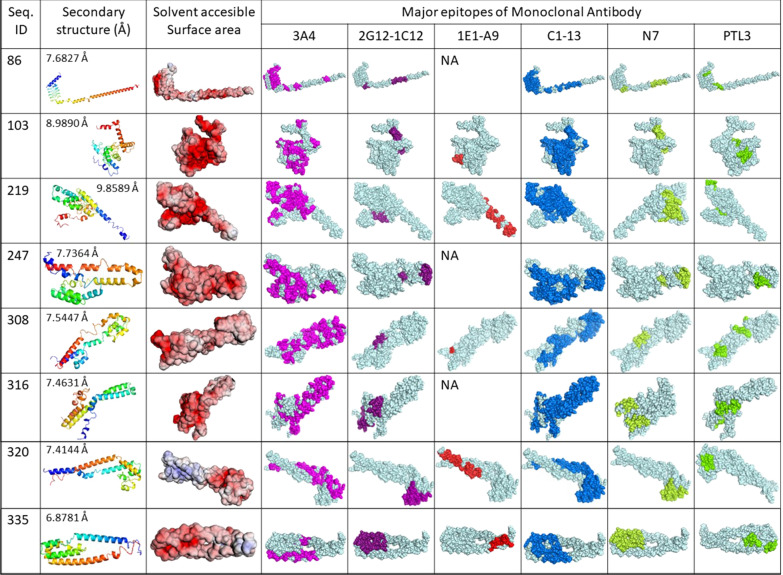
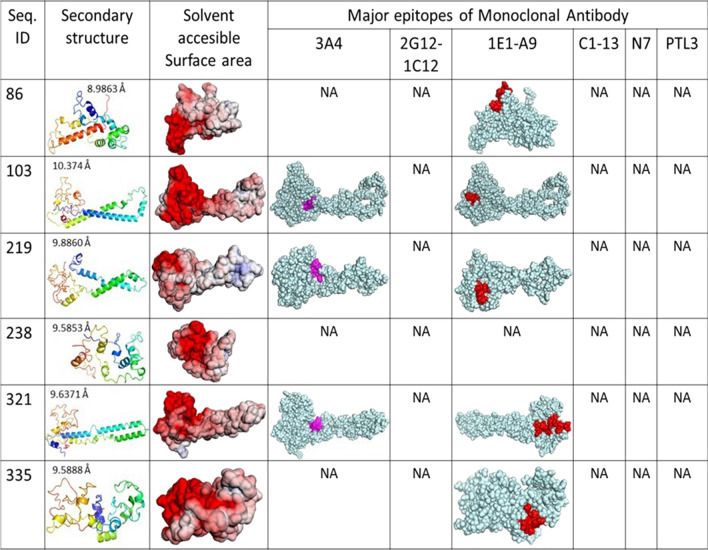
Methods: The study included 354 isolates from symptomatic patients from the Amhara region of Ethiopia who tested positive by microscopy. Exon 1-2 and exon 2 of genes pfhrp2 and -3 were amplified, and exon 2 was sequenced to analyse the genetic diversity, phylogenetic relationship and epitope availability.
Results: The deletion frequency in exon 1-2 and exon 2 was 22 and 4.6% for pfhrp2, and 68 and 18% for pfhrp3, respectively. Double deletion frequency for pfhrp2 and pfhrp3 was 1.4%. High genetic diversity, lack of clustering by phylogenetic analysis and evidence of positive selection suggested a diversifying selection for both genes. The amino-acid sequences, classified into different haplotypes, varied widely in terms of frequency of repeats, with novel amino-acid changes. Aminoacidic repetition type 2 and type 7 were the most frequent in all the sequences. The most frequent epitopes among protein sequences were those recognized by MAbs 3A4 and C1-13.
Conclusion: Deletions and high amino acidic variation in pfhrp2 and pfhrp3 suggest their possible impact on RDT use in the Amhara region, and the high genetic diversity of these genes could be associated with a diversifying selection in Ethiopia. Surveillance of these genes is, therefore, essential to ensure the effectiveness of public health interventions in this region.
Keywords: Deletions; Ethiopia; Malaria; Plasmodium falciparum; Rapid diagnostic test; pfhrp2.
© 2022. The Author(s).
Conflict of interest statement
The authors declare that they have no competing interests.
Figures
Similar articles
-
Deletion of target gene (histidine-rich protein 2/3) for Plasmodium falciparum rapid diagnostic tests in Amhara region, Ethiopia: a cross-sectional study.Malar J. 2025 Aug 2;24(1):250. doi: 10.1186/s12936-025-05485-5. Malar J. 2025. PMID: 40753217 Free PMC article.
-
Detection of high prevalence of Plasmodium falciparum histidine-rich protein 2/3 gene deletions in Assosa zone, Ethiopia: implication for malaria diagnosis.Malar J. 2021 Feb 23;20(1):109. doi: 10.1186/s12936-021-03629-x. Malar J. 2021. PMID: 33622309 Free PMC article.
-
Investigation of Plasmodium falciparum pfhrp2 and pfhrp3 gene deletions and performance of a rapid diagnostic test for identifying asymptomatic malaria infection in northern Ethiopia, 2015.Malar J. 2022 Mar 4;21(1):70. doi: 10.1186/s12936-022-04097-7. Malar J. 2022. PMID: 35246151 Free PMC article.
-
Impact of Plasmodium falciparum pfhrp2 and pfhrp3 gene deletions on malaria control worldwide: a systematic review and meta-analysis.Malar J. 2021 Jun 22;20(1):276. doi: 10.1186/s12936-021-03812-0. Malar J. 2021. PMID: 34158065 Free PMC article.
-
Genetic diversity and deletion of Plasmodium falciparum histidine-rich protein 2 and 3: a threat to diagnosis of P. falciparum malaria.Clin Microbiol Infect. 2019 May;25(5):580-585. doi: 10.1016/j.cmi.2018.09.009. Epub 2018 Sep 27. Clin Microbiol Infect. 2019. PMID: 30267926 Review.
Cited by
-
Malaria diagnosis challenges and pfhrp2 and pfhrp3 gene deletions using pregnant women as sentinel population in Nanoro region, Burkina Faso.Pathog Glob Health. 2024 Sep;118(6):481-491. doi: 10.1080/20477724.2024.2388489. Epub 2024 Aug 14. Pathog Glob Health. 2024. PMID: 39140699 Free PMC article.
-
Real-time PCR for malaria diagnosis and identification of Plasmodium species in febrile patients in Cubal, Angola.Parasit Vectors. 2024 Sep 11;17(1):384. doi: 10.1186/s13071-024-06467-3. Parasit Vectors. 2024. PMID: 39261971 Free PMC article.
-
First field and laboratory evaluation of LAMP assay for malaria diagnosis in Cubal, Angola.Parasit Vectors. 2023 Oct 3;16(1):343. doi: 10.1186/s13071-023-05942-7. Parasit Vectors. 2023. PMID: 37789462 Free PMC article.
-
A Countrywide Survey of hrp2/3 Deletions and kelch13 Mutations Co-occurrence in Ethiopia.J Infect Dis. 2024 Dec 16;230(6):e1394-e1401. doi: 10.1093/infdis/jiae373. J Infect Dis. 2024. PMID: 39083679 Free PMC article.
-
Evaluation of dried blood spot sampling for real-time PCR malaria diagnostics in a rural setting in Angola.Parasit Vectors. 2025 Feb 7;18(1):44. doi: 10.1186/s13071-025-06685-3. Parasit Vectors. 2025. PMID: 39915805 Free PMC article.
References
-
- WHO. World malaria report 2021. Geneva: World Health Organization; 2021. https://cdn.who.int/media/docs/default-source/malaria/world-malaria-repo....
-
- Wang D, Chaki P, Mlacha Y, Gavana T, Michael MG, Khatibu R, et al. Application of community-based and integrated strategy to reduce malaria disease burden in southern Tanzania : the study protocol of China-UK-Tanzania pilot project on malaria control. Infect Dis Poverty. 2019;8:4. doi: 10.1186/s40249-018-0507-3. - DOI - PMC - PubMed
MeSH terms
Substances
Grants and funding
LinkOut - more resources
Full Text Sources
Medical
