. 2022 Oct 8;13(1):5944.
doi: 10.1038/s41467-022-33584-3.

A hypothalamic dopamine locus for psychostimulant-induced hyperlocomotion in mice

Affiliations

A hypothalamic dopamine locus for psychostimulant-induced hyperlocomotion in mice

Solomiia Korchynska et al. Nat Commun. .

Abstract

The lateral septum (LS) has been implicated in the regulation of locomotion. Nevertheless, the neurons synchronizing LS activity with the brain's clock in the suprachiasmatic nucleus (SCN) remain unknown. By interrogating the molecular, anatomical and physiological heterogeneity of dopamine neurons of the periventricular nucleus (PeVN; A14 catecholaminergic group), we find that Th+/Dat1+ cells from its anterior subdivision innervate the LS in mice. These dopamine neurons receive dense neuropeptidergic innervation from the SCN. Reciprocal viral tracing in combination with optogenetic stimulation ex vivo identified somatostatin-containing neurons in the LS as preferred synaptic targets of extrahypothalamic A14 efferents. In vivo chemogenetic manipulation of anterior A14 neurons impacted locomotion. Moreover, chemogenetic inhibition of dopamine output from the anterior PeVN normalized amphetamine-induced hyperlocomotion, particularly during sedentary periods. Cumulatively, our findings identify a hypothalamic locus for the diurnal control of locomotion and pinpoint a midbrain-independent cellular target of psychostimulants.


Conflict of interest statement

The authors declare no competing interests.

Figures

Fig. 1
Fig. 1. Morphological and functional classification of Dat1+ neurons in the PeVN.
a Immunohistochemical identification of Dat1+ A14 dopamine neurons co-expressing tyrosine hydroxylase (TH) and tdTomato (fluorescence marked by arrows) in the PeVN of Dat1-Ires-Cre:Ai14 mice (n = 10 animals). Scale bar = 50 μm. b and c Representative current-clamp recordings of Dat1+ neurons in the PeVN and their post-hoc morphological reconstruction, including subtype “1” (b) and “2” (c) cells. Top left: schematic illustration showing the rostrocaudal allocation of A14 subtypes across the PeVN. The proportion of each neuronal subtype is indicated. Middle left: Action potential (AP) responses to two rheobase current pulses (colored) and at maximal frequency (black). Bottom left: Phase-plane plots of APs rising from 2× rheobase current injection. Right: Morphological reconstruction of a representative biocytin-filled Dat1+ neuron for each subtype. Axons were colorized in cyan, whereas dendrites were pseudocolored in magenta. d Immunohistochemistry for neuromedin S in the SCN (n = 9 animals). Scale bar = 10 μm. e Immunohistochemical detection of neuromedin S+ terminals contacting biocytin-filled Dat1+ neurons in the PeVN (arrows). Open rectangle denotes the location of the high-resolution inset. Representative AP signature identifies the target as a subtype “1” neuron. The experiment was performed in triplicate and produced invariable results. Scale bars = 50 μm (left) and 10 μm (right). f Representative current-clamp recordings of neuromedin-S induced AP firing by subtype “1” (top, n = 17 cells with 14 responders) and “2” neurons (bottom, n = 21 cells; 16 responders). Data were obtained in n = 14 animals. g Schematic map of A14 neuronal responses to neuromedin S in the rostrocaudal domain of the PeVN. Circle sizes are proportional to response strength (a total of n = 30 neurons from 14 animals were mapped). 3V third ventricle, AH anterior hypothalamus, Arc arcuate nucleus, DMH dorsomedial hypothalamus, PVN paraventricular nucleus, ScN suprachiasmatic nucleus, VMH ventromedial hypothalamus. Biorender was used to style experimental arrangements and brain regions (in b, c, g).
Fig. 2
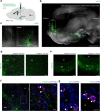
Fig. 2. Extrahypothalamic targets of Dat1+ neurons populating the PeVN.
a Graphical rendering of the experimental design for anterograde viral labeling of the projections of Dat1+ neurons by using AAV-hSyn-DIO-mCherry and AAV-hSyn-DIO-EGFP.WPRE.hGH shown in (b–f). b Sagittal brain view to depict efferent fibers originating from A14 neurons as revealed by light-sheet microscopy. Dashed rectangle identifies the lateral septum (LS), a main extrahypothalamic target of A14 neurons (n = 4 animals). Scale bar = 1 mm. c High-resolution image of A14 projections towards the LS. Scale bar = 0.2 mm. d and e Axonal projections of subtype “1” (anterior) and “2” (posterior) DAT+ neurons to the LS (d) and median eminence (e), respectively. Scale bars = 20 μm. f In situ hybridization for Sst in the LS, combined with the immunohistochemical localization of neuronal projections from virus-infected Dat1+ neurons of the PeVN (n = 4 animals). Scale bar = 10 μm. g In situ hybridization for Sst co-localized with both Drd1-GFP and Drd2-GFP in septal neurons. Scale bar = 10 μm. 3V third ventricle, LS lateral septum, LV lateral ventricle, ME median eminence. We used Biorender to draw the experimental scheme in (a).
Fig. 3
Fig. 3. Subtype “1” Dat1+ neurons in the anterior PeVN innervate the lateral septum.
a Tyrosine hydroxylase (TH) is present in neuronal projections coursing towards the lateral septum (LS). Left: experimental scheme. Right: immunohistochemistry for TH and mCherry in fibers projecting from the PeVN to the LS. Immunohistochemistry was performed for each viral injection (n = 9 independent experiments) with similar results. Scale bar = 10 μm. b TH+/Onecut3+ neurons situated in the PeVN were labeled retrogradely (left) by stereotaxic injections targeting the LS. Onecut3 localization is shown to the right. Immunohistochemistry was performed for each viral injection (n = 3 independent experiments) and yielded similar results. Scale bars = 20 μm. c Experimental scheme for ex vivo electrophysiological circuit mapping e with optogenetic stimulation (d; n = 12 animals). d Periventricular Dat1+ neurons infected with channelrhodopsin-2 (ChR2) generate inward currents upon repetitive light stimulation. e Patch-clamp recordings of neurons in the LS show their activation (11 out of 24 cells) upon light stimulation of ChR2-expressing Dat1+ terminals. f Post-hoc reconstruction of a biocytin-filled neuron responding to optogenetic stimulation e confirmed synaptic innervation by Dat1-Cre+ (mCherry-filled) afferents originating from the PeVN. Scale bar = 50 μm. 3V third ventricle. Biorender assisted us to draw schemes and anatomical structures (in ac).
Fig. 4
Fig. 4. Subtype “1” Dat1+ neurons in the anterior PeVN modulate neuronal activity in the LS.
a Experimental design of virus injections for the ex vivo pharmacogenetic mapping of the PeVN-LS circuitry. b–d CNO stimulation of Dat1+ terminals innervating the LS alters local Ca2+ oscillations. Colored traces (left) show representative examples of Ca2+ recordings at the single-cell level and their sensitivities to dopamine receptor antagonists. Day (sun symbol) and night (moon symbol) correspond to the timing of particular experiments (CT: 06:00–11:00 and 18:00–23:00, respectively). Right: Effect of D1 and D2 dopamine receptor antagonism by SCH23390 and sulpiride, respectively, on CNO-induced Ca2+ oscillations. Data were expressed as means ± s.e.m., with individual values also shown. Two-sided paired t-test was used for statistical analysis; *p < 0.05, **p < 0.01; n indicates the number of cells recorded from for each response type over 7 animals during the day and 3 animals during the night. In b at daytime: D1R inhibition: n = 4 cells, p = 0.0101; D2R inhibition: n = 4 cells, p = 0.1282; at nighttime: D1R inhibition: n = 5 cells, p = 0.0062, D2R inhibition: n = 3 cells, p = 0.668. In c for day recordings: D1R inhibition: n = 4 cells, p = 0.141; D2R inhibition: n = 7 cells, p = 0.0205; for night recordings: D1R inhibition: n = 11 cells, p = 0.915; D2R inhibition: n = 7 cells, p = 0.0306. In d during daytime: D1R inhibition: n = 4 cells, p = 0.1275; D2R inhibition: n = 15 cells, p = 0.0041. e Four neuronal populations were shown to exist in the LS, each responding differently to the chemogenetic activation of Dat1+ inputs from the PeVN. The distribution of functional groups differs during the day vs. night phases with an increased fraction of non-responsive neurons detected during the day. n states the number of independent experiments. f Levels of phospho-Ser-TH at day and night. Scale bar = 20 μm. Data were statistically evaluated by using two-sided unpaired t-test and presented as means ± s.e.m. p = 0.0119 (*p < 0.05); n = 4 animals for CT 09:00 and 5 animals for CT 21:00. 3V third ventricle, PeVN periventricular nucleus, PVN paraventricular nucleus. We used Biorender to visualize an experimental scheme.
Fig. 5
Fig. 5. Dat1+ neurons residing in the PeVN modulate locomotion.
a Chemogenetic stimulation of periventricular Dat1+ neurons led to an increase in locomotor activity during the dark phase (n = 7 animals, CT: 12:00-18:00) when infected with and stimulated by an AAV encoding hM3D(Gq) and subsequent exposure to CNO. One-sided paired t-test was used to assess statistical significance in response to CNO administration. P values at night are 0.0001, 0.016, 0.012, 0.019 for “Distance moved, “Walking duration”, “Wheel running counts” and “Activity”, respectively. b Chemogenetic inhibition of periventricular Dat1+ neurons significant reduced locomotion during both the dark (CT: 12:00–18:00) and light (CT: 00:00–06:00) phases (n = 7 mice). Dat1+ neurons in the PeVN were infected with an AAV encoding hM4D(Gi) and subsequently stimulated with CNO. One-sided paired t-test was used to assess statistical differences in CNO administration. P values are 0.0049, 0.0136, 0.0128, 0.0010 during the day for “Distance moved, “Walking duration”, “Wheel running” and “Activity”, respectively. For the dark period, respective p values for “Walking duration”, “Wheel running counts” and “Activity” are 0.0285, 0.0016, 0.0201. c Combinatorial chemogenetic experiments involving the simultaneous metabotropic activation of Dat1+ neurons in the PeVN and inhibition of LS neurons significantly reduced locomotion (orange rectangles, n = 5) as compared to when only activating Dat1+ neurons (red circles) to compensate for the inhibitory effect of the reduced activity of LS neurons (green triangles, n = 6). during the dark phase (CT: 12:00–18:00). One-way ANOVA with the Student–Newman–Keuls method for pairwise multiple comparisons was used returning p values as 0.004 (**), 0.001 (***). d Schematic illustration of functionally diverse LS neuron pools and their connectivity based on their differential pharmacological responses in Ca2+ imaging experiments. ***p < 0.001; **p < 0.01, *p < 0.05. We used Biorender for the design of experimental schemes and anatomical drawings (in ac).
Fig. 6
Fig. 6. The contribution of Dat1+ neurons of the anterior PeVN to driving amphetamine-induced hyperlocomotion.
a Experimental design that combines amphetamine administration with chemogenetic inhibition of Dat1+ neurons in the PeVN. b Experimental data on locomotor activity (heat map of animal positions in the home cage; distance moved; active time) upon amphetamine administration with/without the chemogenetic inhibition of Dat1+ neurons in PeVN. All results were separated for the day (light phase; CT 00:00–06:00) and night (dark phase; CT: 12:00–18:00). c Amphetamine significantly increased locomotor activity. The coincident chemogenetic inhibition (hM4D(Gi)) of Dat1+ neurons in the PeVN occluded amphetamine-induced hyperlocomotion during the light (passive) phase (n = 7 mice/group). A one-way repeated-measures ANOVA was used to statistically analyze results with the Student–Newman–Keuls post-hoc method for pairwise multiple comparisons. ***p < 0.001; **p < 0.01, *p < 0.05. Statistically, significant p values were listed from left to right. For distance moved, daytime: p = 0.011(*), 0.007 (**); nighttime: p = 0.006 (**) and 0.006 (**). For walking duration, daytime: p = 0.001(***), <0.001 (***); nighttime: p = 0.001 (***) and 0.001 (***). For wheel running, daytime: p = 0.02(*), 0.019 (*); nighttime: p < 0.001 (***) and 0.001 (***). For activity, daytime: p = 0.039 (*), 0.045 (*); nighttime: 0.002 (**). We used Biorender to visualize an experimental scheme.
Fig. 7
Fig. 7. Illustration summarizing and contextualizing the experimental findings.
Biorender assisted with our graphical design.

Similar articles

Cited by

References

    1. Saper CB, Lowell BB. The hypothalamus. Curr. Biol. 2014;24:R1111–R1116. doi: 10.1016/j.cub.2014.10.023. - DOI - PubMed
    1. Krashes MJ, et al. An excitatory paraventricular nucleus to AgRP neuron circuit that drives hunger. Nature. 2014;507:238–242. doi: 10.1038/nature12956. - DOI - PMC - PubMed
    1. Folgueira C, et al. Hypothalamic dopamine signaling regulates brown fat thermogenesis. Nat. Metab. 2019;1:811–829. doi: 10.1038/s42255-019-0099-7. - DOI - PMC - PubMed
    1. Swanson LW, Mogenson GJ. Neural mechanisms for the functional coupling of autonomic, endocrine and somatomotor responses in adaptive behavior. Brain Res. Rev. 1981;3:1–34. doi: 10.1016/0165-0173(81)90010-2. - DOI - PubMed
    1. Stagkourakis S, et al. A neuro-hormonal circuit for paternal behavior controlled by a hypothalamic network oscillation. Cell. 2020;182:960–975.e915. doi: 10.1016/j.cell.2020.07.007. - DOI - PMC - PubMed

Publication types