. 2022 Oct 8;20(1):442.
doi: 10.1186/s12951-022-01647-8.

Intracellular mRNA phase separation induced by cationic polymers for tumor immunotherapy

Affiliations

Intracellular mRNA phase separation induced by cationic polymers for tumor immunotherapy

Zhen Xing et al. J Nanobiotechnology. .

Abstract

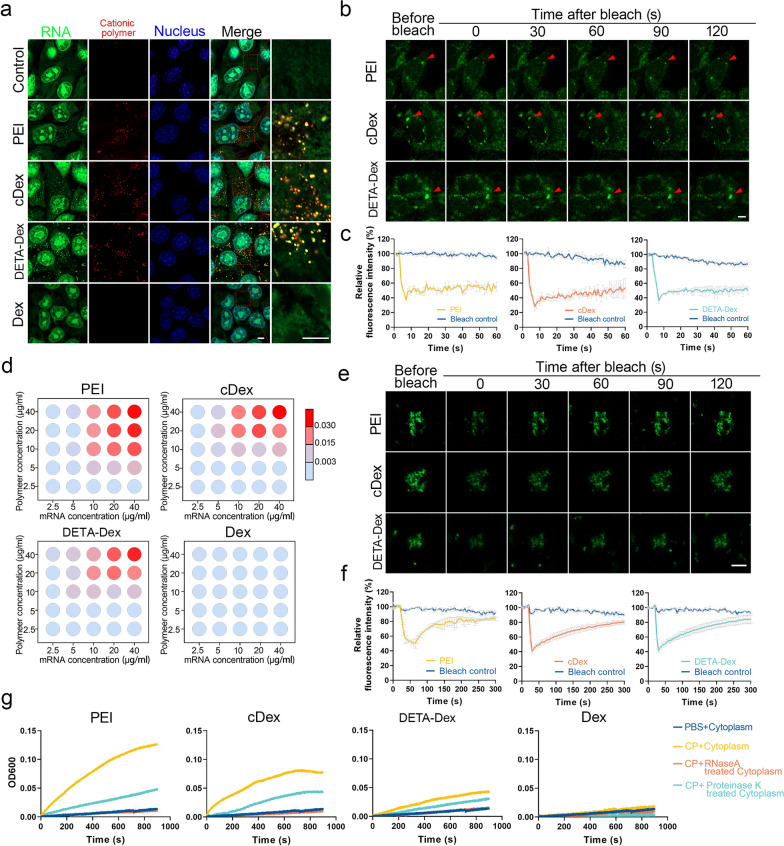
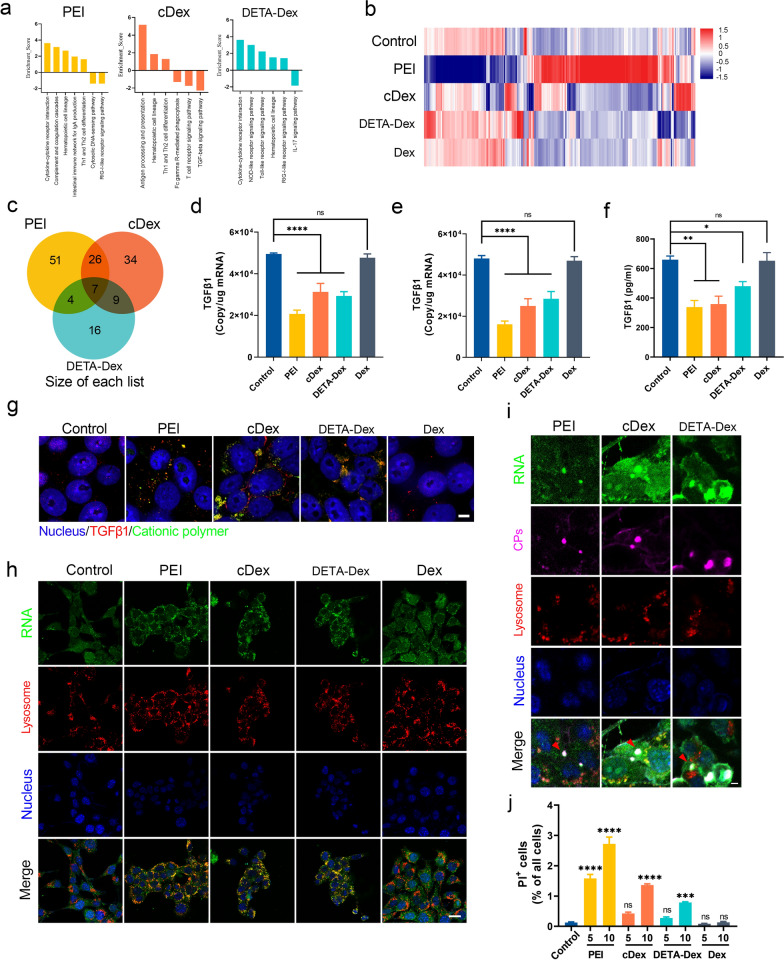
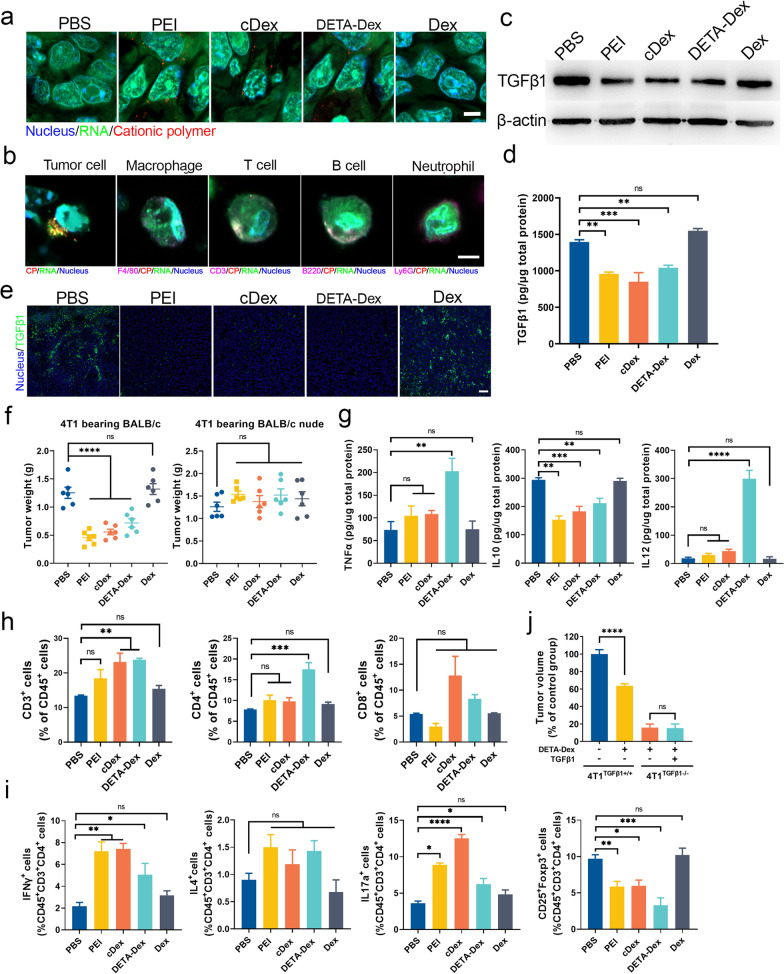
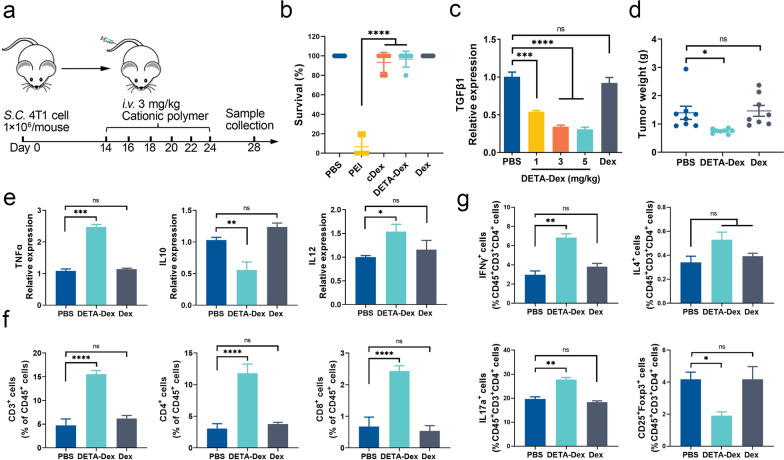
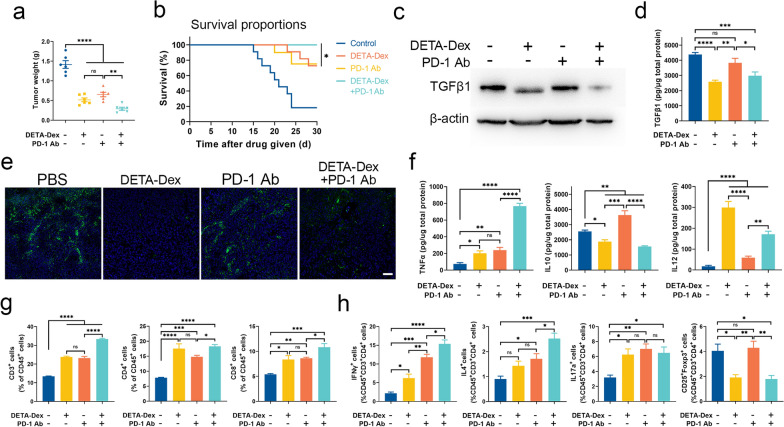
The formation of biomolecular condensates via liquid‒liquid phase separation (LLPS) is an advantageous strategy for cells to organize their subcellular compartments for diverse functions. Recent findings suggest that RNA or RNA-related LLPS techniques have potential for the development of new cellular regulation strategies. However, manipulating RNA LLPS in living cells has great challenges. Herein, we report that cationic polymers (CPs) have strong RNA LLPS-inducing activity. By introducing CPs into living cells or RNA solutions, significant RNA LLPS was verified through confocal imaging, turbidity assays, and fluorescence recovery after photobleaching (FRAP) tests. Among them, turbidity kinetics determinations indicated that the hydrophilic positively charged amino groups on the CPs play essential roles in RNA phase separation. Moreover, the LLPS induced by the cationic polymers dramatically changed the gene expression patterns in the cells. Interestingly, we found that TGFβ1 mRNA was highly encapsulated in the RNA droplets, which lowered the immunosuppressive capability of the tumor cells and triggered marked antitumor reactions in a mouse breast cancer model. Thus, we present here the CP-based modulation of RNA LLPS as a novel transcriptional manipulation method with potential for cancer immunotherapy drug development.

Keywords: Cationic polymers; Immunotherapy; TGFβ1; Tumor microenvironment; mRNA phase separation.


Conflict of interest statement

The authors declare that they have no competing interests.

Figures

Fig. 1
Fig. 1
RNA LLPS induced by CPs. a Representative images of RNA droplets in 4T1 cells stained by SYTO RNAselect Green after treatment with different CPs. The CPs were labeled by Cy5. Scale bar, 5 μm. b Representative images of the FRAP experiment with Cy5-tagged CPs and SYTO RNAselect Green-stained RNA in 4T1 cells. Scale bar, 5 μm. c Quantification of the FRAP data (means ± SEMs, n = 3 experiments) of RNA droplets in 4T1 cells. d Phase diagrams of the CPs with concentrations ranging from 2.5 to 40 μg/ml in PBS (pH 7.0) and mRNA from 4T1 cells (ranging from 2.5 to 40 μg/ml). RNA was incubated with CPs in phase separation buffer at 37 °C for 30 min. Light dots, no phase separation; chromatic dots, phase separation. Phase separation was quantified by turbidity measurements at OD600. e Representative images of the FRAP experiment with Cy5-tagged CPs and SYTO RNAselect Green-tagged RNA in PBS solution. Scale bar, 5 μm. f Quantification analysis of the FRAP data (means ± SEMs, n = 3 experiments) in (e). g Kinetic analysis of the turbidity at OD600 in 4T1 cell cytoplasm with RNase or protease treatment before mixing with different CP solutions. 4T1 cell cytoplasm extract was treated with RNase A (20 μg/ml) at 37 °C and proteinase K (50 μg/ml) at 37 °C for 30 min
Fig. 2
Fig. 2
Cellular responses to RNA LLPS in CP-treated 4T1 cells. a Signaling pathways (KEGG) related to tumor immunity based on RNA-seq analysis of CP-treated 4T1 cells. b Heatmap of genome-wide RNA-seq profiling of 4T1 cells 24 h after CP treatment. c Venn diagram illustrating the number of tumor immunity-related genes significantly downregulated in CP-treated 4T1 cells. d Copy number of TGFβ1 mRNA transcripts in 4T1 cells after 6 h pf CP treatment and e 30 min of CP treatment. f ELISA measurements of TGFβ1 in CP-treated 4T1 cell culture medium. g Fluorescence in situ hybridization analysis showing TGFβ1 mRNA colocalization with the CPs in 4T1 cells. Scale bar, 5 μm. h Representative double-staining RNA droplet images with lysosomes in 4T1 cells after 4 h of CP treatment and i 15 min of CP treatment. Scale bar, 5 μm. j The signal intensity of PI fluorescence for 4T1 cells after incubation with cationic polymers (Polymer concentration, μg/ml). Data are expressed as the mean ± SEM, and the differences between experimental groups were analyzed by one-way ANOVA with Dunnett’s test (d–f and j). ∗p < 0.05, ∗∗p < 0.01, ∗∗∗p < 0.001, ∗∗∗∗p < 0.0001
Fig. 3
Fig. 3
RNA LLPS, TGFβ1 downregulation, and antitumor immune activation in 4T1 tumor models after intratumoral CP administration. Mice bearing 4T1 tumors were intratumorally injected with the CPs (3 mg/kg body weight; dextran was used as a control reagent) 14 days before the mice were sacrificed, and the tissues were analyzed accordingly. a Representative confocal images of RNA droplets in tumor sections stained with SYTO RNAselect Green (scale bar, 5 μm). b Tumor cells and different leukocytes isolated from 4T1 tumor tissues were analyzed for RNA droplets marked by SYTO RNAselect Green (scale bar, 5 μm). c Western blot analysis of TGFβ1 in the tumor tissues after CP treatment. d ELISA analysis of TGF-β1 in tumor tissues after CP treatment. e Immunofluorescent staining of TGFβ1 in tumor tissue sections (scale bar, 50 μm). f Mean mouse tumor weights 14 days after the first CP treatment. g ELISAs of TNFα, IL10, and IL12; h the frequency of CD3+ T cells, CD4+ T cells, and CD8+ T cells; and i the frequency of Th1 cells, Th2 cells, Th17 cells, and Treg cells in the tumor tissues harvested from the same experiment as (f). j Evaluation of the antitumor activity of the CPs in the TGFβ1 knockout 4T1 cell animal model. Tumor size was normalized based on untreated 4T1TGFβ1+/+ cell-bearing mice, n = 10 per group. Data are expressed as the mean ± SEM, and the differences between experimental groups were analyzed by two-way ANOVA with Sidak’s multiple comparisons test (i) and one-way ANOVA with Dunnett’s test (d, fh and j). ∗p < 0.05, ∗∗p < 0.01, ∗∗∗p < 0.001, ∗∗∗∗p < 0.0001
Fig. 4
Fig. 4
Antitumor activity of CPs after i.v. injection. a Schematic diagram of the experiment, n = 10 per group. b Acute toxicity test of the CPs. Different CPs were administered to the mice at 5 mg/kg via i.v. injection, and the survival rates were recorded 30 min after administration. The experiment was repeated three times, n = 5 per group. c The TGF-β1 mRNA level was measured by qPCR in the tumor tissues after DETA-Dex treatment. d Mean tumor weights in the model animals 14 days after the first DETA-Dex treatment (3 mg/kg body weight). e The mRNA levels of TNFα, IL10, and IL12, f the frequencies of CD3+ T cells, CD4+ T cells, and CD8+ T cells, and g the frequencies of Th1 cells, Th2 cells, Th17 cells, and Treg cells in the tumor tissues harvested from the same experiment in (d). Data are expressed as the mean ± SEM, and the differences between experimental groups were analyzed by two-way ANOVA with Sidak’s multiple comparisons test (b, d, eg) and one-way ANOVA with Dunnett’s test (c). ∗p < 0.05, ∗∗p < 0.01, ∗∗∗p < 0.001, ∗∗∗∗p < 0.0001
Fig. 5
Fig. 5
DETA-Dex enhanced PD-1 immunotherapy efficacy. DETA-Dex (3 mg/kg BW) and a PD-1 inhibitor (Bioxcell, #BE0146, 5 mg/kg BW) were intratumorally coinjected into 4T1 model mice every 2 days; each mouse received 6 injections before sacrifice. a Mean weights of the tumors harvested on Day 14 after the first treatment. b Survival of tumor-bearing mice after the indicated treatments, n = 10 per group. c Western blot analysis of TGFβ1 in tumor tissues; d ELISA of TGF-β1; e immunofluorescent staining of TGFβ1 in the tumor tissue sections (scale bar, 50 μm); f ELISAs of TNFα, IL10, IL12; g the frequencies of CD3+ T cells, CD4+ T cells and CD8+ T cells; and h the frequencies of Th1 cells, Th2 cells, Th17 cells and Treg cells in tumor tissues from the same experiment in (a). Data are expressed as the mean ± SEM, and the differences between experimental groups were analyzed by two-way ANOVA with Sidak’s multiple comparisons tests (b) and one-way ANOVA with Dunnett’s test (a, d, f–h); ∗p < 0.05, ∗∗p < 0.01, ∗∗∗p < 0.001, ∗∗∗∗p < 0.0001

Similar articles

Cited by

References

    1. Yang PG, Mathieu C, Kolaitis RM, Zhang PP, Messing J, Yurtsever U, Yang ZM, Wu JJ, Li YX, Pan QF, et al. G3BP1 is a tunable switch that triggers phase separation to assemble stress granules. Cell. 2020;181:325. doi: 10.1016/j.cell.2020.03.046. - DOI - PMC - PubMed
    1. Wu XD, Cai QX, Feng Z, Zhang MJ. Liquid–liquid phase separation in neuronal development and synaptic signaling. Dev Cell. 2020;55:18–29. doi: 10.1016/j.devcel.2020.06.012. - DOI - PubMed
    1. Alberti S, Carra S. Quality control of membraneless organelles. J Mol Biol. 2018;430:4711–4729. doi: 10.1016/j.jmb.2018.05.013. - DOI - PubMed
    1. Shin Y, Brangwynne CP. Liquid phase condensation in cell physiology and disease. Science. 2017 doi: 10.1126/science.aaf4382. - DOI - PubMed
    1. Alberti S, Gladfelter A, Mittag T. Considerations and challenges in studying liquid–liquid phase separation and biomolecular condensates. Cell. 2019;176:419–434. doi: 10.1016/j.cell.2018.12.035. - DOI - PMC - PubMed