

Trends in non-COVID-19 hospitalizations prior to and during the COVID-19 pandemic period, United States, 2017-2021
- PMID: 36209210
- PMCID: PMC9546751
- DOI: 10.1038/s41467-022-33686-y
Trends in non-COVID-19 hospitalizations prior to and during the COVID-19 pandemic period, United States, 2017-2021
Abstract
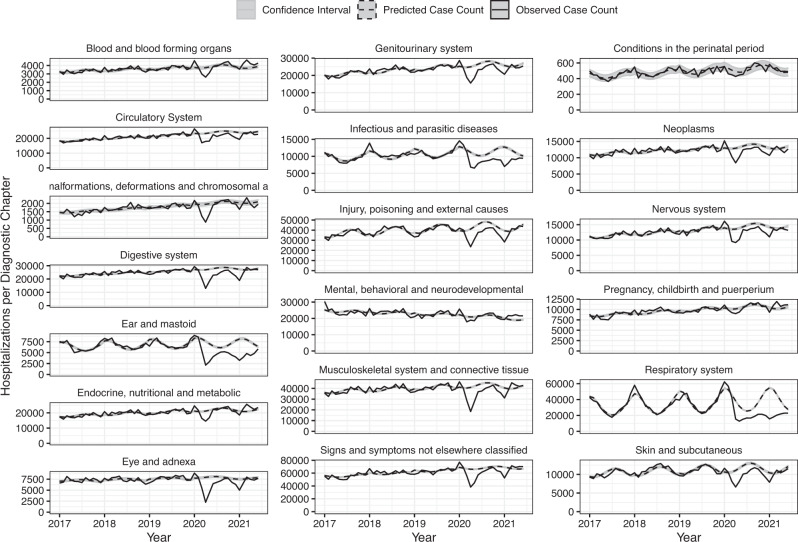
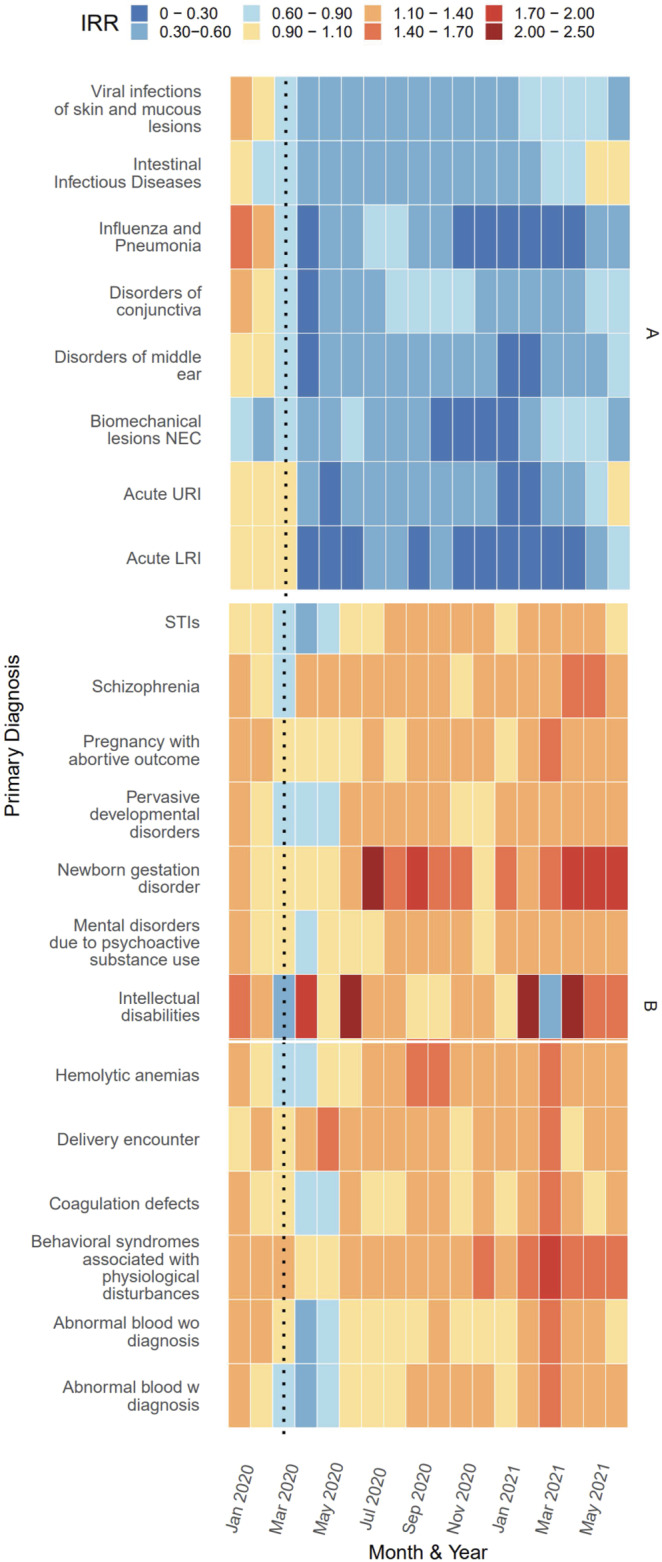
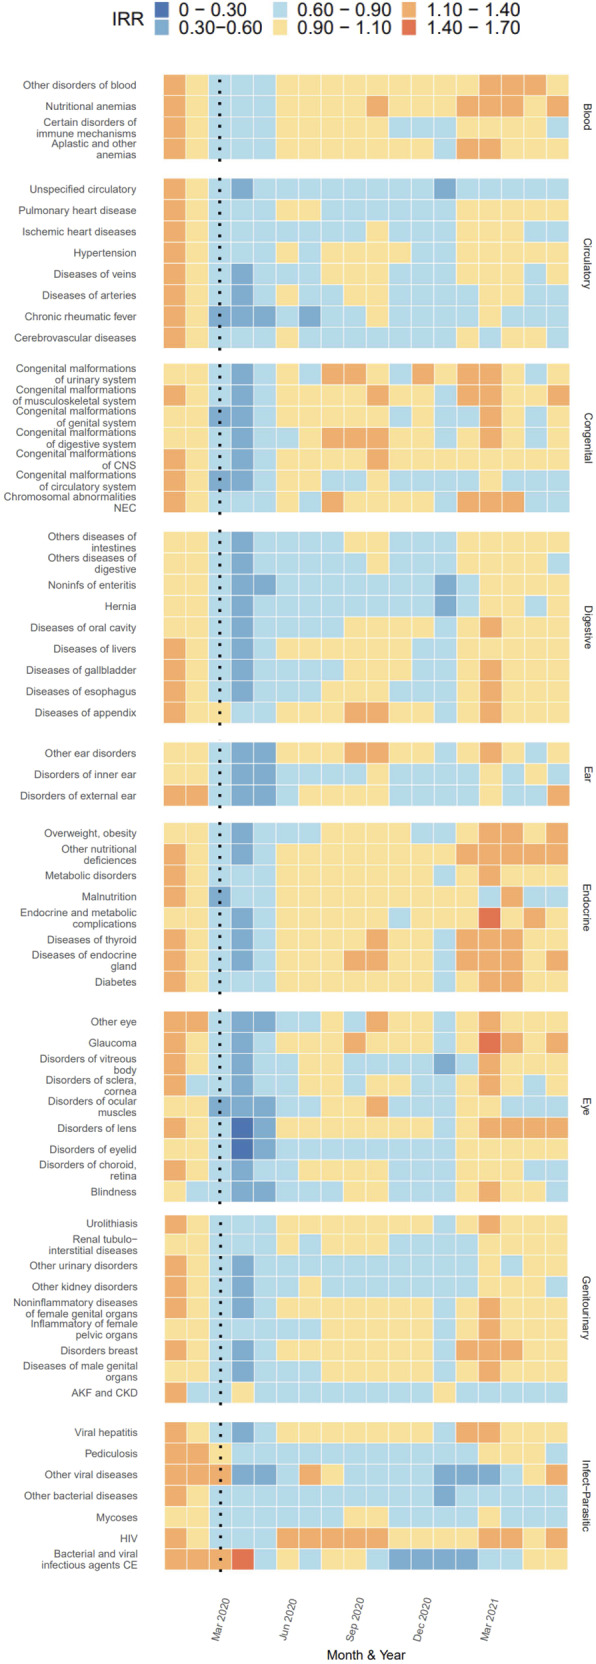
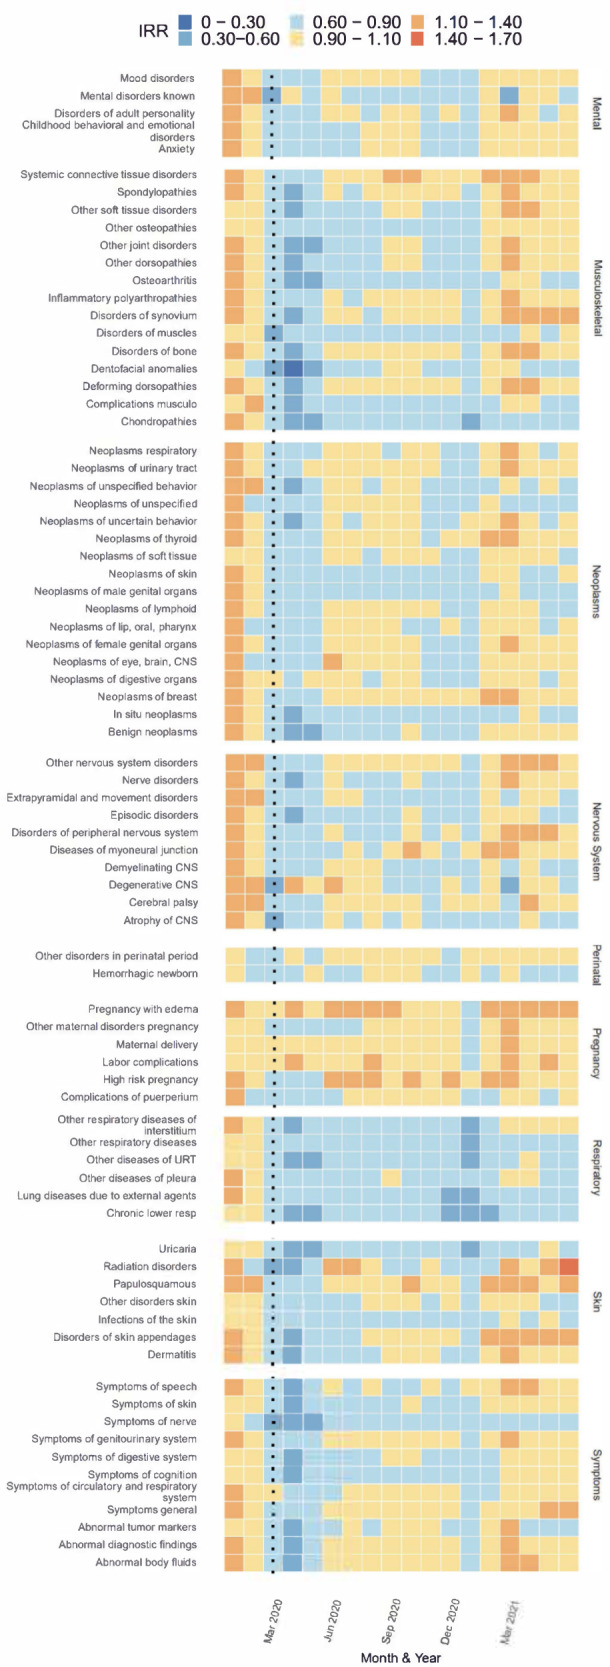
COVID-19 pandemic-related shifts in healthcare utilization, in combination with trends in non-COVID-19 disease transmission and non-pharmaceutical intervention use, had clear impacts on rates of hospitalization for infectious and chronic diseases. Using a U.S. national healthcare billing database, we estimated the monthly incidence rate ratio of hospitalizations between March 2020 and June 2021 according to 19 ICD-10 diagnostic chapters and 189 subchapters. The majority of primary diagnoses for hospitalization showed an immediate decline in incidence during March 2020. Hospitalizations for reproductive neoplasms, hypertension, and diabetes returned to pre-pandemic levels during late 2020 and early 2021, while others, like those for infectious respiratory disease, did not return to pre-pandemic levels during this period. Our assessment of subchapter-level primary hospitalization codes offers insight into trends among less frequent causes of hospitalization during the COVID-19 pandemic in the U.S.
© 2022. The Author(s).
Conflict of interest statement
D.M.W. has received consulting fees for work unrelated to this manuscript from Pfizer, Merck, GSK, Affinivax, and Matrivax, and is Principal Investigator on research grants from Pfizer and Merck to Yale University for work unrelated to this manuscript. S.B. is Principal Investigator on a research grant from Merck to Georgetown University. The remaining authors declare no competing interests.
Figures
Update of
-
Trends in non-COVID-19 hospitalizations prior to and during the COVID-19 pandemic period, United States, 2017 – 2021.medRxiv [Preprint]. 2022 Apr 28:2022.04.26.22274301. doi: 10.1101/2022.04.26.22274301. medRxiv. 2022. Update in: Nat Commun. 2022 Oct 8;13(1):5930. doi: 10.1038/s41467-022-33686-y. PMID: 35547844 Free PMC article. Updated. Preprint.
References
-
- Heist T., Schwartz K. & Butler S. How were hospital admissions impacted by COVID-19? Trends in overall and non-COVID-19 hospital admissions through August 8, 2020. KFF. 2020 [cited 2021 Nov 17]. Available from: https://www.kff.org/report-section/how-were-hospital-admissions-impacted...
-
- Nguyen J. L. et al. Pandemic-related declines in hospitalization for non-COVID-19-related illness in the United States from January through July 2020. PLOS ONE. 2022 Jan 6 [cited 2022 Feb 1];17(1):e0262347. Available from: https://journals.plos.org/plosone/article?id=10.1371/journal.pone.0262347 - PMC - PubMed
-
- Czeisler MÉ. Delay or avoidance of medical care because of COVID-19–related concerns—United States, June 2020. MMWR Morb. Mortal. Wkly. Rep. 2020 [cited 2021 Sep 28];69. Available from: https://www.cdc.gov/mmwr/volumes/69/wr/mm6936a4.htm - PMC - PubMed
-
- Park K. H., Kim A. R., Yang M. A., Lim S. J. & Park J. H. Impact of the COVID-19 pandemic on the lifestyle, mental health, and quality of life of adults in South Korea. PLOS ONE. 2021 Feb 26 [cited 2022 Feb 3];16(2):e0247970. Available from: https://journals.plos.org/plosone/article?id=10.1371/journal.pone.0247970 - PMC - PubMed
-
- Zhang J. People’s responses to the COVID-19 pandemic during its early stages and factors affecting those responses. Humanit. Soc. Sci. Commun. 2021 Feb 3 [cited 2022 Feb 3];8(1):1–13. Available from: https://www.nature.com/articles/s41599-021-00720-1
Publication types
MeSH terms
Grants and funding
LinkOut - more resources
Full Text Sources
Medical
