

The hallmarks of dietary intervention-resilient gut microbiome
- PMID: 36209276
- PMCID: PMC9547895
- DOI: 10.1038/s41522-022-00342-8
The hallmarks of dietary intervention-resilient gut microbiome
Abstract
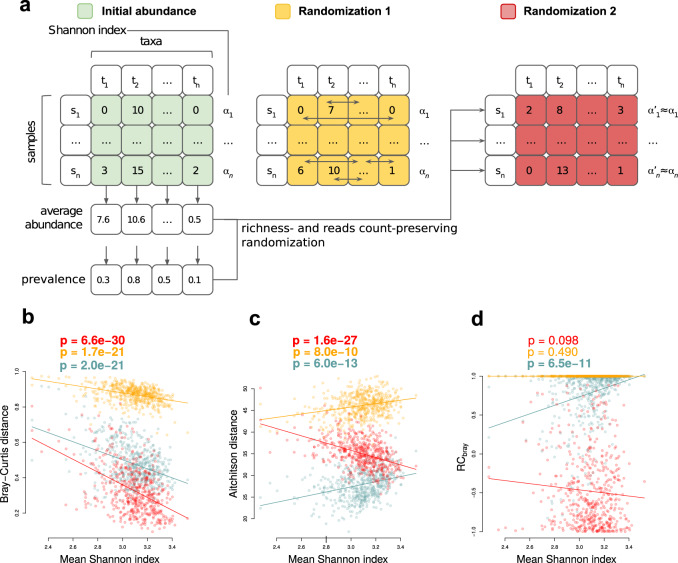
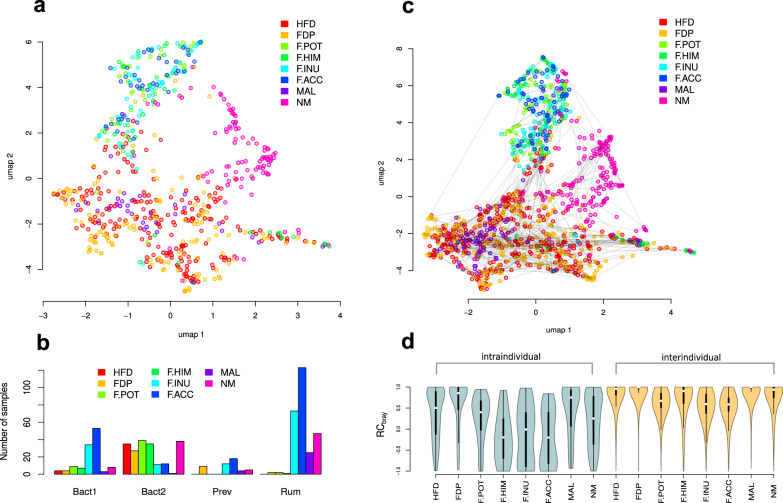
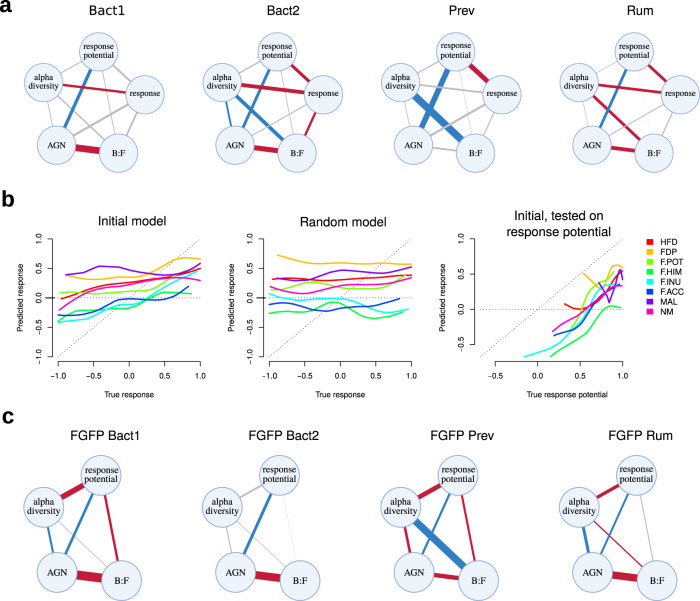
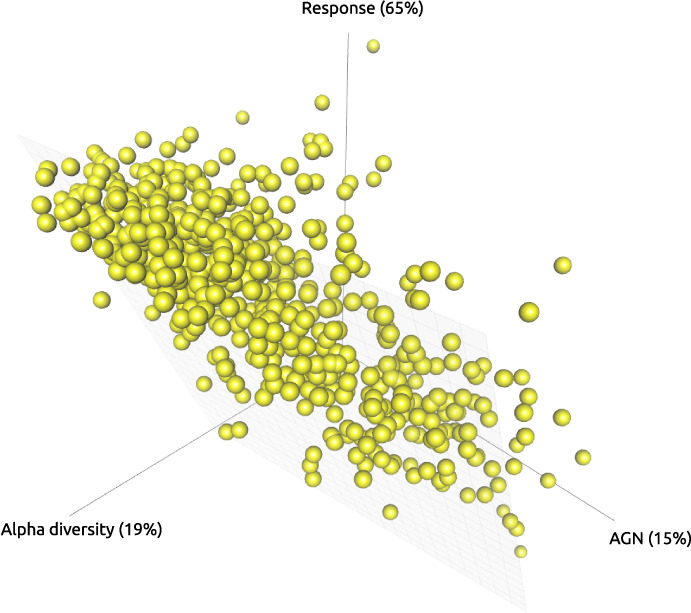
Maintaining equilibrium of the gut microbiome is crucial for human health. Diet represents an important and generally accessible natural channel of controlling the nutrients supply to the intestinal microorganisms. Although many studies showed that dietary interventions can specifically modulate gut microbiome composition, further progress of the approach is complicated by interindividual variability of the microbial community response. The reported causes of this variability include the baseline microbiome composition features, but it is unclear whether any of them are intervention-specific. Here, we applied a unified computational framework to investigate the variability of microbiome response measured as beta diversity in eight various dietary interventions using previously published 16S rRNA sequencing datasets. We revealed a number of baseline microbiome features which determine the microbiome response in an intervention-independent manner. One of the most stable associations, reproducible for different interventions and enterotypes, was a negative dependence of the response on the average number of genes per microorganism in the community-an indicator of the community functional redundancy. Meanwhile, many revealed microbiome response determinants were enterotype-specific. In Bact1 and Rum enterotypes, the response was negatively correlated with the baseline abundance of their main drivers. Additionally, we proposed a method for preliminary assessment of the microbiome response. Our study delineats the universal features determining microbiome response to diverse interventions. The proposed approach is promising for understanding the mechanisms of gut microbiome stability and improving the efficacy of personalised microbiome-tailored interventions.
© 2022. The Author(s).
Conflict of interest statement
The authors declare no competing interests.
Figures

Similar articles
-
The Core Gut Microbiome of the American Cockroach, Periplaneta americana, Is Stable and Resilient to Dietary Shifts.Appl Environ Microbiol. 2016 Oct 27;82(22):6603-6610. doi: 10.1128/AEM.01837-16. Print 2016 Nov 15. Appl Environ Microbiol. 2016. PMID: 27590811 Free PMC article.
-
Diversity and enterotype in gut bacterial community of adults in Taiwan.BMC Genomics. 2017 Jan 25;18(Suppl 1):932. doi: 10.1186/s12864-016-3261-6. BMC Genomics. 2017. PMID: 28198673 Free PMC article.
-
Age-based dynamic changes of phylogenetic composition and interaction networks of health pig gut microbiome feeding in a uniformed condition.BMC Vet Res. 2019 May 24;15(1):172. doi: 10.1186/s12917-019-1918-5. BMC Vet Res. 2019. PMID: 31126262 Free PMC article.
-
Effect of fructans, prebiotics and fibres on the human gut microbiome assessed by 16S rRNA-based approaches: a review.Benef Microbes. 2020 Mar 27;11(2):101-129. doi: 10.3920/BM2019.0082. Epub 2020 Feb 19. Benef Microbes. 2020. PMID: 32073295 Review.
-
Gut microbiome stability and resilience: elucidating the response to perturbations in order to modulate gut health.Gut. 2021 Mar;70(3):595-605. doi: 10.1136/gutjnl-2020-321747. Epub 2020 Oct 13. Gut. 2021. PMID: 33051190 Review.
Cited by
-
Decision Tree Ensembles Utilizing Multivariate Splits Are Effective at Investigating Beta Diversity in Medically Relevant 16S Amplicon Sequencing Data.Microbiol Spectr. 2023 Mar 6;11(2):e0206522. doi: 10.1128/spectrum.02065-22. Online ahead of print. Microbiol Spectr. 2023. PMID: 36877086 Free PMC article.
-
Cluster-specific associations between the gut microbiota and behavioral outcomes in preschool-aged children.Microbiome. 2024 Mar 21;12(1):60. doi: 10.1186/s40168-024-01773-5. Microbiome. 2024. PMID: 38515179 Free PMC article.
-
Agrarian Diet Improves Metabolic Health in HIV-positive Men with Prevotella-Rich Microbiomes: Results from a Randomized Trial.Res Sq [Preprint]. 2024 Nov 15:rs.3.rs-5349309. doi: 10.21203/rs.3.rs-5349309/v1. Res Sq. 2024. PMID: 39606458 Free PMC article. Preprint.
-
Gut physiology meets microbiome science.Gut Microbiome (Camb). 2022 Dec 12;4:e1. doi: 10.1017/gmb.2022.10. eCollection 2023. Gut Microbiome (Camb). 2022. PMID: 39295899 Free PMC article. Review.
-
Precision Nutrition Unveiled: Gene-Nutrient Interactions, Microbiota Dynamics, and Lifestyle Factors in Obesity Management.Nutrients. 2024 Feb 20;16(5):581. doi: 10.3390/nu16050581. Nutrients. 2024. PMID: 38474710 Free PMC article. Review.
References
Publication types
MeSH terms
Substances
LinkOut - more resources
Full Text Sources
