

Multi-Omic analyses characterize the ceramide/sphingomyelin pathway as a therapeutic target in Alzheimer's disease
- PMID: 36209301
- PMCID: PMC9547905
- DOI: 10.1038/s42003-022-04011-6
Multi-Omic analyses characterize the ceramide/sphingomyelin pathway as a therapeutic target in Alzheimer's disease
Abstract
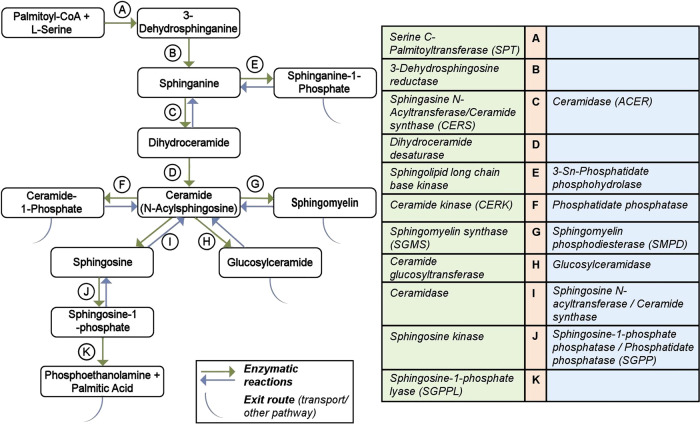
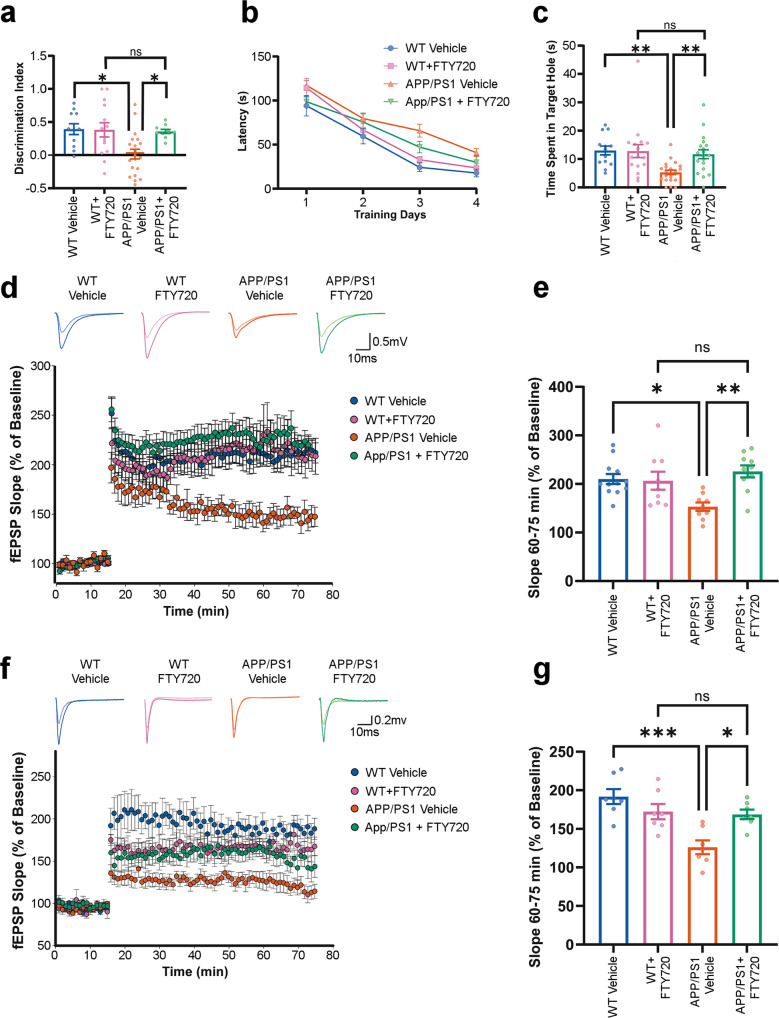
Dysregulation of sphingomyelin and ceramide metabolism have been implicated in Alzheimer's disease. Genome-wide and transcriptome-wide association studies have identified various genes and genetic variants in lipid metabolism that are associated with Alzheimer's disease. However, the molecular mechanisms of sphingomyelin and ceramide disruption remain to be determined. We focus on the sphingolipid pathway and carry out multi-omics analyses to identify central and peripheral metabolic changes in Alzheimer's patients, correlating them to imaging features. Our multi-omics approach is based on (a) 2114 human post-mortem brain transcriptomics to identify differentially expressed genes; (b) in silico metabolic flux analysis on context-specific metabolic networks identified differential reaction fluxes; (c) multimodal neuroimaging analysis on 1576 participants to associate genetic variants in sphingomyelin pathway with Alzheimer's disease pathogenesis; (d) plasma metabolomic and lipidomic analysis to identify associations of lipid species with dysregulation in Alzheimer's; and (e) metabolite genome-wide association studies to define receptors within the pathway as a potential drug target. We validate our hypothesis in amyloidogenic APP/PS1 mice and show prolonged exposure to fingolimod alleviated synaptic plasticity and cognitive impairment in mice. Our integrative multi-omics approach identifies potential targets in the sphingomyelin pathway and suggests modulators of S1P metabolism as possible candidates for Alzheimer's disease treatment.
© 2022. The Author(s).
Conflict of interest statement
The authors declare the following competing interests: R.K.D. is an inventor of key patents in the field of Metabolomics and holds equity in Metabolon, a biotech company in North Carolina. In addition, she holds patents licensed to Chymia LLC and PsyProtix with royalties and ownership. M.A. and G.K. are co-inventors (through their institutions) on patents on applications of metabolomics in diseases of the central nervous system. M.A. and G.K. hold equity in Chymia LLC and IP in PsyProtix and Atai which is unrelated to this work). P.M.D. has received research grants from the National Institute on Aging, DARPA, DOD, ONR, Salix, Avanir, Avid, Cure Alzheimer’s Fund, Karen L. Wrenn Trust, Steve Aoki Foundation, and advisory/board fees from Apollo, Brain Forum, Clearview, Lumos, Neuroglee, Otsuka, Verily, Vitakey, Sermo, Lilly, Nutricia, Alzheon, and Transposon. P.M.D. is a co-inventor on patents for the diagnosis or treatment of dementia. P.M.D. owns shares/options in Evidation, Marvel Biome, UMethod, Transposon, and Alzheon. A.J.S. has received support from Avid Radiopharmaceuticals, a subsidiary of Eli Lilly (in kind contribution of PET tracer precursor); Bayer Oncology (Scientific Advisory Board); Eisai (Scientific Advisory Board); Siemens Medical Solutions USA, Inc. (Dementia Advisory Board); NIH NHLBI (MESA Observational Study Monitoring Board); Springer-Nature Publishing (Editorial Office Support as Editor-in-Chief, Brain Imaging and Behavior). The remaining authors declare no competing interests.
Figures
References
Publication types
MeSH terms
Substances
Grants and funding
- U01 AG061356/AG/NIA NIH HHS/United States
- U01 AG024904/AG/NIA NIH HHS/United States
- U01 AG068057/AG/NIA NIH HHS/United States
- P30 AG010161/AG/NIA NIH HHS/United States
- AG069901/U.S. Department of Health & Human Services | National Institutes of Health (NIH)
- T32 AG071444/AG/NIA NIH HHS/United States
- R01 AG046171/AG/NIA NIH HHS/United States
- U01 AG046152/AG/NIA NIH HHS/United States
- AG057452/U.S. Department of Health & Human Services | National Institutes of Health (NIH)
- R01 AG019771/AG/NIA NIH HHS/United States
- U01 AG072177/AG/NIA NIH HHS/United States
- P30 AG010133/AG/NIA NIH HHS/United States
- R03 AG054936/AG/NIA NIH HHS/United States
- R01 AG069901/AG/NIA NIH HHS/United States
- R01 AG017917/AG/NIA NIH HHS/United States
- U19 AG024904/AG/NIA NIH HHS/United States
- AG058942/U.S. Department of Health & Human Services | National Institutes of Health (NIH)
- RF1 AG059093/AG/NIA NIH HHS/United States
- U01 AG046139/AG/NIA NIH HHS/United States
- R01 AG057739/AG/NIA NIH HHS/United States
- U01 AG061359/AG/NIA NIH HHS/United States
- RF1 AG061872/AG/NIA NIH HHS/United States
- R01 AG068193/AG/NIA NIH HHS/United States
- R01 LM012535/LM/NLM NIH HHS/United States
- R01 AG062514/AG/NIA NIH HHS/United States
- RF1 AG057452/AG/NIA NIH HHS/United States
- P30 AG072976/AG/NIA NIH HHS/United States
- RF1 AG058942/AG/NIA NIH HHS/United States
- RF1 AG051550/AG/NIA NIH HHS/United States
- R01 LM013463/LM/NLM NIH HHS/United States
- R01 AG015819/AG/NIA NIH HHS/United States
LinkOut - more resources
Full Text Sources
Other Literature Sources
Medical
