. 2022 Nov;298(11):102530.
doi: 10.1016/j.jbc.2022.102530. Epub 2022 Oct 7.

The role of FXR and TGR5 in reversing and preventing progression of Western diet-induced hepatic steatosis, inflammation, and fibrosis in mice

Affiliations

The role of FXR and TGR5 in reversing and preventing progression of Western diet-induced hepatic steatosis, inflammation, and fibrosis in mice

Xiaoxin X Wang et al. J Biol Chem. 2022 Nov.

Abstract

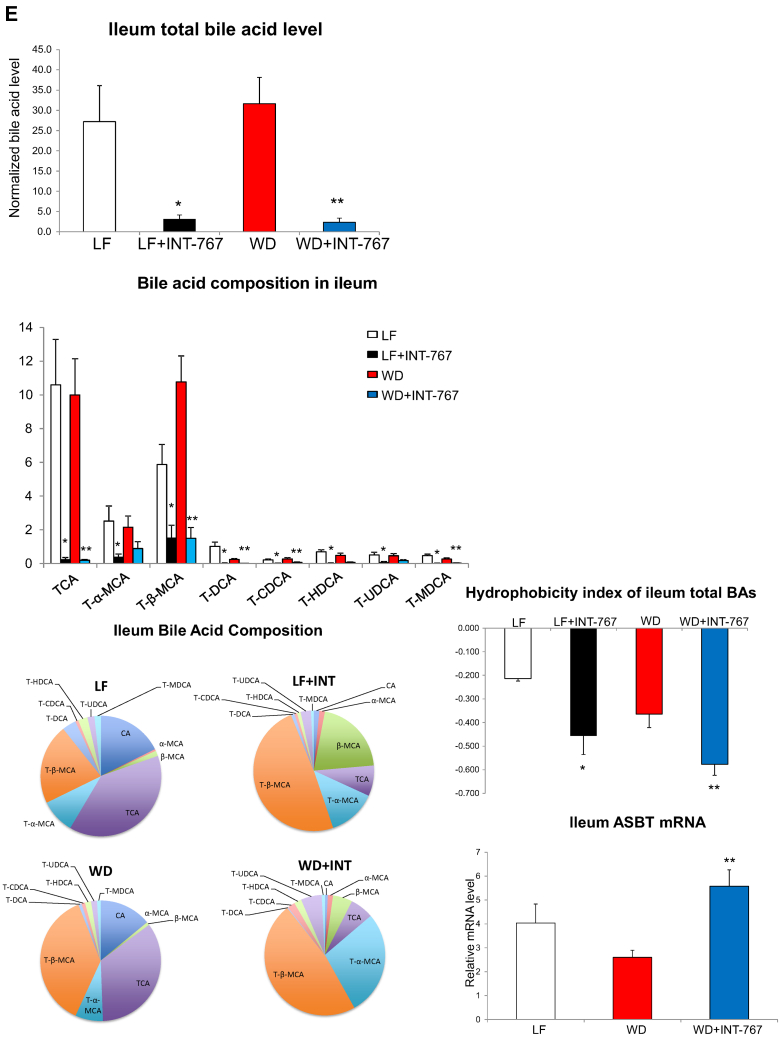
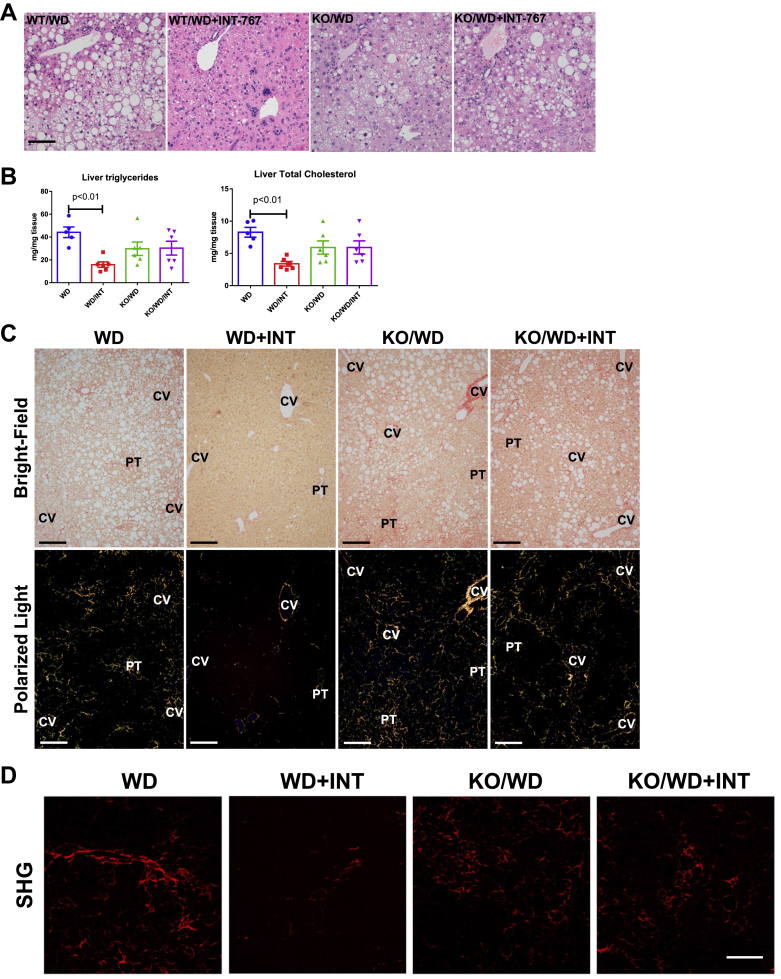
Nonalcoholic steatohepatitis (NASH) is the most common chronic liver disease in the US, partly due to the increasing incidence of metabolic syndrome, obesity, and type 2 diabetes. The roles of bile acids and their receptors, such as the nuclear receptor farnesoid X receptor (FXR) and the G protein-coupled receptor TGR5, on the development of NASH are not fully clear. C57BL/6J male mice fed a Western diet (WD) develop characteristics of NASH, allowing determination of the effects of FXR and TGR5 agonists on this disease. Here we show that the FXR-TGR5 dual agonist INT-767 prevents progression of WD-induced hepatic steatosis, inflammation, and fibrosis, as determined by histological and biochemical assays and novel label-free microscopy imaging techniques, including third harmonic generation, second harmonic generation, and fluorescence lifetime imaging microscopy. Furthermore, we show INT-767 decreases liver fatty acid synthesis and fatty acid and cholesterol uptake, as well as liver inflammation. INT-767 markedly changed bile acid composition in the liver and intestine, leading to notable decreases in the hydrophobicity index of bile acids, known to limit cholesterol and lipid absorption. In addition, INT-767 upregulated expression of liver p-AMPK, SIRT1, PGC-1α, and SIRT3, which are master regulators of mitochondrial function. Finally, we found INT-767 treatment reduced WD-induced dysbiosis of gut microbiota. Interestingly, the effects of INT-767 in attenuating NASH were absent in FXR-null mice, but still present in TGR5-null mice. Our findings support treatment and prevention protocols with the dual FXR-TGR5 agonist INT-767 arrest progression of WD-induced NASH in mice mediated by FXR-dependent, TGR5-independent mechanisms.

Keywords: FXR-TGR5; NASH; bile acid; fibrosis; inflammation; lipid metabolism.


Conflict of interest statement

Conflict of interest Dr Luciano Adorini is an employee of Intercept. These studies were in part supported by a medical school Investigator Initiated Study (IIS) grant to Moshe Levi. The authors otherwise have no other conflict of interest.

Figures

Figure 1
Figure 1
INT-767 regulates FXR target genes in the liver and regulates both FXR and TGR5 target genes in the ileum.A, INT-767 decreases liver Cyp7a1 and Cyp8b1 mRNA expression and increases liver Shp and Bsep mRNA expression. B, INT-767 increases the mRNA expression of FXR targets in the ileum: Fgf15, and Shp and C, TGR5 target genes in the ileum, Gcg mRNA. N = 6 mice. ∗ = p < 0.05 WD versus LF; ∗∗p < 0.05 WD + INT-767 versus WD. FXR, farnesoid X receptor; LF, low-fat control diet; WD, Western diet.
Figure 2
Figure 2
INT-767 prevents WD-induced steatosis, triglyceride, and cholesterol accumulation in the liver.A, steatosis as shown by H&E staining and liver injury scoring in mice on WD for 3 months compared to those on control low fat diet. BD, steatosis as determined by (B) H&E stain, (C) perilipin-2 (PLIN2) immunohistochemistry for lipid droplets, (D) label-free imaging with fluorescence lifetime imaging microscopy (FLIM), and third harmonic generation (THG) microscopy. The red areas in FLIM images show the lipid droplets identified by the long lifetime in FLIM images and their boundaries can be seen in THG images. The histogram shows the changes in the droplet sizes calculated from FLIM data. The p-value on the histogram: p < 0.0001 LF versus WD and WD versus WD+INT-767. E, triglyceride content as determined by GC-MS. F and G, mediators of fatty acid synthesis; SREBP-1c, SCD1, ChREBP-α, and ChREBP-β with mRNA levels as determined by RT-qPCR. G, mediators of fatty acid uptake; Cd36 and Fabp1 with mRNA levels as determined by RT-qPCR. H, liver cholesterol ester content as determined by GC-MS. I and J, a mediator of cholesterol uptake, LOX-1, mediators of cholesterol synthesis, including SREBP-2 and HMG-CoA reductase, and mediator of cholesterol efflux including ABCG5 and ABCG8 mRNA levels are shown, as determined by RT-qPCR. N = 6 mice. Size bars = 100 microns. H&E, hematoxylin and eosin; LF, low-fat control diet; WD, Western diet.
Figure 2
Figure 2
INT-767 prevents WD-induced steatosis, triglyceride, and cholesterol accumulation in the liver.A, steatosis as shown by H&E staining and liver injury scoring in mice on WD for 3 months compared to those on control low fat diet. BD, steatosis as determined by (B) H&E stain, (C) perilipin-2 (PLIN2) immunohistochemistry for lipid droplets, (D) label-free imaging with fluorescence lifetime imaging microscopy (FLIM), and third harmonic generation (THG) microscopy. The red areas in FLIM images show the lipid droplets identified by the long lifetime in FLIM images and their boundaries can be seen in THG images. The histogram shows the changes in the droplet sizes calculated from FLIM data. The p-value on the histogram: p < 0.0001 LF versus WD and WD versus WD+INT-767. E, triglyceride content as determined by GC-MS. F and G, mediators of fatty acid synthesis; SREBP-1c, SCD1, ChREBP-α, and ChREBP-β with mRNA levels as determined by RT-qPCR. G, mediators of fatty acid uptake; Cd36 and Fabp1 with mRNA levels as determined by RT-qPCR. H, liver cholesterol ester content as determined by GC-MS. I and J, a mediator of cholesterol uptake, LOX-1, mediators of cholesterol synthesis, including SREBP-2 and HMG-CoA reductase, and mediator of cholesterol efflux including ABCG5 and ABCG8 mRNA levels are shown, as determined by RT-qPCR. N = 6 mice. Size bars = 100 microns. H&E, hematoxylin and eosin; LF, low-fat control diet; WD, Western diet.
Figure 3
Figure 3
INT-767 prevents WD-induced inflammation and fibrosis in the liver.A and B, inflammation as determined by CD3 immunohistochemistry and MCP-1, TNF-α, and IL-1β mRNA levels; CE, fibrosis as determined by (C) Picro-Sirius Red staining, (D) label-free imaging with ratiometric TPE-SHG microscopy, and (E) type I collagen and type III collagen immunohistochemistry. In (D), the ratio of fraction covered by SHG (green) to the area covered by autofluorescence (red) indicated by fgreen/fred shows the extent of fibrillar collagen accumulation and how INT-767 reverses the effect of WD. F, INT-767 decreased TGF-β and α-SMA mRNA levels. N = 6 mice. ∗p < 0.05 WD versus LF; ∗∗p < 0.05 WD + INT-767 versus WD. Size bars = 100 microns. LF, low-fat control diet; SHG, second harmonic generation; TPE, two-photon excitation; WD, Western diet.
Figure 3
Figure 3
INT-767 prevents WD-induced inflammation and fibrosis in the liver.A and B, inflammation as determined by CD3 immunohistochemistry and MCP-1, TNF-α, and IL-1β mRNA levels; CE, fibrosis as determined by (C) Picro-Sirius Red staining, (D) label-free imaging with ratiometric TPE-SHG microscopy, and (E) type I collagen and type III collagen immunohistochemistry. In (D), the ratio of fraction covered by SHG (green) to the area covered by autofluorescence (red) indicated by fgreen/fred shows the extent of fibrillar collagen accumulation and how INT-767 reverses the effect of WD. F, INT-767 decreased TGF-β and α-SMA mRNA levels. N = 6 mice. ∗p < 0.05 WD versus LF; ∗∗p < 0.05 WD + INT-767 versus WD. Size bars = 100 microns. LF, low-fat control diet; SHG, second harmonic generation; TPE, two-photon excitation; WD, Western diet.
Figure 4
Figure 4
INT-767 regulates bile acid composition of serum, liver, and ileum.A, WD induced significant increases in serum total bile acids TCA, T-α-MCA, T-β-MCA, TDCA, T-HDCA, T-UDCA, and T-MDCA levels. Treatment with INT-767 prevented these increases and also resulted in significant decreases in serum TCA, T-α-MCA, T-β-MCA, TDCA, T-CDCA, T-HCDA, and T-MCDA levels. B, treatment of WD-fed mice with INT-767 also resulted in significant alterations in liver total bile acids and individual bile acid species including TCA, T-α-MCA, T-β-MCA, T-DCA, T-UDCA, and T-MDCA. C, when expressed as relative composition as shown in the pie chart, treatment with INT-767 increased the relative level of T-β-MCA and T-α-MCA but decreased that of TCA content. These changes resulted in a major decrease in the hydrophobicity index of the liver bile acid composition. D, treatment with INT-767 increased expression of liver bile salt export pump (BSEP), decreased expression of liver bile acid reabsorption transporters (NTCP, OATP) and increased expression of bile acid efflux transporters to the blood circulation (OSTβ). E, treatment of WD mice with INT-767 resulted in significant alterations in ileal total bile acids and in ileal individual bile acid species. The pie chart for ileum bile acid composition showed the decreased TCA and increased T-β-MCA and T-α-MCA in INT-767 treated mice, which contributed to the decreased hydrophobicity index. N = 6 mice. ∗p < 0.05 WD versus LF; ∗∗p < 0.05 WD + INT-767 versus WD. LF, low-fat control diet; WD, Western diet.
Figure 4
Figure 4
INT-767 regulates bile acid composition of serum, liver, and ileum.A, WD induced significant increases in serum total bile acids TCA, T-α-MCA, T-β-MCA, TDCA, T-HDCA, T-UDCA, and T-MDCA levels. Treatment with INT-767 prevented these increases and also resulted in significant decreases in serum TCA, T-α-MCA, T-β-MCA, TDCA, T-CDCA, T-HCDA, and T-MCDA levels. B, treatment of WD-fed mice with INT-767 also resulted in significant alterations in liver total bile acids and individual bile acid species including TCA, T-α-MCA, T-β-MCA, T-DCA, T-UDCA, and T-MDCA. C, when expressed as relative composition as shown in the pie chart, treatment with INT-767 increased the relative level of T-β-MCA and T-α-MCA but decreased that of TCA content. These changes resulted in a major decrease in the hydrophobicity index of the liver bile acid composition. D, treatment with INT-767 increased expression of liver bile salt export pump (BSEP), decreased expression of liver bile acid reabsorption transporters (NTCP, OATP) and increased expression of bile acid efflux transporters to the blood circulation (OSTβ). E, treatment of WD mice with INT-767 resulted in significant alterations in ileal total bile acids and in ileal individual bile acid species. The pie chart for ileum bile acid composition showed the decreased TCA and increased T-β-MCA and T-α-MCA in INT-767 treated mice, which contributed to the decreased hydrophobicity index. N = 6 mice. ∗p < 0.05 WD versus LF; ∗∗p < 0.05 WD + INT-767 versus WD. LF, low-fat control diet; WD, Western diet.
Figure 5
Figure 5
INT-767 increased mitochondrial function. A, p-AMPK, SIRT1, PGC-1α, and SIRT3 protein levels were determined by Western blotting and normalization to β-actin. B, mitochondrial DNA/nuclear DNA ratio. C, complex I and complex IV activity were determined by kits from MitoSciences/Abcam. N = 6 mice. ∗p < 0.05 WD versus LF; ∗∗p < 0.05 WD + INT-767 versus WD. LF, low-fat control diet; WD, Western diet.
Figure 6
Figure 6
The effects of INT-767 on NASH are FXR-dependent.A and B, steatosis as determined by H&E staining, liver triglyceride, and cholesterol content; CH, fibrosis as determined by (C) Picro-Sirius Red staining, (D) label-free imaging with SHG, (E) collagen I, and (F) collagen III immunohistochemistry, (G) quantitative measurement of collagen 1a1, collagen 1a2, and collagen 3a1 by LC-MS/MS, and (H) TGF-β and α-SMA mRNA levels. Size bars = 100 microns. I, the effects of INT-767 to stimulate p-AMPK, PGC-1α, SIRT3, and SOD2 protein are FXR-dependent. INT-767 stimulates p-AMPK, PGC-1α, SIRT3, and SOD2 protein in wildtype mice fed a WD but not in Fxr-null mice fed a WD. J, treatment of WD-fed mice with the FXR agonist OCA (INT-747) but not the TGR5 agonist INT-777 induces upregulation of PGC-1α and SIRT3 mRNA. N = 6 mice. ∗p < 0.05 WD versus LF; ∗∗p < 0.05 WD + INT-767 versus WD. Size bars = 100 microns. FXR, farnesoid X receptor; H&E, hematoxylin and eosin; LF, low-fat control diet; NASH, nonalcoholic steatohepatitis; WD, Western diet.
Figure 6
Figure 6
The effects of INT-767 on NASH are FXR-dependent.A and B, steatosis as determined by H&E staining, liver triglyceride, and cholesterol content; CH, fibrosis as determined by (C) Picro-Sirius Red staining, (D) label-free imaging with SHG, (E) collagen I, and (F) collagen III immunohistochemistry, (G) quantitative measurement of collagen 1a1, collagen 1a2, and collagen 3a1 by LC-MS/MS, and (H) TGF-β and α-SMA mRNA levels. Size bars = 100 microns. I, the effects of INT-767 to stimulate p-AMPK, PGC-1α, SIRT3, and SOD2 protein are FXR-dependent. INT-767 stimulates p-AMPK, PGC-1α, SIRT3, and SOD2 protein in wildtype mice fed a WD but not in Fxr-null mice fed a WD. J, treatment of WD-fed mice with the FXR agonist OCA (INT-747) but not the TGR5 agonist INT-777 induces upregulation of PGC-1α and SIRT3 mRNA. N = 6 mice. ∗p < 0.05 WD versus LF; ∗∗p < 0.05 WD + INT-767 versus WD. Size bars = 100 microns. FXR, farnesoid X receptor; H&E, hematoxylin and eosin; LF, low-fat control diet; NASH, nonalcoholic steatohepatitis; WD, Western diet.
Figure 7
Figure 7
The effects of INT-767 on NASH are TGR5-independent.A and B, steatosis as determined by H&E staining (A) and fibrosis as determined by Picro-Sirius Red staining with subsequent quantification (B). Only groups of wild-type WD (WTWD), wild-type WD+ INT-767 (WTWD + INT), TGR5KO WD, and TGR5KO WD+INT-767 in the study were compared. C and D, steatosis as determined by H&E staining with quantification of liver total injury (C) and fibrosis as determined by Picro-Sirius Red staining with quantification (D). Only groups of wild-type WD [reuse of WTWD images of H&E (panel A) and polarized Picro-Sirius Red staining (panel B)], wild-type WD+ INT-747, wild-type WD+ INT-767 [reuse of WTWD + INT images of H&E (panel A), and polarized Picro-Sirius Red staining (panel B)], and wild-type WD+ INT-777 in the study were compared. N = 6 mice. ∗p < 0.05 versus WTWD; ∗∗p < 0.05 versus TGR5KOWD. Size bars = 100 microns. H&E, hematoxylin and eosin; NASH, nonalcoholic steatohepatitis; WD, Western diet.
Figure 7
Figure 7
The effects of INT-767 on NASH are TGR5-independent.A and B, steatosis as determined by H&E staining (A) and fibrosis as determined by Picro-Sirius Red staining with subsequent quantification (B). Only groups of wild-type WD (WTWD), wild-type WD+ INT-767 (WTWD + INT), TGR5KO WD, and TGR5KO WD+INT-767 in the study were compared. C and D, steatosis as determined by H&E staining with quantification of liver total injury (C) and fibrosis as determined by Picro-Sirius Red staining with quantification (D). Only groups of wild-type WD [reuse of WTWD images of H&E (panel A) and polarized Picro-Sirius Red staining (panel B)], wild-type WD+ INT-747, wild-type WD+ INT-767 [reuse of WTWD + INT images of H&E (panel A), and polarized Picro-Sirius Red staining (panel B)], and wild-type WD+ INT-777 in the study were compared. N = 6 mice. ∗p < 0.05 versus WTWD; ∗∗p < 0.05 versus TGR5KOWD. Size bars = 100 microns. H&E, hematoxylin and eosin; NASH, nonalcoholic steatohepatitis; WD, Western diet.
Figure 8
Figure 8
WD and INT-767 modulate the microbiota.A, distribution of bacterial genera in cecal and colon contents. Results of permutation-based multiple analysis of variance (PERMANOVA) tests for pairwise comparisons between treatment groups are shown by symbols above bar charts. PERMANOVA tests across all treatment groups are summarized below bar charts: “Overall” shows the p-value for tests across all five treatment groups, while “Diet”, “INT767”, and “FXR geno” summarize the p-values for multiple-factor PERMANOVA tests. •p < 0.1; ∗p < 0.05; ∗∗p < 0.01. B, summary of relative abundances of the key intestinal phyla, Bacteroidetes, and Firmicutes, across treatment groups. •p < 0.1; ∗p < 0.05; ∗∗p < 0.01. C, heatmaps displaying Spearman rho correlation coefficients for pairwise comparisons of cecal bile acid species versus cecal or colonic microbial taxa (top 15 most abundant genus-level taxa). Genus-level taxon names are preceded by abbreviated phylum names: Acti: Actinobacteria, Bact: Bacteroidetes, Firm: Firmicutes. ∗p < 0.05; #p < 0.01. FXR, farnesoid X receptor; LF, low-fat control diet; WD, Western diet.
Figure 9
Figure 9
The effects of INT-767 on MCD induced NASH.A, steatosis as determined by H&E staining; B, fibrosis as determined by Picro-Sirius Red staining. Size bars = 100 microns. H&E, hematoxylin and eosin; MCD, methionine and choline–deficient diet; NASH, nonalcoholic steatohepatitis.

References

    1. Levene A.P., Goldin R.D. The epidemiology, pathogenesis and histopathology of fatty liver disease. Histopathology. 2012;61:141–152. - PubMed
    1. Spengler E.K., Loomba R. Recommendations for diagnosis, referral for liver biopsy, and treatment of nonalcoholic fatty liver disease and nonalcoholic steatohepatitis. Mayo Clin. Proc. 2015;90:1233–1246. - PMC - PubMed
    1. Wree A., Broderick L., Canbay A., Hoffman H.M., Feldstein A.E. From NAFLD to NASH to cirrhosis-new insights into disease mechanisms. Nat. Rev. Gastroenterol. Hepatol. 2013;10:627–636. - PubMed
    1. Stal P. Liver fibrosis in non-alcoholic fatty liver disease - diagnostic challenge with prognostic significance. World J. Gastroenterol. 2015;21:11077–11087. - PMC - PubMed
    1. Marchesini G., Petta S., Dalle Grave R. Diet, weight loss, and liver health in nonalcoholic fatty liver disease: pathophysiology, evidence, and practice. Hepatology. 2016;63:2032–2043. - PubMed

Publication types