

Quality of antibody responses by adults and young children to 13-valent pneumococcal conjugate vaccination and Streptococcus pneumoniae colonisation
- PMID: 36210249
- PMCID: PMC10615833
- DOI: 10.1016/j.vaccine.2022.09.069
Quality of antibody responses by adults and young children to 13-valent pneumococcal conjugate vaccination and Streptococcus pneumoniae colonisation
Abstract
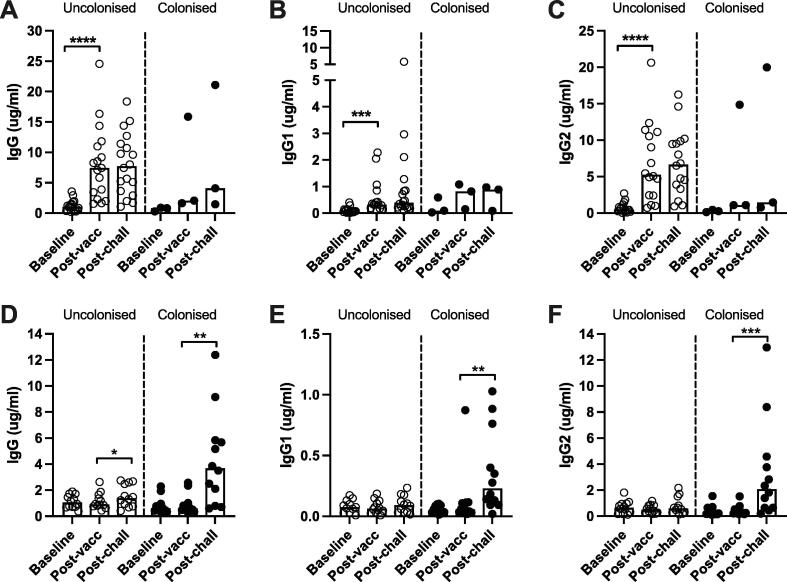
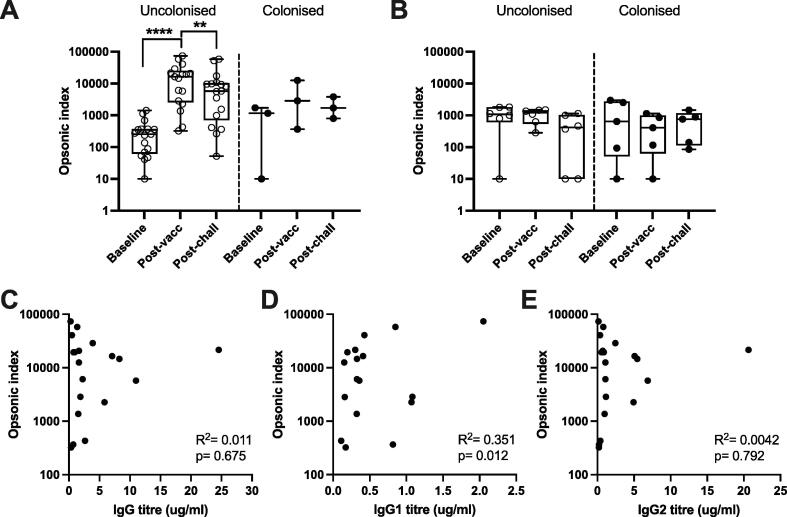
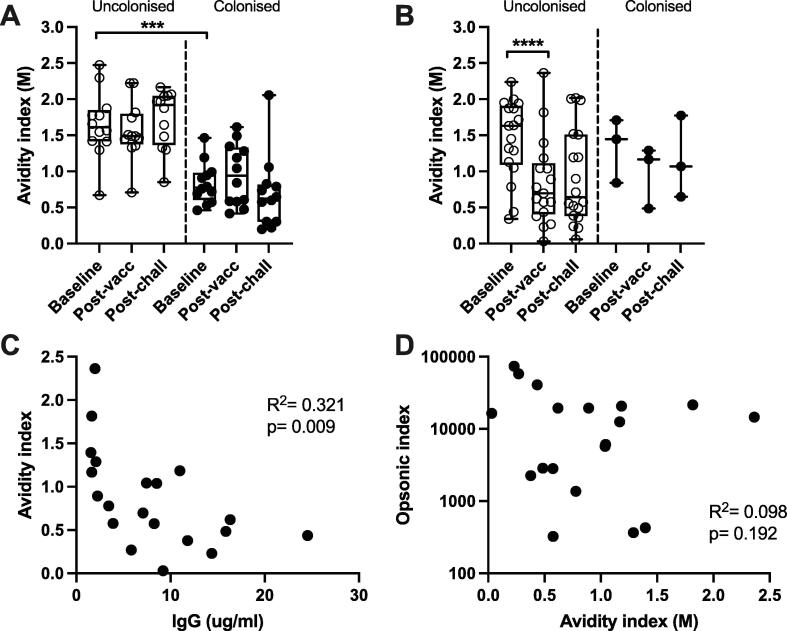
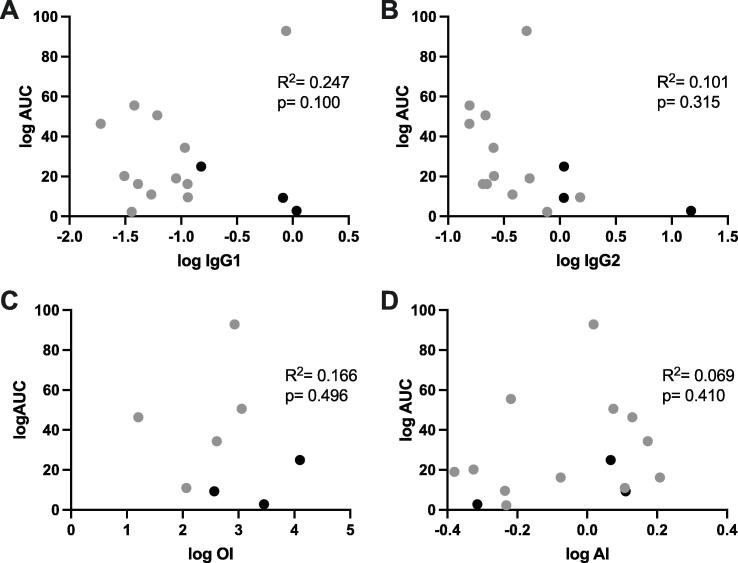
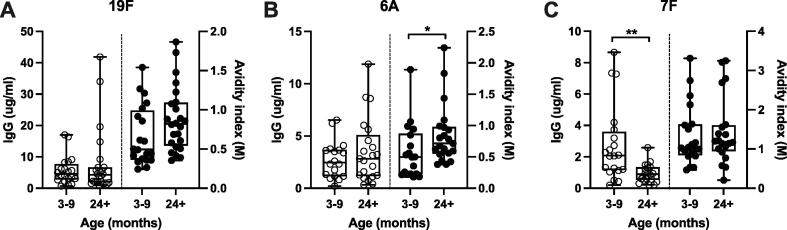
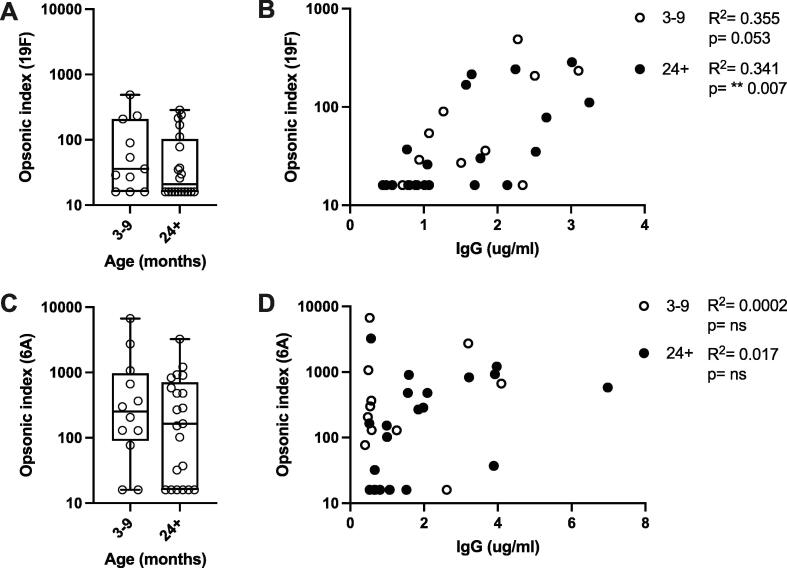
Childhood pneumococcal conjugate vaccine (PCV) protects against invasive pneumococcal disease caused by vaccine-serotype (VT) Streptococcus pneumoniae by generating opsonophagocytic anti-capsular antibodies, but how vaccination protects against and reduces VT carriage is less well understood. Using serological samples from PCV-vaccinated Malawian individuals and a UK human challenge model, we explored whether antibody quality (IgG subclass, opsonophagocytic killing, and avidity) is associated with protection from carriage. Following experimental challenge of adults with S. pneumoniae serotype 6B, 3/21 PCV13-vaccinees were colonised with pneumococcus compared to 12/24 hepatitis A-vaccinated controls; PCV13-vaccination induced serotype-specific IgG, IgG1, and IgG2, and strong opsonophagocytic responses. However, there was no clear relationship between antibody quality and protection from carriage or carriage intensity after vaccination. Similarly, among PCV13-vaccinated Malawian infants there was no relationship between serotype-specific antibody titre or quality and carriage through exposure to circulating serotypes. Although opsonophagocytic responses were low in infants, antibody titre and avidity to circulating serotypes 19F and 6A were maintained or increased with age. These data suggest a complex relationship between antibody-mediated immunity and pneumococcal carriage, and that PCV13-driven antibody quality may mature with age and exposure.
Keywords: Avidity; Carriage; Colonisation; Opsonophagocytosis; PCV; Pneumococcal conjugate vaccine; Pneumococcus.
Copyright © 2022 The Author(s). Published by Elsevier Ltd.. All rights reserved.
Conflict of interest statement
Declaration of Competing Interest The authors declare that they have no known competing financial interests or personal relationships that could have appeared to influence the work reported in this paper.
Figures
Similar articles
-
Poor association between 13-valent pneumococcal conjugate vaccine-induced serum and mucosal antibody responses with experimental Streptococcus pneumoniae serotype 6B colonisation.Vaccine. 2024 Apr 30;42(12):2975-2982. doi: 10.1016/j.vaccine.2024.03.055. Epub 2024 Apr 4. Vaccine. 2024. PMID: 38570270 Free PMC article.
-
Pneumococcal carriage in children and adults two years after introduction of the thirteen valent pneumococcal conjugate vaccine in England.Vaccine. 2014 Jul 23;32(34):4349-55. doi: 10.1016/j.vaccine.2014.03.017. Epub 2014 Mar 21. Vaccine. 2014. PMID: 24657717
-
Dose-specific Effectiveness of 7- and 13-Valent Pneumococcal Conjugate Vaccines Against Vaccine-serotype Streptococcus pneumoniae Colonization in Children.Clin Infect Dis. 2020 Nov 5;71(8):e289-e300. doi: 10.1093/cid/ciz1164. Clin Infect Dis. 2020. PMID: 31784753 Free PMC article.
-
Streptococcus pneumoniae serotype 19A: worldwide epidemiology.Expert Rev Vaccines. 2017 Oct;16(10):1007-1027. doi: 10.1080/14760584.2017.1362339. Epub 2017 Aug 28. Expert Rev Vaccines. 2017. PMID: 28783380 Review.
-
Relationship between immune response to pneumococcal conjugate vaccines in infants and indirect protection after vaccine implementation.Expert Rev Vaccines. 2019 Jun;18(6):641-661. doi: 10.1080/14760584.2019.1627207. Epub 2019 Jun 22. Expert Rev Vaccines. 2019. PMID: 31230486 Review.
Cited by
-
Incidence Rates for Invasive Streptococcus pneumoniae and Haemophilus influenzae Infections in US Military Pediatric Dependents Before and During COVID-19.Vaccines (Basel). 2025 Feb 24;13(3):225. doi: 10.3390/vaccines13030225. Vaccines (Basel). 2025. PMID: 40266090 Free PMC article.
-
The development of functional opsonophagocytic assays to evaluate antibody responses to Klebsiella pneumoniae capsular antigens.mSphere. 2025 Jul 29;10(7):e0017625. doi: 10.1128/msphere.00176-25. Epub 2025 Jun 12. mSphere. 2025. PMID: 40503906 Free PMC article.
-
Poor association between 13-valent pneumococcal conjugate vaccine-induced serum and mucosal antibody responses with experimental Streptococcus pneumoniae serotype 6B colonisation.Vaccine. 2024 Apr 30;42(12):2975-2982. doi: 10.1016/j.vaccine.2024.03.055. Epub 2024 Apr 4. Vaccine. 2024. PMID: 38570270 Free PMC article.
-
Baseline Pneumococcal IgG Levels and Response to 23-Valent Pneumococcal Polysaccharide Vaccine among Adults from Beijing, China.Vaccines (Basel). 2023 Nov 29;11(12):1780. doi: 10.3390/vaccines11121780. Vaccines (Basel). 2023. PMID: 38140184 Free PMC article.
-
Strong immune responses and protection of PcrV and OprF-I mRNA vaccine candidates against Pseudomonas aeruginosa.NPJ Vaccines. 2023 May 25;8(1):76. doi: 10.1038/s41541-023-00672-4. NPJ Vaccines. 2023. PMID: 37231060 Free PMC article.
References
-
- Simell B., Auranen K., Kayhty H., et al. The fundamental link between pneumococcal carriage and disease. Expert Rev Vaccines. 2012;11:841–855. - PubMed
-
- World Health Organisation. WHO vaccine-preventable diseases: monitoring system. 2020 global summary. Available at: https://apps.who.int/immunization_monitoring/globalsummary/schedules. Accessed 4 December 2020.
-
- Davis S.M., Deloria-Knoll M., Kassa H.T., O'Brien K.L. Impact of pneumococcal conjugate vaccines on nasopharyngeal carriage and invasive disease among unvaccinated people: review of evidence on indirect effects. Vaccine. 2013;32:133–145. - PubMed
-
- Waight P.A., Andrews N.J., Ladhani S.N., Sheppard C.L., Slack M.P.E., Miller E. Effect of the 13-valent pneumococcal conjugate vaccine on invasive pneumococcal disease in England and Wales 4 years after its introduction: an observational cohort study. Lancet Infect Dis. 2015;15:535–543. - PubMed
Publication types
MeSH terms
Substances
Grants and funding
LinkOut - more resources
Full Text Sources
Medical
