

SK3 in POMC neurons plays a sexually dimorphic role in energy and glucose homeostasis
- PMID: 36210455
- PMCID: PMC9549684
- DOI: 10.1186/s13578-022-00907-2
SK3 in POMC neurons plays a sexually dimorphic role in energy and glucose homeostasis
Abstract
Background: Pro-opiomelanocortin (POMC) neurons play a sexually dimorphic role in body weight and glucose balance. However, the mechanisms for the sex differences in POMC neuron functions are not fully understood.
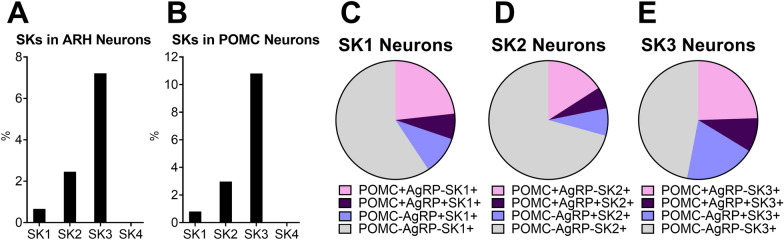
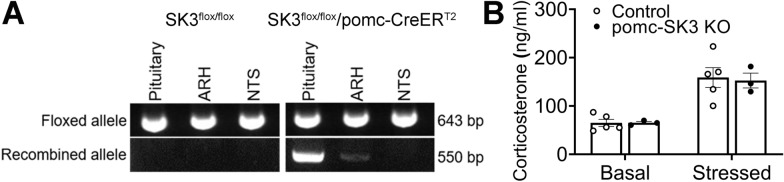
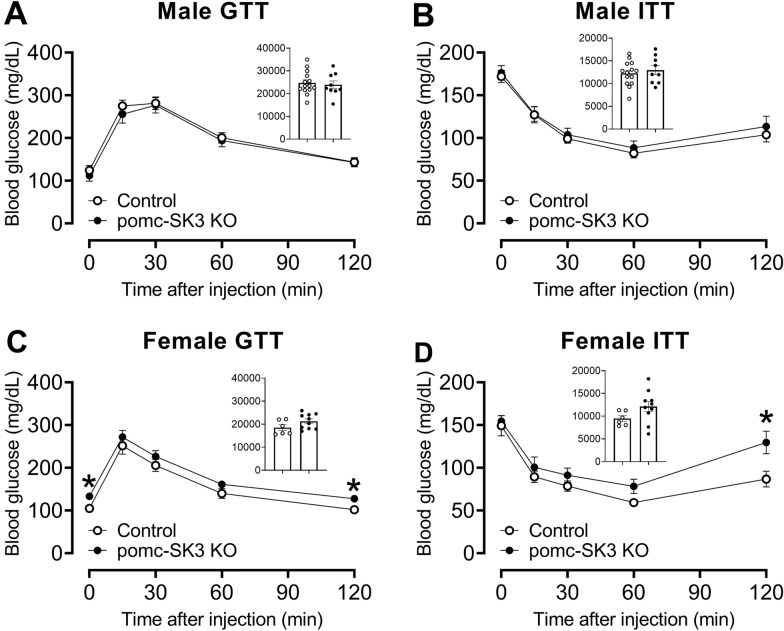
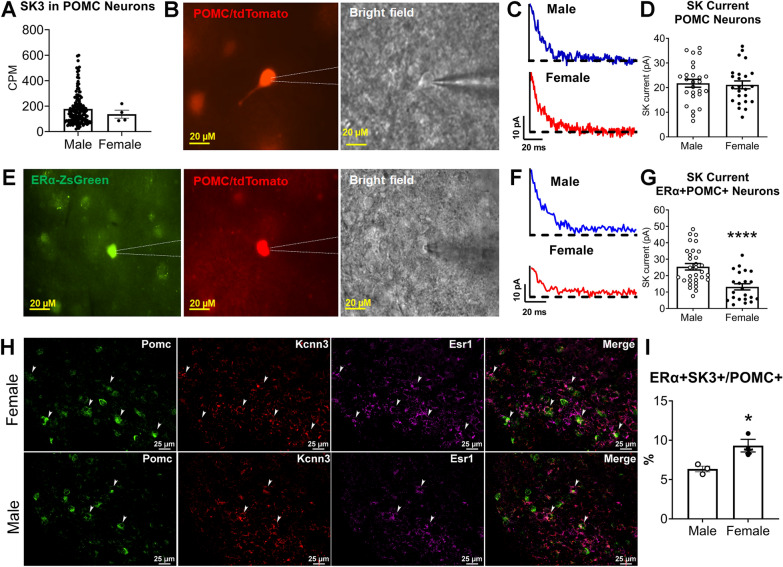
Results: We detected small conductance calcium-activated potassium (SK) current in POMC neurons. Secondary analysis of published single-cell RNA-Seq data showed that POMC neurons abundantly express SK3, one SK channel subunit. To test whether SK3 in POMC neurons regulates POMC neuron functions on energy and glucose homeostasis, we used a Cre-loxP strategy to delete SK3 specifically from mature POMC neurons. POMC-specific deletion of SK3 did not affect body weight in either male or female mice. Interestingly, male mutant mice showed not only decreased food intake but also decreased physical activity, resulting in unchanged body weight. Further, POMC-specific SK3 deficiency impaired glucose balance specifically in female mice but not in male mice. Finally, no sex differences were detected in the expression of SK3 and SK current in total POMC neurons. However, we found higher SK current but lower SK3 positive neuron population in male POMC neurons co-expressing estrogen receptor α (ERα) compared to that in females.
Conclusion: These results revealed a sexually dimorphic role of SK3 in POMC neurons in both energy and glucose homeostasis independent of body weight control, which was associated with the sex difference of SK current in a subpopulation of POMC + ERα + neurons.
Keywords: Energy and glucose homeostasis; POMC neurons; SK current; Sexually dimorphism.
© 2022. The Author(s).
Conflict of interest statement
The authors declare that they have no competing interests.
Figures


Similar articles
-
Gabra5 plays a sexually dimorphic role in POMC neuron activity and glucose balance.Front Endocrinol (Lausanne). 2022 Aug 31;13:889122. doi: 10.3389/fendo.2022.889122. eCollection 2022. Front Endocrinol (Lausanne). 2022. PMID: 36120438 Free PMC article.
-
The role of GluN2A and GluN2B NMDA receptor subunits in AgRP and POMC neurons on body weight and glucose homeostasis.Mol Metab. 2015 Jul 6;4(10):678-91. doi: 10.1016/j.molmet.2015.06.010. eCollection 2015 Oct. Mol Metab. 2015. PMID: 26500840 Free PMC article.
-
Effect of selective expression of dominant-negative PPARγ in pro-opiomelanocortin neurons on the control of energy balance.Physiol Genomics. 2016 Jul 1;48(7):491-501. doi: 10.1152/physiolgenomics.00032.2016. Epub 2016 May 13. Physiol Genomics. 2016. PMID: 27199455 Free PMC article.
-
Direct leptin action on POMC neurons regulates glucose homeostasis and hepatic insulin sensitivity in mice.J Clin Invest. 2012 Mar;122(3):1000-9. doi: 10.1172/JCI59816. Epub 2012 Feb 13. J Clin Invest. 2012. PMID: 22326958 Free PMC article.
-
The CNS glucagon-like peptide-2 receptor in the control of energy balance and glucose homeostasis.Am J Physiol Regul Integr Comp Physiol. 2014 Sep 15;307(6):R585-96. doi: 10.1152/ajpregu.00096.2014. Epub 2014 Jul 2. Am J Physiol Regul Integr Comp Physiol. 2014. PMID: 24990862 Free PMC article. Review.
Cited by
-
Neurochemical Basis of Inter-Organ Crosstalk in Health and Obesity: Focus on the Hypothalamus and the Brainstem.Cells. 2023 Jul 7;12(13):1801. doi: 10.3390/cells12131801. Cells. 2023. PMID: 37443835 Free PMC article. Review.
-
Sex Differences in Glucose Homeostasis.Handb Exp Pharmacol. 2023;282:219-239. doi: 10.1007/164_2023_664. Handb Exp Pharmacol. 2023. PMID: 37439847
-
Molecular and functional mapping of the neuroendocrine hypothalamus: a new era begins.J Endocrinol Invest. 2024 Nov;47(11):2627-2648. doi: 10.1007/s40618-024-02411-5. Epub 2024 Jun 15. J Endocrinol Invest. 2024. PMID: 38878127 Review.
-
27-Hydroxycholesterol acts on estrogen receptor α expressed by POMC neurons in the arcuate nucleus to modulate feeding behavior.Sci Adv. 2024 Jul 12;10(28):eadi4746. doi: 10.1126/sciadv.adi4746. Epub 2024 Jul 12. Sci Adv. 2024. PMID: 38996023 Free PMC article.
-
Asprosin promotes feeding through SK channel-dependent activation of AgRP neurons.Sci Adv. 2023 Feb 22;9(8):eabq6718. doi: 10.1126/sciadv.abq6718. Epub 2023 Feb 22. Sci Adv. 2023. PMID: 36812308 Free PMC article.
References
Grants and funding
- R01 DK123098/DK/NIDDK NIH HHS/United States
- R00DK107008/NH/NIH HHS/United States
- K01DK119471/NH/NIH HHS/United States
- P30 DK072476/DK/NIDDK NIH HHS/United States
- K01 DK119471/DK/NIDDK NIH HHS/United States
- P20 GM135002/NH/NIH HHS/United States
- R01DK120858/NH/NIH HHS/United States
- R01DK117281/NH/NIH HHS/United States
- P20 GM135002/GM/NIGMS NIH HHS/United States
- R01DK123098/NH/NIH HHS/United States
- P01DK113954/NH/NIH HHS/United States
- R01DK125480/NH/NIH HHS/United States
- R00 DK107008/DK/NIDDK NIH HHS/United States
- R01DK129548/NH/NIH HHS/United States
- R01 DK129548/DK/NIDDK NIH HHS/United States
- R01DK115761/NH/NIH HHS/United States
LinkOut - more resources
Full Text Sources
Miscellaneous
