Access to online learning: Machine learning analysis from a social justice perspective
- PMID: 36210911
- PMCID: PMC9530424
- DOI: 10.1007/s10639-022-11280-5
Access to online learning: Machine learning analysis from a social justice perspective
Abstract
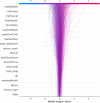
Access to education is the first step to benefiting from it. Although cumulative online learning experience is linked academic learning gains, between-country inequalities mean that large populations are prevented from accumulating such experience. Low-and-middle-income countries are affected by disadvantages in infrastructure such as internet access and uncontextualised learning content, and parents who are less available and less well-resourced than in high-income countries. COVID-19 has exacerbated the global inequalities, with girls affected more than boys in these regions. Therefore, the present research mined online learning data to identify features that are important for access to online learning. Data mining of 54,842,787 initial (random subsample n = 5000) data points from one online learning platform was conducted by partnering theory with data in model development. Following examination of a theory-led machine learning model, a data-led approach was taken to reach a final model. The final model was used to derive Shapley values for feature importance. As expected, country differences, gender, and COVID-19 were important features in access to online learning. The data-led model development resulted in additional insights not examined in the initial, theory-led model: namely, the importance of Math ability, year of birth, session difficulty level, month of birth, and time taken to complete a session.
Keywords: COVID-19; Country inequalities; Educational access; Machine learning; Online learning.
© The Author(s) 2022.
Conflict of interest statement
Conflicts of interestThe author declare no conflict of interests.
Figures


Similar articles
-
The effectiveness of internet-based e-learning on clinician behavior and patient outcomes: a systematic review protocol.JBI Database System Rev Implement Rep. 2015 Jan;13(1):52-64. doi: 10.11124/jbisrir-2015-1919. JBI Database System Rev Implement Rep. 2015. PMID: 26447007
-
Students' concerns about Online Remote Learning during COVID-19 Pandemic in the 4IR digital society.Procedia Comput Sci. 2023;219:971-976. doi: 10.1016/j.procs.2023.01.374. Epub 2023 Mar 22. Procedia Comput Sci. 2023. PMID: 36968665 Free PMC article.
-
The future of Cochrane Neonatal.Early Hum Dev. 2020 Nov;150:105191. doi: 10.1016/j.earlhumdev.2020.105191. Epub 2020 Sep 12. Early Hum Dev. 2020. PMID: 33036834
-
Online digital recovery support services: An overview of the science and their potential to help individuals with substance use disorder during COVID-19 and beyond.J Subst Abuse Treat. 2021 Jan;120:108152. doi: 10.1016/j.jsat.2020.108152. Epub 2020 Oct 4. J Subst Abuse Treat. 2021. PMID: 33129636 Free PMC article. Review.
-
Online faculty development in low- and middle-income countries for health professions educators: a rapid realist review.Hum Resour Health. 2022 Jan 29;20(1):12. doi: 10.1186/s12960-022-00711-6. Hum Resour Health. 2022. PMID: 35093081 Free PMC article. Review.
Cited by
-
A scoping review of nursing interventions of improving resilience among university students during online learning.BMC Nurs. 2025 Jul 14;24(1):913. doi: 10.1186/s12912-025-03581-0. BMC Nurs. 2025. PMID: 40660213 Free PMC article.
References
-
- Aas K, Jullum M, Løland A. Explaining individual predictions when features are dependent: More accurate approximations to Shapley values. Artificial Intelligence. 2021;298:103502. doi: 10.1016/j.artint.2021.103502. - DOI
-
- Aboagye, E., Yawson, J. A., & Appiah, K. N. (2021). COVID-19 and E-learning: The challenges of students in tertiary institutions. Social Education Research, 1–8.
-
- Adam T. Open educational practices of MOOC designers: Embodiment and epistemic location. Distance Education. 2020;41(2):171–185. doi: 10.1080/01587919.2020.1757405. - DOI
-
- Adam T. Between social justice and decolonisation: Exploring South African MOOC designers’ conceptualisations and approaches to addressing injustices. Journal of Interactive Media in Education. 2020;2020(1):7. doi: 10.5334/jime.557. - DOI
-
- Agesa, R. U., & Agesa, J. (2019). Time spent on household chores (fetching water) and the alternatives forgone for women in Sub-Saharan Africa: Evidence from Kenya. The Journal of Developing Areas, 53(2).
LinkOut - more resources
Full Text Sources
Research Materials
