. 2021 Dec;1(12):1189-1201.
doi: 10.1038/s43587-021-00134-3. Epub 2021 Dec 9.

Profiling epigenetic age in single cells

Affiliations

Profiling epigenetic age in single cells

Alexandre Trapp et al. Nat Aging. 2021 Dec.

Abstract

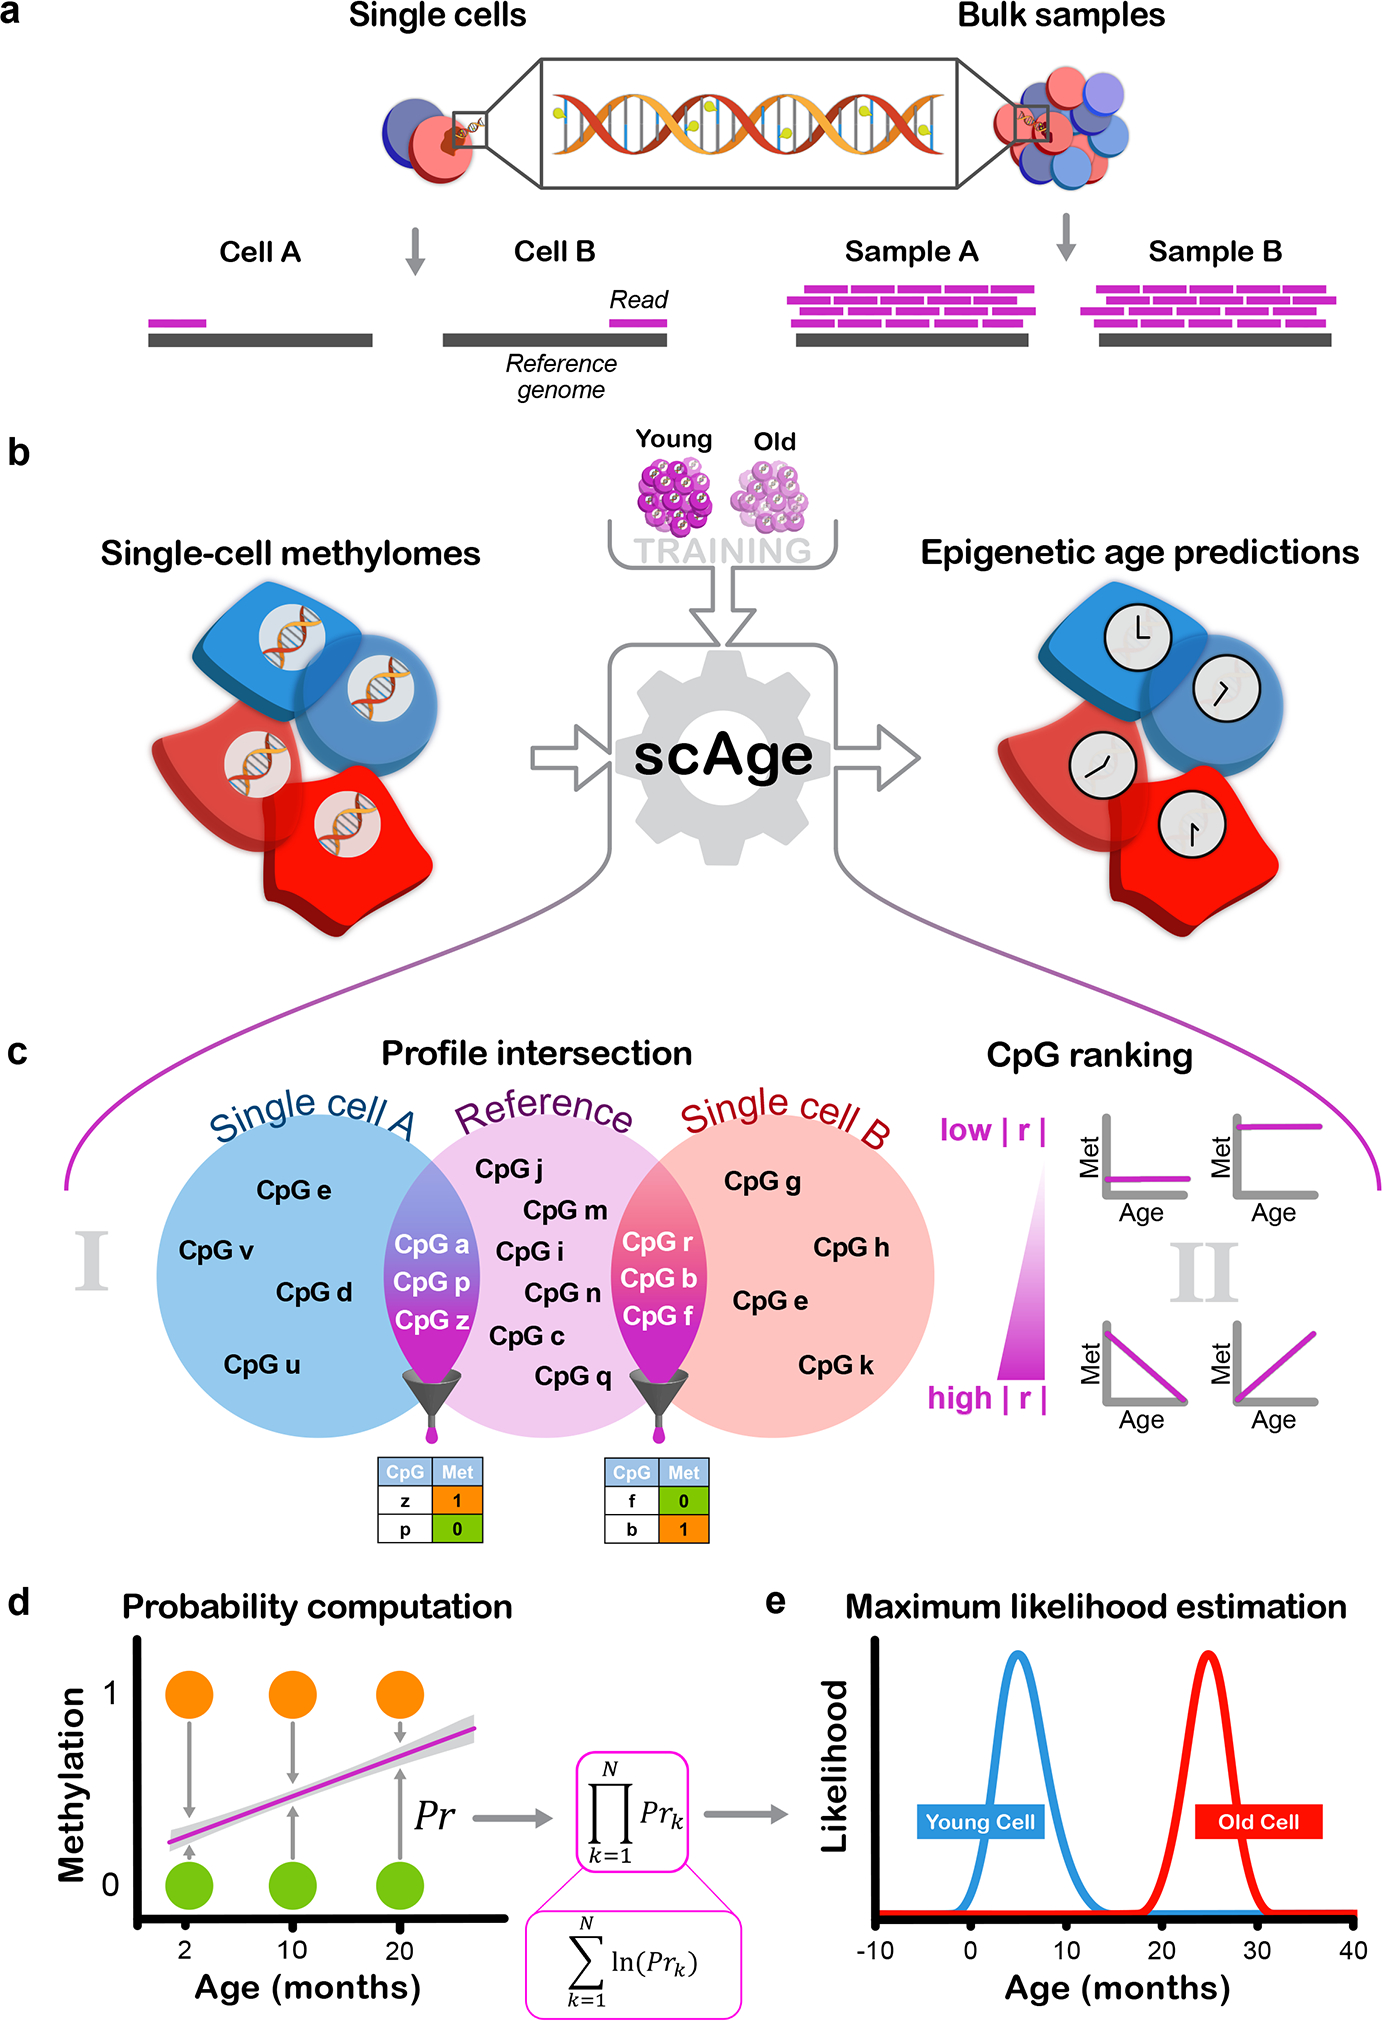
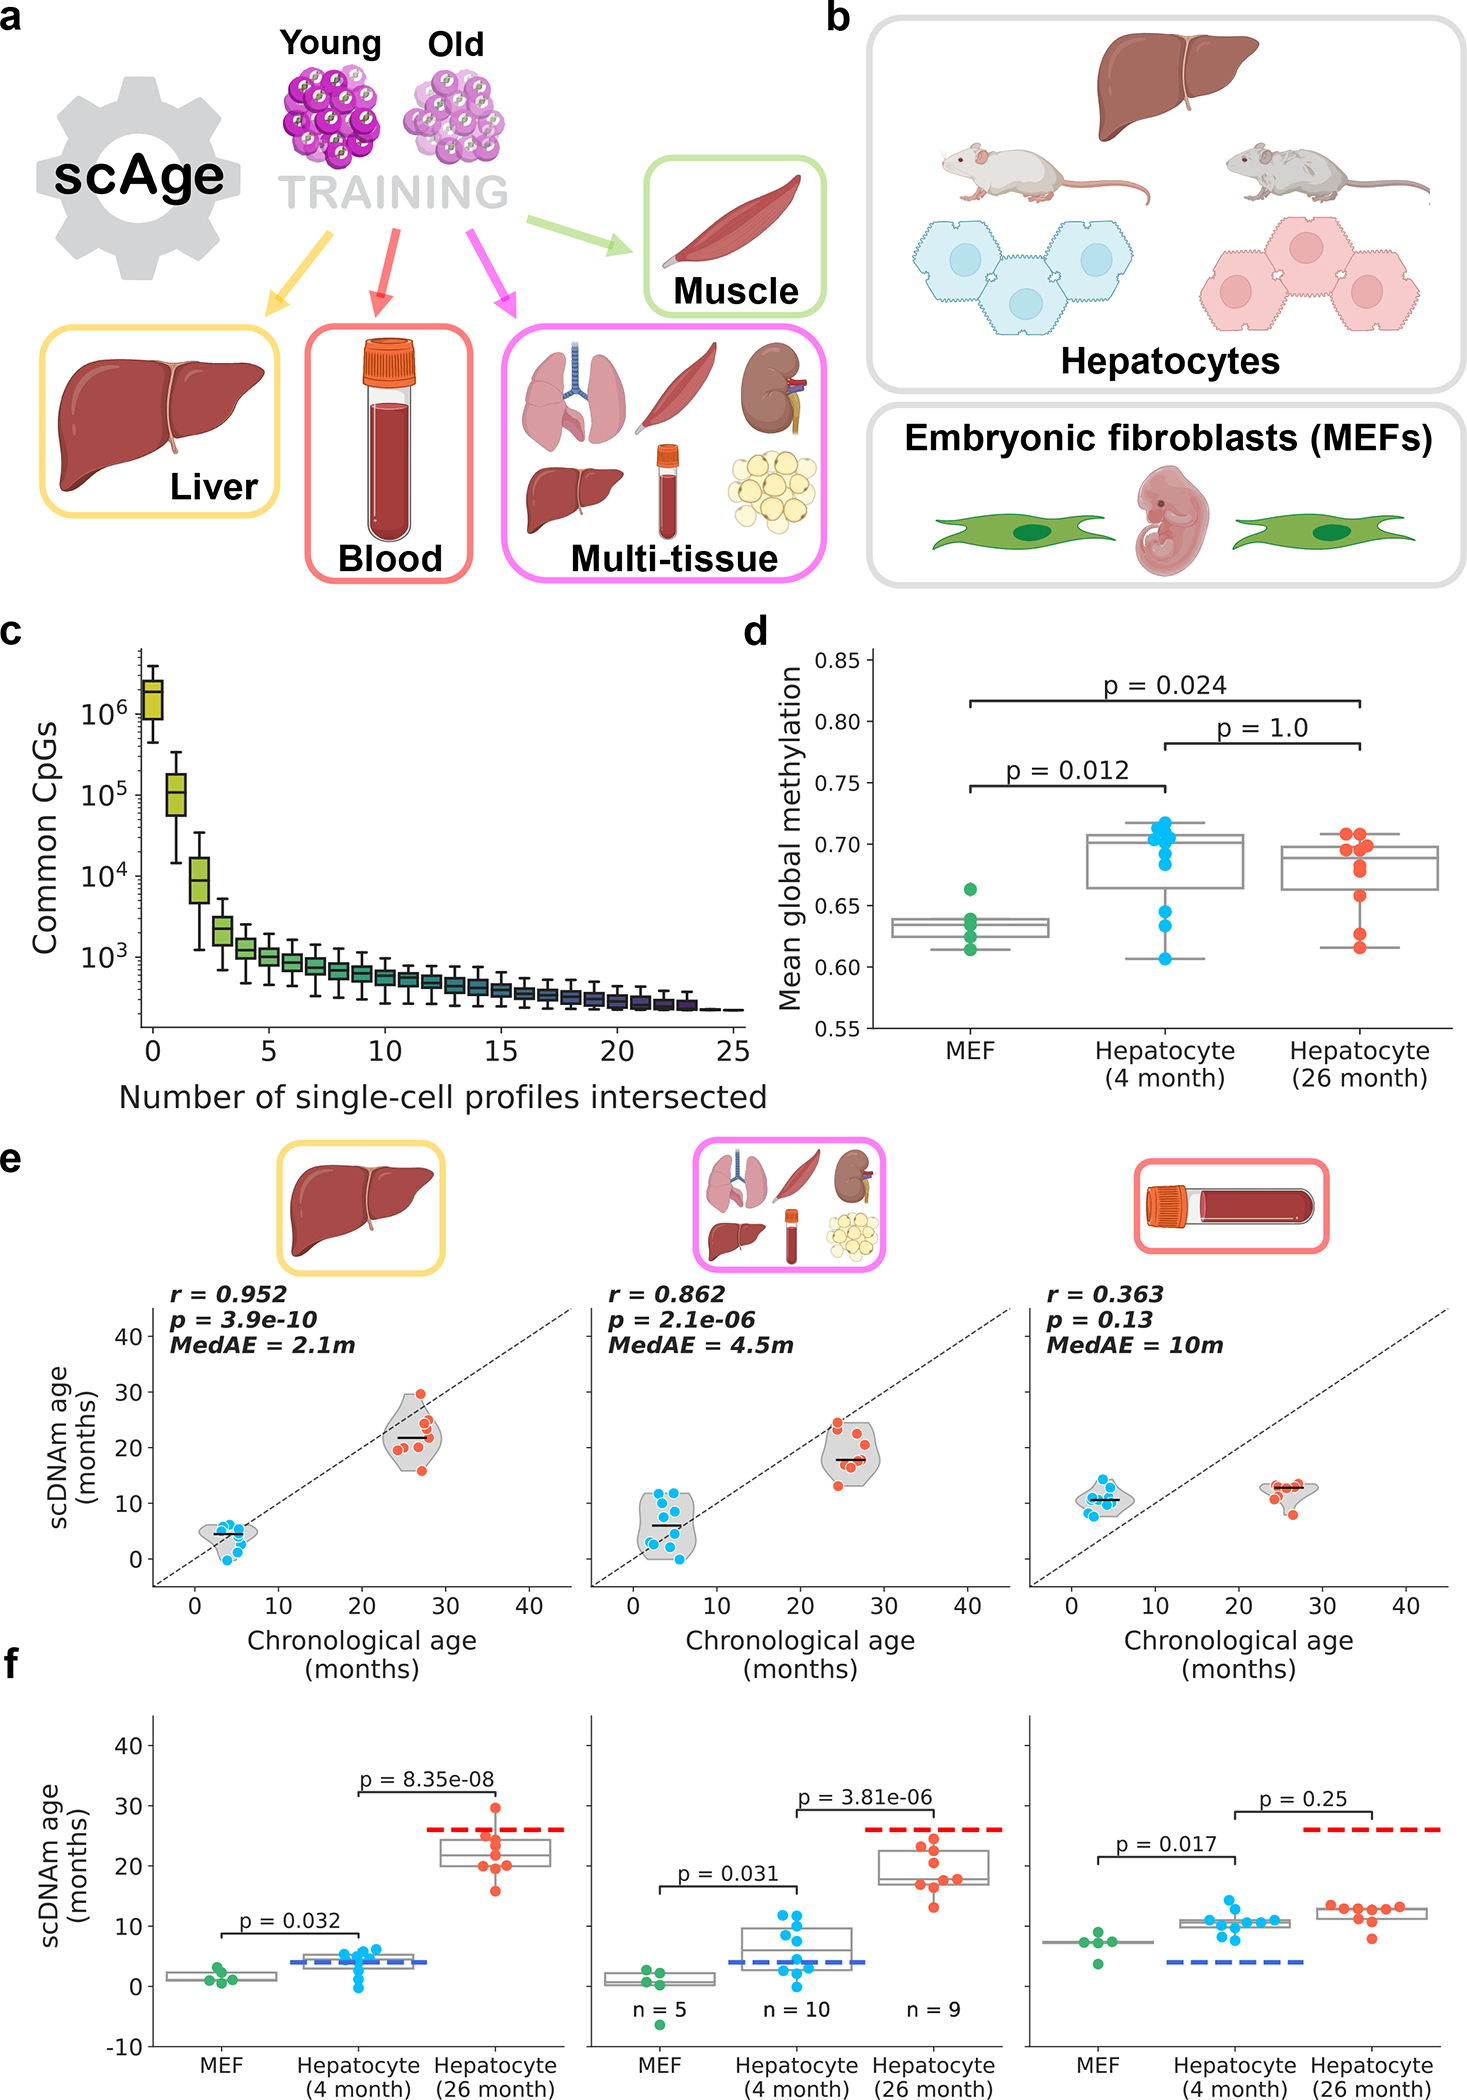
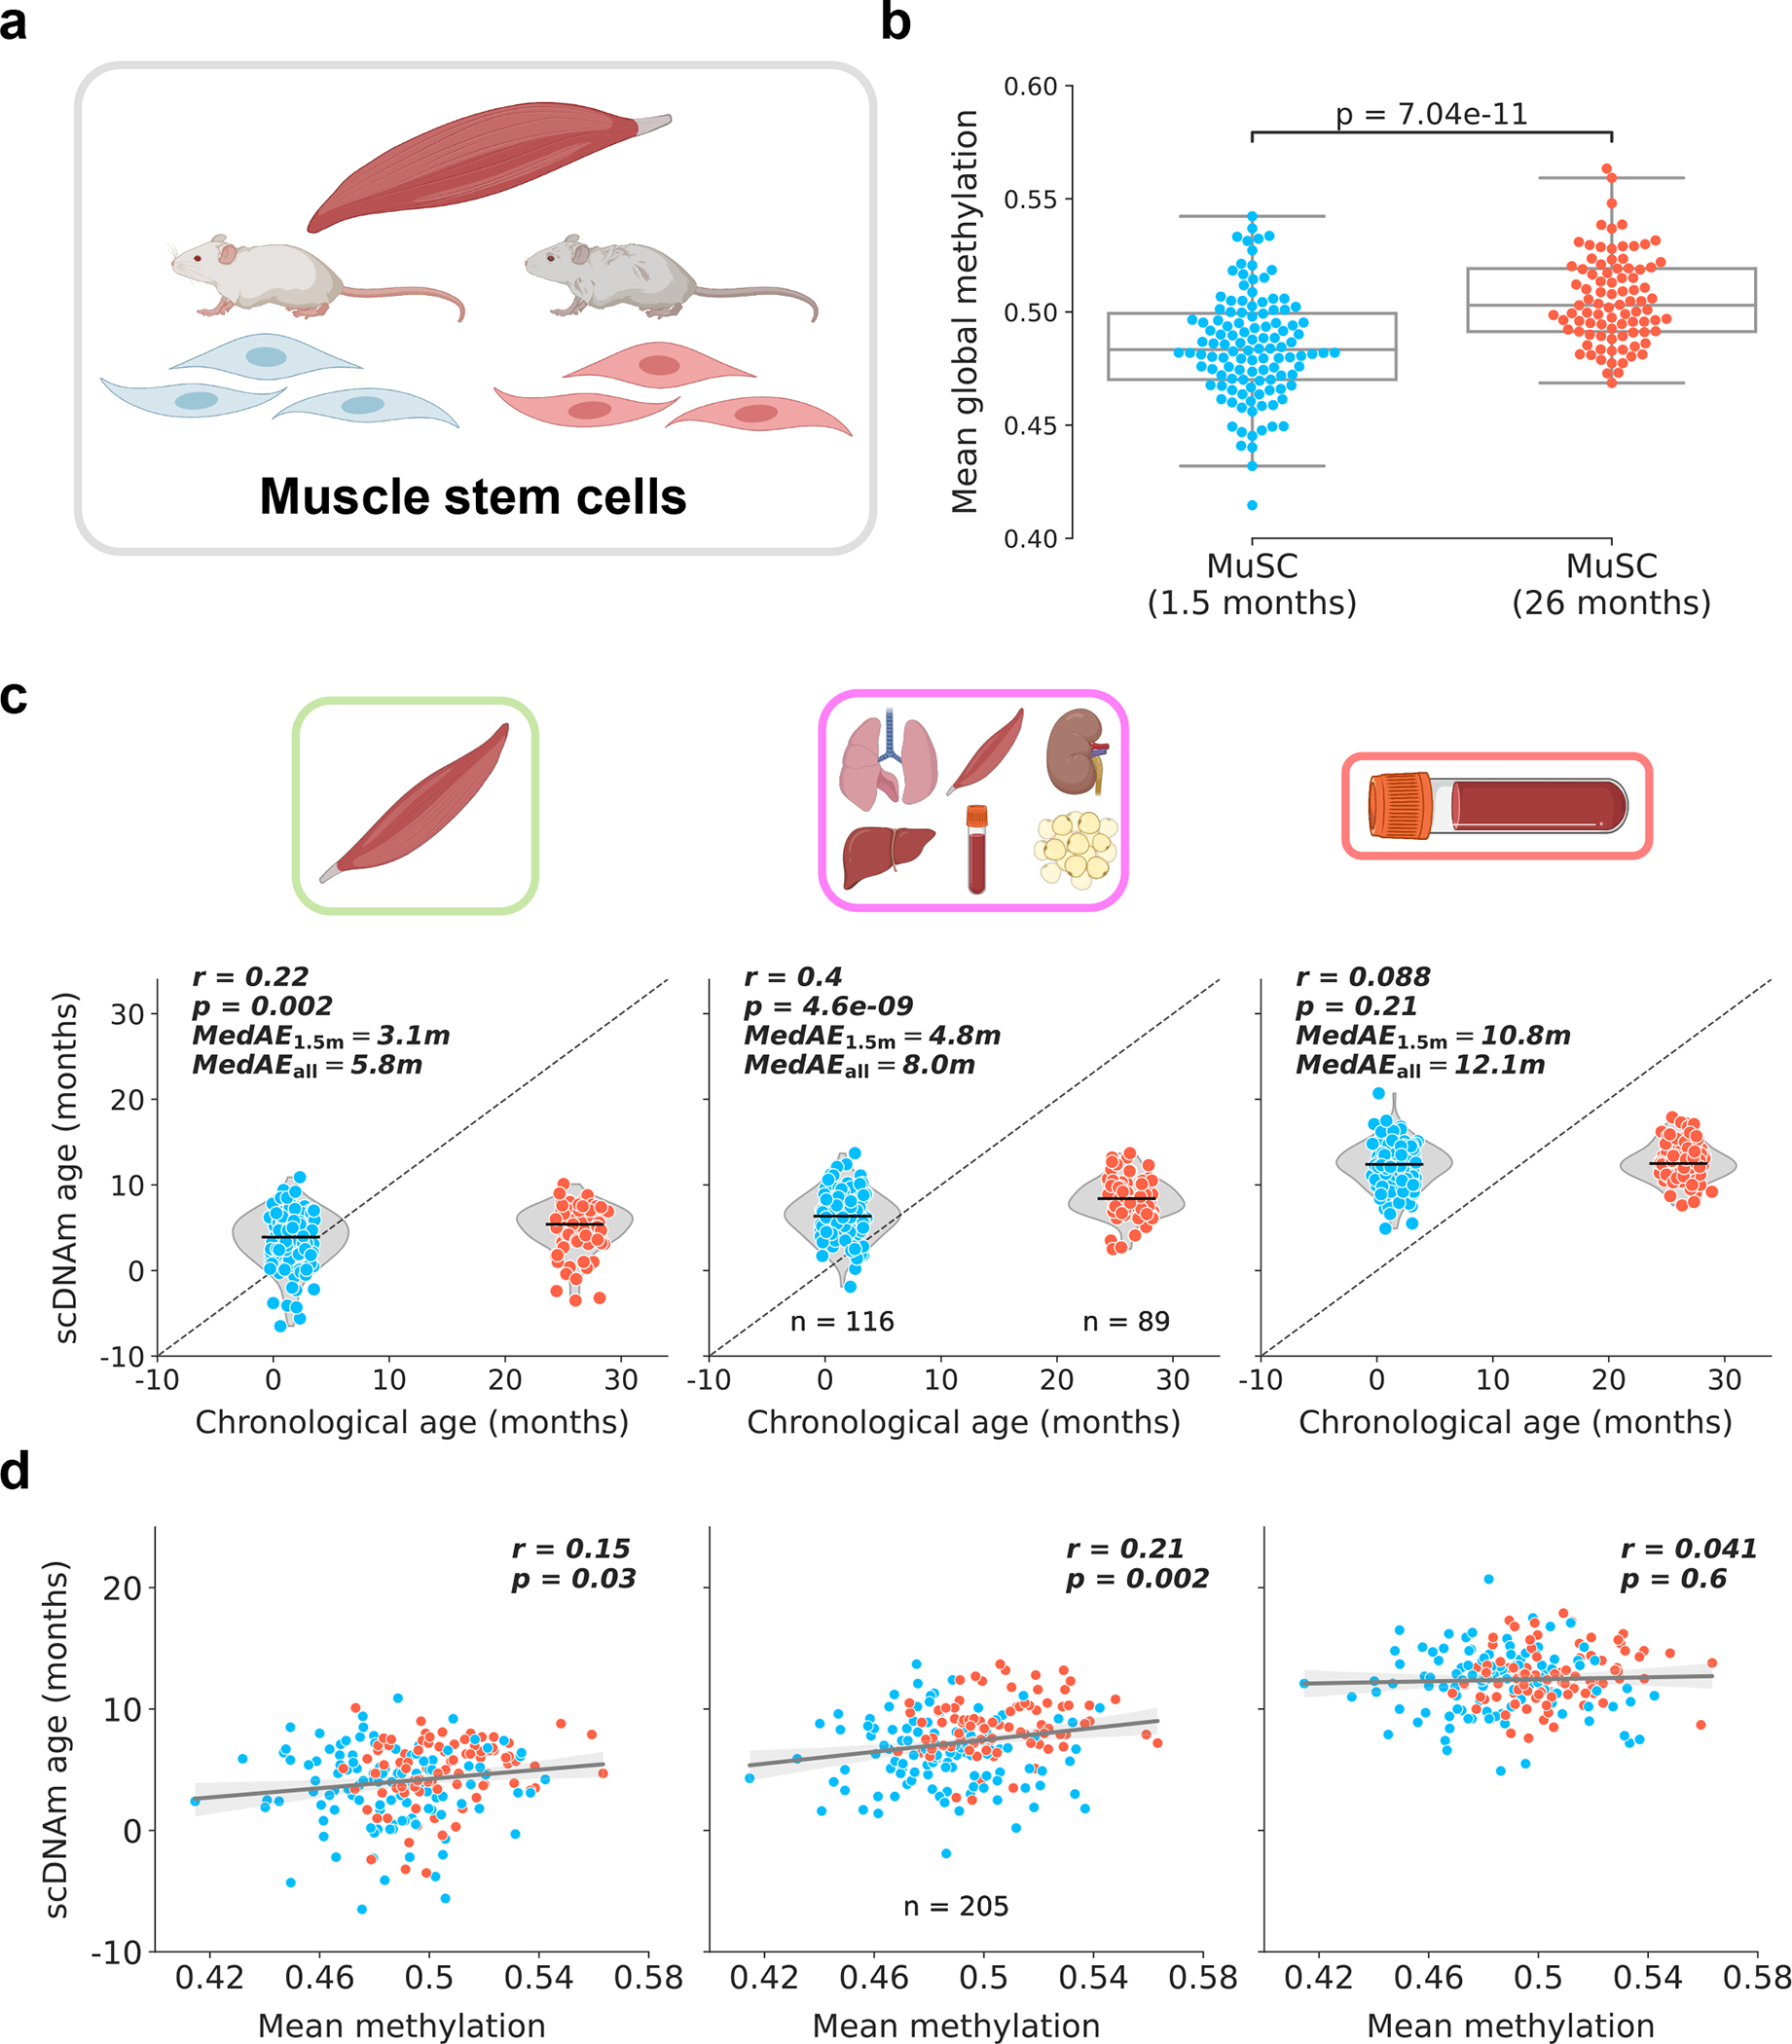
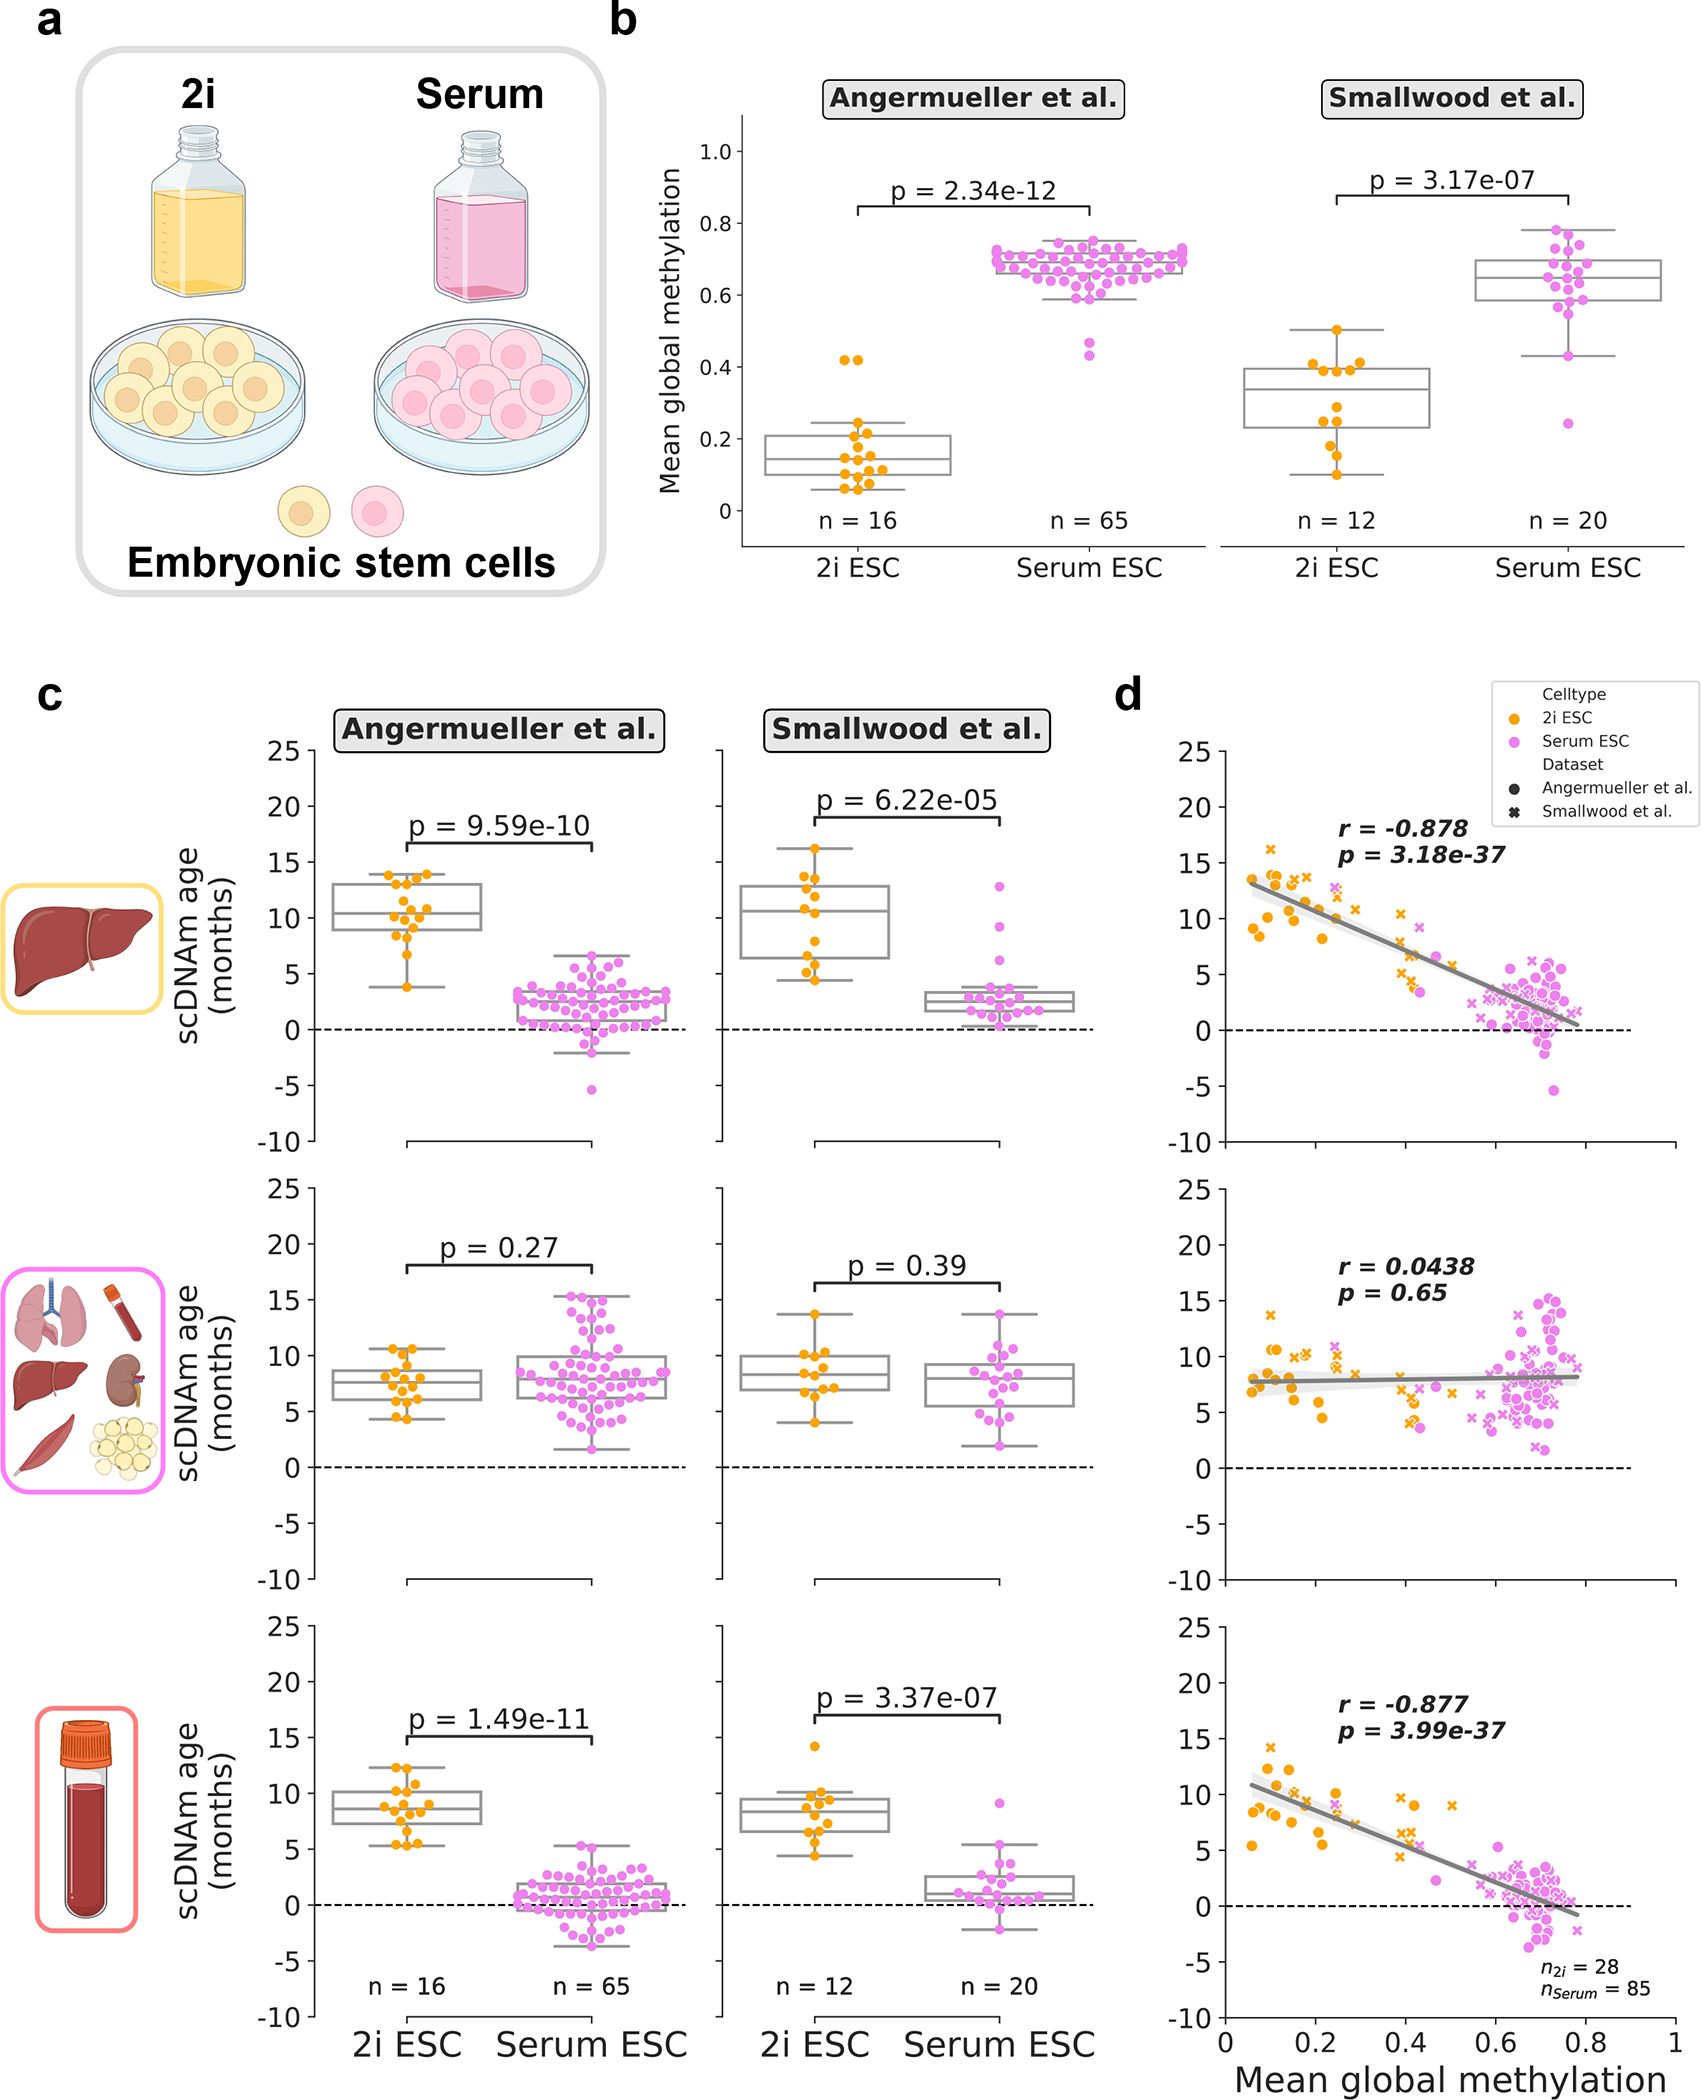
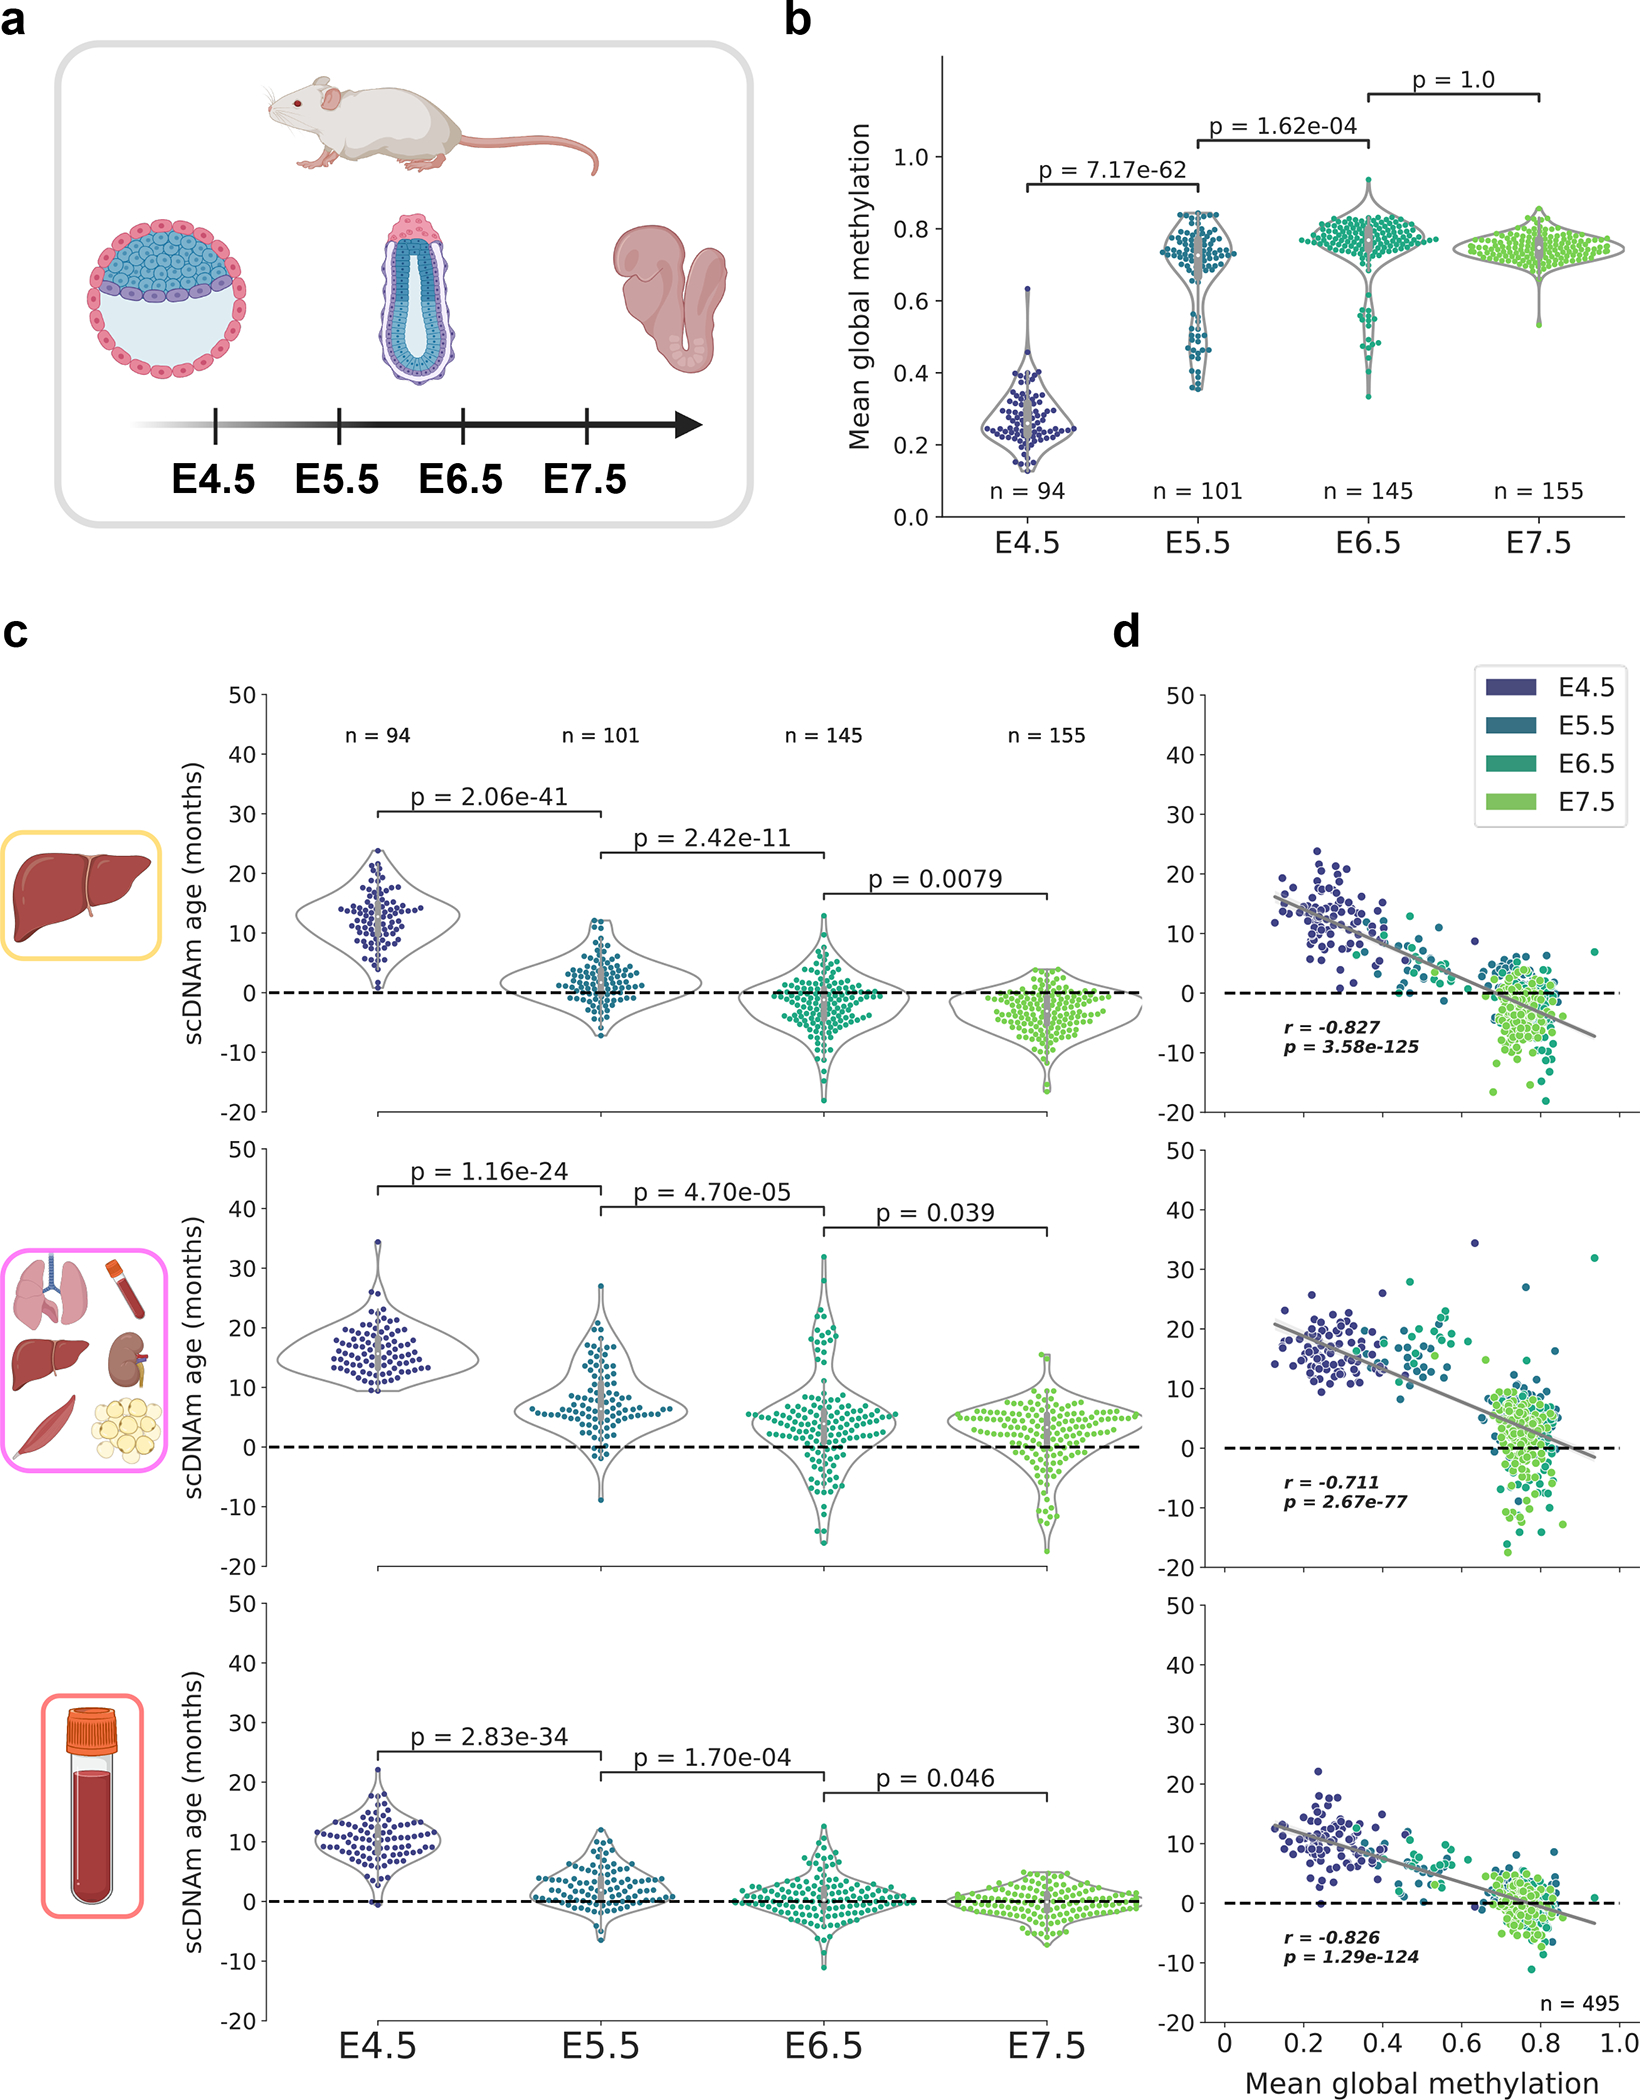
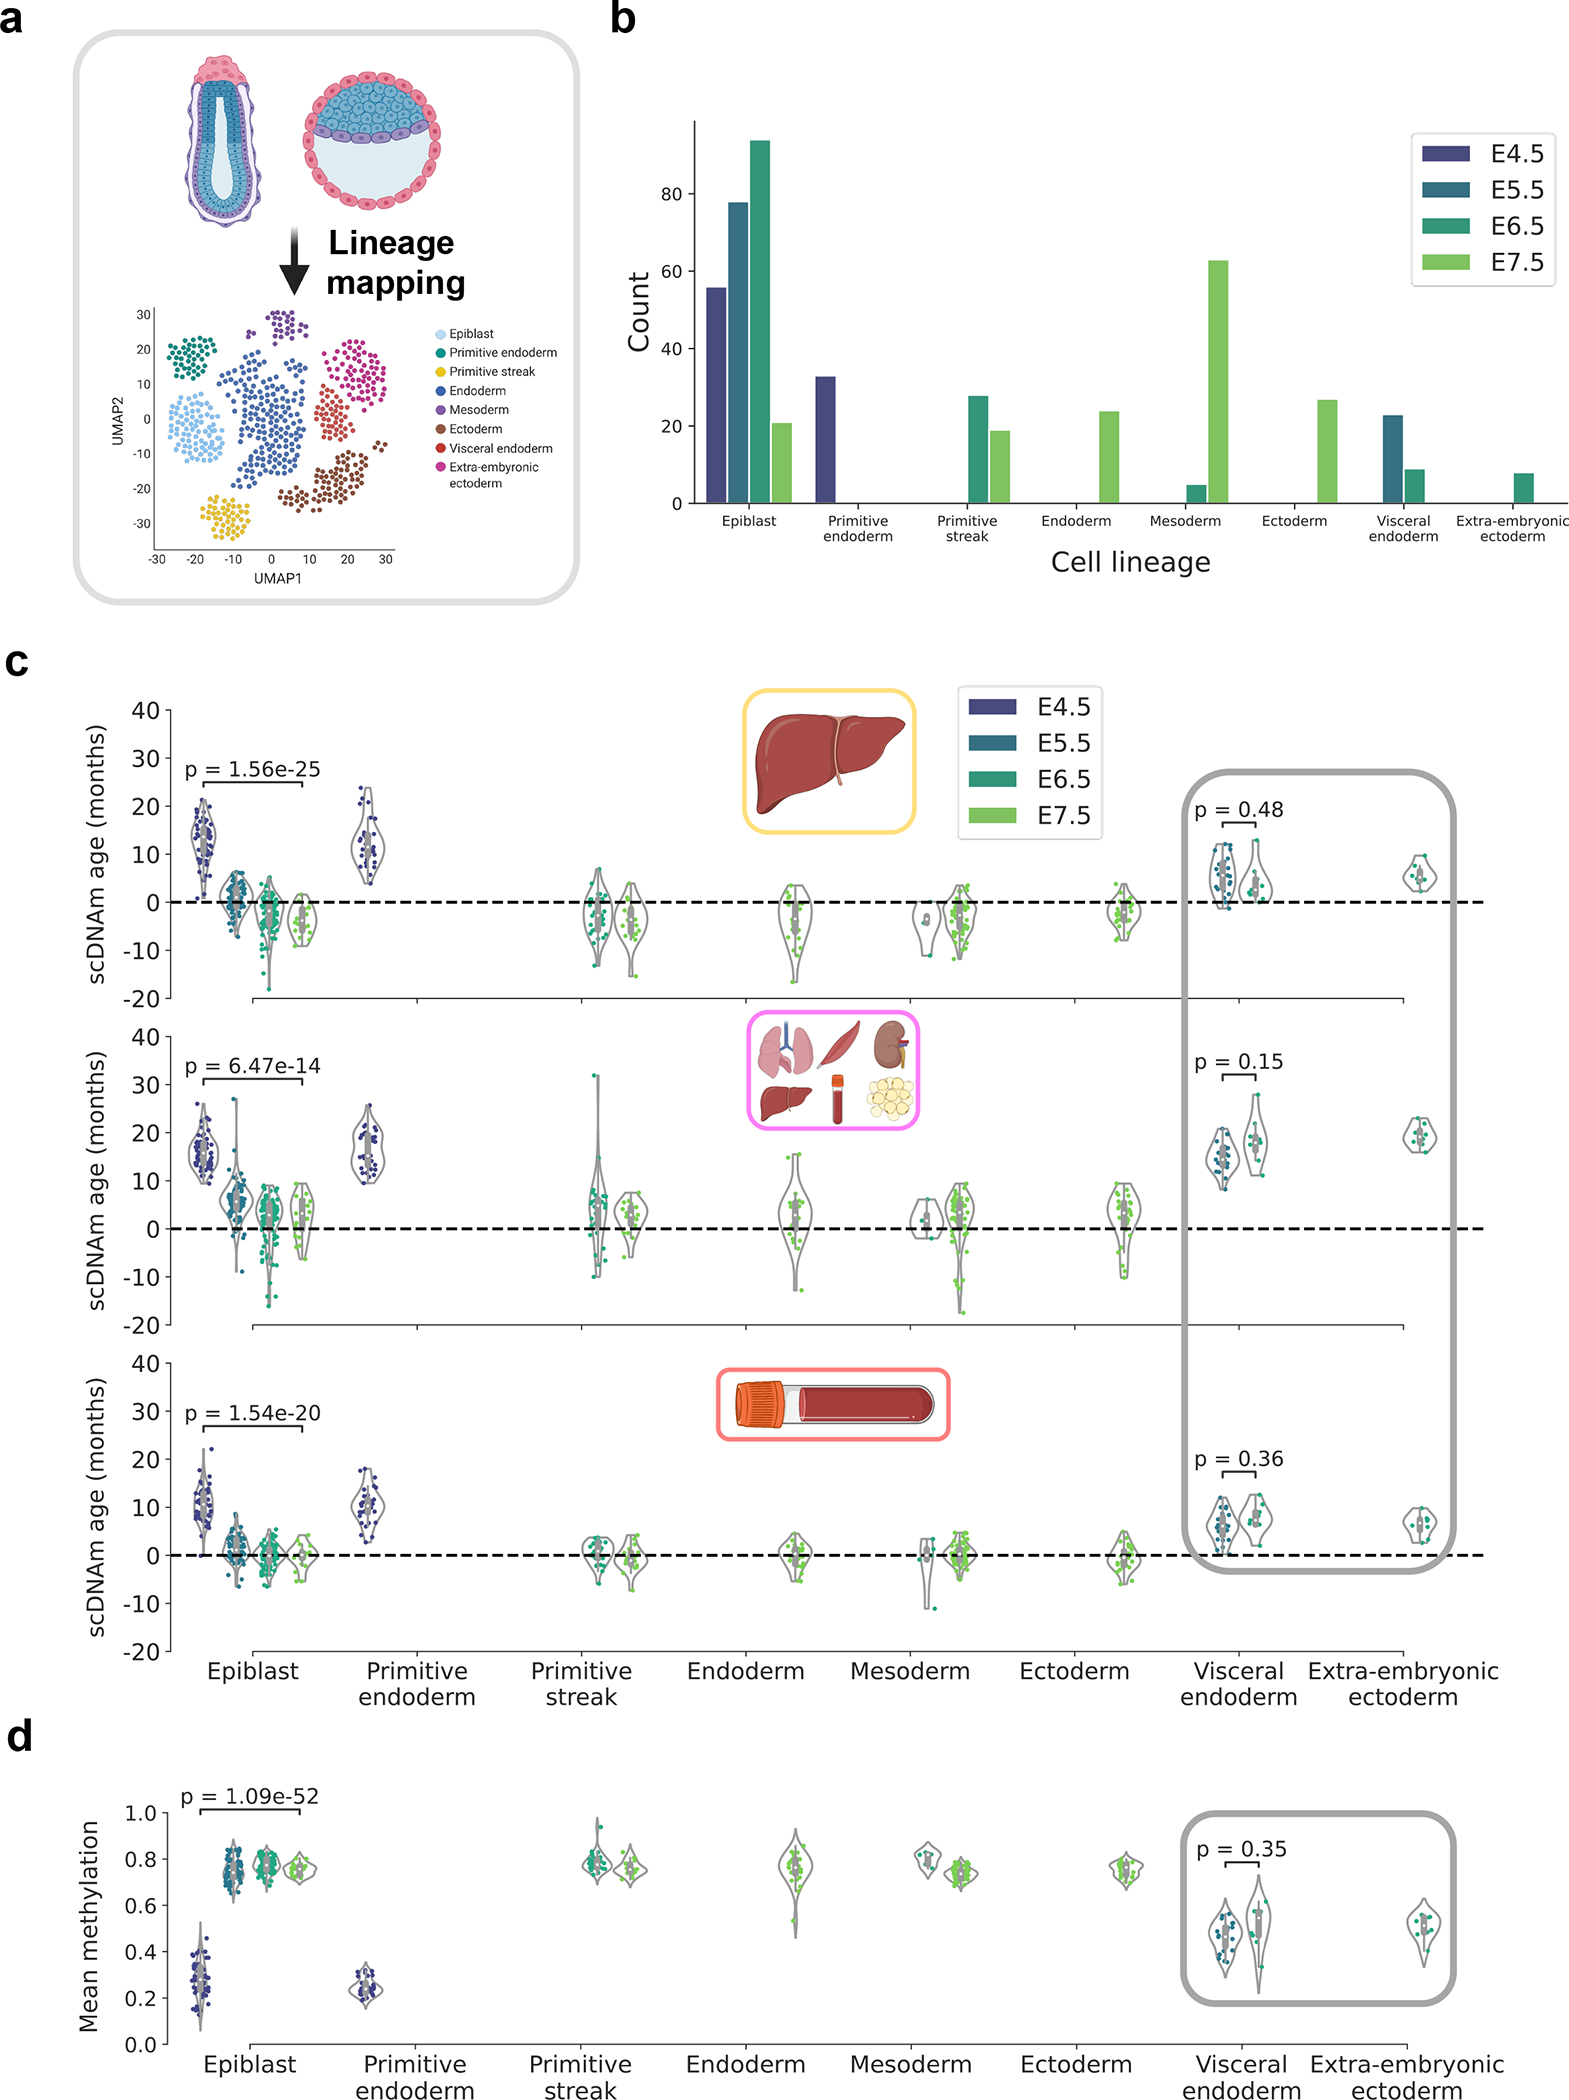
DNA methylation dynamics emerged as a promising biomarker of mammalian aging, with multivariate machine learning models ('epigenetic clocks') enabling measurement of biological age in bulk tissue samples. However, intrinsically sparse and binarized methylation profiles of individual cells have so far precluded the assessment of aging in single-cell data. Here, we introduce scAge, a statistical framework for epigenetic age profiling at single-cell resolution, and validate our approach in mice. Our method recapitulates the chronological age of tissues, while uncovering heterogeneity among cells. We show accurate tracking of the aging process in hepatocytes, demonstrate attenuated epigenetic aging in muscle stem cells, and track age dynamics in embryonic stem cells. We also use scAge to reveal, at the single-cell level, a natural and stratified rejuvenation event occurring during early embryogenesis. We provide our framework as a resource to enable exploration of epigenetic aging trajectories at single-cell resolution.


Conflict of interest statement

COMPETING INTERESTS Brigham and Women’s Hospital is the sole owner of a provisional patent application directed at this invention in which all authors, Alexandre Trapp, Csaba Kerepesi, and Vadim N. Gladyshev, are named inventors.

Figures

Extended Data Figure 1:
Extended Data Figure 1:. Bulk training data characteristics and dimensionality reduction
a) Age distributions for bulk training data in liver (n = 29), blood (n = 50), muscle (n = 24), and multi-tissue (n = 196) datasets, stratified by gender (female, blue; male, orange). b) Principal component analyses (PCA) across 748,955 CpG sites in liver, blood, muscle, and multi-tissue methylation matrices. For single-tissue datasets, black circles encompass samples that were retained for linear model training to exclude outliers and improve model accuracy. The number of samples before and after filtration is shown in the bottom right of each panel. Color scales depict the age in months of the animal (from young, yellow to old, purple). c) Age distribution in the multi-tissue dataset (n = 196), stratified by tissue type (blood, red; liver, orange; muscle, green; kidney, brown; adipose, yellow; lung, pink).
Extended Data Figure 2:
Extended Data Figure 2:. Relationship between age and bulk methylation level in age-associated CpG sites in liver
a) Kernel density estimation plots for the top 5 positively and negatively age-correlated CpG sites in the bulk liver data (based on n = 29 samples). CpG genomic positions are shown above each panel, along with the Pearson correlation coefficient (r) between methylation level and age. Colors correspond to the ages of mice (2m, blue; 10m, orange; 20m, red). b) Representative scatterplots showing the relationship between age and methylation level in strongly positively (left) and negatively (right) age-associated CpG sites. Jitter was applied to the x-axis (age) purely for visualization purposes. Regression lines (grey) with 95% confidence intervals (light grey) are shown. Pearson correlation coefficients (r) and associated p-values (p) are shown. Two-tailed Pearson correlation analysis was employed for statistical testing, with statistics for each model treated independently without correction. Colors correspond to the ages of mice (2m, blue; 10m, orange; 20m, red).
Extended Data Figure 3:
Extended Data Figure 3:. Global methylation, coverage, and scDNAm predictions in embryonic fibroblasts and hepatocytes with outliers
a) Bar plot of mean global methylation (top) and CpG coverage (bottom) in single mouse embryonic fibroblasts and hepatocytes. Each bar represents one cell. MEFs are shown in green, young hepatocytes in blue, and old hepatocytes in red. b) Predicted epigenetic age versus chronological age (top) in all young hepatocytes (blue, n = 11) and old hepatocytes (red, n = 10) across liver (left), multi-tissue (middle) and blood (right) models. Jitter was applied to x-axis (chronological age) strictly for visualization purposes. Pearson correlation (r), the associated p-value (p) and the median absolute error (MedAE) are shown. Two-tailed Pearson correlation analysis was employed for statistical testing with statistics for each model treated independently without correction. Violin plots show kernel density estimation of the data, with the median displayed by a black line. Further analysis of outliers is shown in Extended Data Fig. 7. Dots depict individual cells. c) Predicted epigenetic age, grouped by cell type, across liver (left), multi-tissue (middle) and blood (right) models for MEFs (n = 5, green), young hepatocytes (n = 11, blue), and old hepatocytes (n = 10, red). Two-tailed Welch’s t-test was used for statistical testing, and Bonferroni correction was applied to correct for multiple testing. Box plots show median levels and the first and third quartile, whiskers show up to 1.5× the interquartile range. Dots depict individual cells.
Extended Data Figure 4:
Extended Data Figure 4:. Likelihood distributions in young and old hepatocytes
Likelihood distributions for all young (blue, n = 11) and old (red, n = 10) hepatocytes, based on scDNAm results from the liver model sampling the top 1% age-associated CpGs per cell. Black lines indicate age of maximum likelihood (predicted epigenetic age), which is depicted numerically in the right or left corners of each panel. Labels indicate cell identifier, as given in the study metadata on the SRA. Likelihood was calculated by taking the exponential of the log-likelihood profiles, which was subsequently scaled between 0 and 1 to normalize distributions between cells.
Extended Data Figure 5:
Extended Data Figure 5:. Outlier analysis and lack of relationship between scDNAm age and technical covariates in hepatocytes and fibroblasts
a) Scatterplot depicting the strongly linear relationship between CpG coverage in a single cell (x-axis) and the number of CpGs intersecting with the liver training dataset (y-axis) for embryonic fibroblasts (green, n = 5), young hepatocytes (blue, n = 11) and old hepatocytes (red, n = 10). Regression line (grey) is shown with a 95% confidence interval (light grey). Outlier samples based on scDNAm predictions and PCA analysis in the original study are within the black circle, highlighting these cells are not outliers in regard to CpG coverage. Pearson correlation coefficient (r) and the associated two-tailed p-value (p) are shown. b) Mean global methylation of embryonic fibroblasts (green, n = 5), young (blue, n = 11) and old hepatocytes (red, n = 10). Outlier samples detected during dimensionality reduction and age predictions are circled in black. c, d) Scatterplots depicting the relationship of mean global methylation (left) and CpG coverage (right) with predicted epigenetic age (scDNAm age) for single embryonic fibroblasts (n = 5, green) and hepatocytes (young, n = 11, blue; old, n = 10, red) across liver and multi-tissue datasets with the two outliers included (c) and with the two outliers excluded (d). Regression lines (grey) are shown with a 95% confidence interval (light grey). Two-tailed Pearson correlation analysis was used for statistical testing, with each analysis treated independently without correction. Pearson correlation coefficients (r) and associated two-tailed p-values (p) are shown. No significant relationship is observed in any comparison. The legend in panel (a) applies to all of the panels in this figure.
Extended Data Figure 6:
Extended Data Figure 6:. Pearson correlation distributions and predicted ages in single cells based on various CpG selection parameters
a) Violin plots depicting the distribution of the Pearson correlation coefficient of scAge-chosen CpGs in embryonic fibroblasts (n = 5, green) and hepatocytes (young, n = 11, blue; old, n = 10, red) based on the selection method. On the left, a percentile-based method is employed, whereby the top x% absolute age-associated CpGs are chosen in every cell. On the right, a defined number of CpGs is chosen across every cell, leading to more uneven distributions due to differential cell CpG coverage. Various parameters for both methods (grey boxes) and their effects on the distributions are shown. Violin plots depict kernel density estimations of the data. Inner boxplots depict median levels (white dot) and first and third quartiles, with whiskers extending up to 1.5× the interquartile range. The central legend applies to all subpanels in this panel. b) Predicted epigenetic ages using the liver model for all embryonic fibroblasts (n = 5) and hepatocytes (young, n = 11; old, n = 10), based on the selection method (left, percentile; right, defined number of CpGs) and parameter. Colors depict the % or number of CpGs chosen for scAge computations (top 0.5% or 100 CpGs, blue; top 1% or 500 CpGs, orange; top 5% or 1,000 CpGs, green; top 10% or 5,000 CpGs, red).
Extended Data Figure 7:
Extended Data Figure 7:. Single-cell epigenetic age predictions differ based on selection mode and training dataset
Predicted epigenetic ages in all embryonic fibroblasts (green, n = 5), young hepatocytes (blue, n = 11) and old hepatocytes (red, n = 10) using the liver model (left two columns) and multi-tissue models (right two columns) across different CpG selection modes and parameters. Parameters are labeled in grey boxes above the plots. Bonferroni corrections were applied to account for multiple testing. Pearson correlation (r), its associated p-value (p), and the median absolute error (MedAE) are shown for each panel. Two-tailed Pearson correlation analysis was employed for statistical testing. Dashed lines represent the chronological age of animals from which hepatocytes were obtained (4-months-old, dark blue; 26-months-old, dark red). Boxplots depict median levels and the first/third quartile, with whiskers extending up to 1.5× the interquartile range. Individual cells are depicted as points.
Extended Data Figure 8:
Extended Data Figure 8:. Distribution of Pearson correlation coefficients and linear association metrics across training datasets
a, b) Kernel density estimation plots for (a) Pearson correlation coefficients and (b) linear regression coefficients in processed training reference data for liver (orange), blood (red), muscle (green), and multi-tissue (magenta) datasets. Individual distributions are labeled on the upper right side to indicate which tissue is depicted.
Extended Data Figure 9:
Extended Data Figure 9:. Single-cell coverage distributions and the effect of coverage on scAge predictions
a) Distributions of single-cell CpG coverage across all 5 datasets analyzed in this study. Dotted lines represent the cutoff value that was used for downstream analysis (at least 500,000 CpGs per cell), in line with previous work. Given the low sample size and relatively high coverage, no filtration was applied to cells from the Gravina et al. study. The number of cells passing the filtration cutoff in each dataset is further detailed in Supplementary Table 1. Violin plots depict the kernel density estimation of the data. Inner boxplots depict the median (white dot), as well as the first/third quartile (grey box), with whiskers extending up to 1.5× the interquartile range. Individual dots depict single cells. Colors align with those presented in main figures (Gravina et al: MEFs in green; young hepatocytes in blue; old hepatocytes in red; Hernando-Herraez et al: young MuSCs in blue, old MuSCs in red; Angermueller et al and Smallwood et al: 2i ESCs in yellow, serum ESCs in pink; Argelaguet et al: E4.5 cells in purple, E5.5 cells in dark blue, E6.5 cells in dark green, E7.5 cells in light green). b) Scatterplot depicting the relationship between CpG coverage and predicted epigenetic ages in all unfiltered muscle stem cells (n = 275). Dotted black line represents the cutoff of 500,000 CpGs per cell, after which predictions greatly stabilize. MuSCs from young animals are shown in blue, and those from old animals are shown in red.
Extended Data Figure 10:
Extended Data Figure 10:. Single-cell profile simulations and epigenetic age predictions
a) Heatmap of methylation values in bulk and simulated single-cell profiles. 100 CpGs were randomly selected from a bulk liver sample, and random Bernoulli distributions were used to generate 10 simulated binary profiles per bulk sample. As the bulk methylation level (top) of CpGs increases from left to right, more simulated single-cell profiles are methylated as opposed to unmethylated. Color scale depicts methylation level from unmethylated (0, black) to methylated (1, white). b) Mean global methylation of bulk samples (blue) and 10 simulated full binary profiles per sample (orange) across 29 bulk liver RRBS samples, arranged from young (left) to old (right). Simulated binary profiles cluster with their bulk source, despite shifting from a fractional to a binary data modality. c, d) Predicted epigenetic age for each simulated binary profile with (c) full coverage of 748,955 CpGs per simulated profile and (d) randomly 10x downsampled coverage of 74,896 distinct CpGs per simulated profile. Profiles are arranged from young (left) to old (right). Age of the animals is denoted by the color of the points (2m, light green; 10m, dark green; 20m, dark blue). Two-tailed Pearson correlation analysis was employed for statistical testing, with statistics for each simulation treated independently without correction. The Pearson correlation coefficient (r), the associated two-tailed p-value (p), median absolute error (MedAE) and mean of the standard deviations for each sample (μ(σ)) are shown. Violin plots in (c) and (d) depict the kernel density estimation of the data. Inner boxplots depict the median (white dot), as well as the first/third quartile (grey box), with whiskers extending up to 1.5× the interquartile range. Individual dots depict simulated single cells.
Figure 1:
Figure 1:. Designing the scAge framework
a) Schematic representation of the distinction between single-cell and bulk methylation sequencing outputs. With bulk approaches (right), read coverage is high and consistent between samples. In single cells (left), read coverage is low (often 1) and inconsistent between single cells, resulting in limited, distinct methylome profiles. b) Schematic representation of the scAge framework. The input (left) consists of binary single-cell methylome profiles, coupled with a training reference dataset constructed from bulk samples across a wide age range (top). In turn, the algorithm outputs epigenetic age predictions for each single cell (right). c) Schematic of the intersection and ranking components of the framework. In (i), binary single-cell profiles are intersected with a bulk reference, and only CpGs that are common between a particular single-cell and the reference data are retained. In (ii), a ranking step is implemented that orders and selects CpGs based on their absolute Pearson correlation |r| with age. Common CpGs are filtered depending on the chosen parameter, producing binary matrices of age-associated CpG sites for each single cell (bottom). d) Schematic of the probability computation step of the framework. Linear regression equations relating methylation and age are computed based on bulk data (purple line). Using the observed methylation status of a cell (methylated, orange; unmethylated, green), the probability of observing a particular state is computed as 1 minus the distance between the binary methylation status and the regression line estimate for a particular age. e) Schematic of the maximum likelihood estimation step of the framework. In theory, the product of individual CpG probabilities (left) is taken (assuming independence between CpGs), generating a single probability value for each age. Practically, these fractional products are replaced by logarithmic sums to circumvent underflow errors in computation. An age-likelihood distribution is then obtained for every cell (right), and the age of maximum likelihood is interpreted as the epigenetic age of the cell (young cell in blue, old cell in red).
Figure 2:
Figure 2:. scAge tracks aging in hepatocytes and embryonic fibroblasts
a) Schematic representation of the training scheme for the framework. scAge linear regression models were trained on three tissue-specific methylation matrices (liver, muscle, and blood) and a multi-tissue matrix. More information on training dataset composition can be found in Extended Data Fig. 1. b) Schematic representation of cells analyzed in this figure. The dataset consisted of 26 cells, including 5 embryonic fibroblasts, 11 hepatocytes from young animals (4-months-old) and 10 hepatocytes from old animals (26-months-old). c) Boxplots depicting progressive intersection of all single cell profiles from Gravina et al. (n = 26 single cells). Y-axis is the number of common CpGs between a certain number of profiles, shown here in log-scale. The order of intersection of single-cell profiles was permuted 100 times to generate a distribution for each additional cell added (n = 100 intersection sets/box). Color reflects a gradient of the x-axis, from few intersections (yellow) to many intersections (purple). d) Mean global methylation in all embryonic fibroblasts (green, n = 5), young hepatocytes (blue, n = 11), and old hepatocytes (red, n = 10). Two-tailed Welch’s t-test with Bonferroni correction was used for statistical testing. e) Predicted epigenetic age versus chronological age in young hepatocytes (blue, n = 10) and old hepatocytes (red, n = 9) across liver (left), multi-tissue (middle) and blood (right) models. Jitter was applied to chronological age strictly for visualization purposes. Two outliers, one from each group, were removed based on aberrant PCA clustering in the original study. Plots and metrics with outliers are shown in Extended Data Fig. 3b. Pearson correlation (r), the associated p-value (p), and the median absolute error (MedAE) are shown. Two-tailed Pearson correlation analysis was applied for statistical testing, with statistics for each model computed independently without correction. Violin plots depict kernel density estimations, with the median value highlighted by a black line. Dashed lines depict the identity line between scDNAm age and chronological age. f) Predicted epigenetic age for MEFs (green, n = 5), young hepatocytes (blue, n = 10), and old hepatocytes (red, n = 9) across liver (left), multi-tissue (middle) and blood (right) models. Dashed lines represent the chronological age of animals (blue, 4-months-old; red, 26-months-old). Two-tailed Welch’s t-test with Bonferroni correction was used for statistical testing. Throughout this figure, box plots highlight median levels and the first and third quartile, with whiskers depicting observations up to 1.5× the interquartile range. Dots depict individual cells.
Figure 3:
Figure 3:. Muscle stem cells display attenuated epigenetic aging
a) Schematic representation of cells analyzed in this figure. Muscle stem cells were isolated from skeletal muscle tissue of young (1.5-months-old) and old mice (26-months-old). Only cells with >500,000 CpGs covered were retained for further analysis. See Extended Data Fig. 9a for additional information. b) Mean global methylation in young (blue, n = 116) and old (red, n = 89) filtered cells. Box plots highlight median levels and the first and third quartile, with whiskers depicting observations up to 1.5× the interquartile range. Dots depict individual cells. A single two-tailed Welch’s t-test was used for statistical testing. c) Predicted epigenetic age versus chronological age in young (blue, n = 116) and old (red, n = 89) muscle stem cells across muscle (left), multi-tissue (middle), and blood (right) models. Median absolute error is shown considering all cells (MedAEall: both 1.5-months-old and 26-months-old cells) or just considering young cells (MedAE1.5m: only 1.5-month-old cells). Jitter on the x-axis was applied purely for visualization purposes. Pearson correlation (r) and the associated p-value (p) are shown. Violin plots depict the kernel density estimations of the data, and inner black lines show the median predictions. Two-tailed Pearson correlation analysis was used for statistical testing, with statistics for each model computed independently without correction. d) Predicted epigenetic age versus mean global methylation for both young (blue) and old (red) muscle stem cells (n = 205) across muscle (left), multi-tissue (middle), and blood (right) models. Regression lines (grey) are shown with 95% confidence intervals (light grey). Two-tailed Pearson correlation analysis was used for statistical testing, with statistics for each model treated independently without correction. Pearson correlation coefficient (r) and the associated two-tailed p-value (p) are shown. Individual dots depict single cells throughout the figure.
Figure 4:
Figure 4:. Culture conditions influence epigenetic age in single embryonic stem cells
a) Schematic representation of single cells analyzed in this figure,. Cells were grown in media supplemented with serum, or in serum-free media with the addition of two small-molecule inhibitors (“2i”) for the MEK and GSK3β pathways. b) Mean global methylation profiles of single embryonic stem cells grown in 2i (yellow; nAngermueller = 16, nSmallwood = 12) or serum culture conditions (purple; nAngermueller = 65, nSmallwood = 20). Two-tailed Welch’s t-test was used for statistical testing, with statistics for each dataset treated independently without correction. Box plots highlight median levels and the first and third quartile, with whiskers depicting observations up to 1.5× the interquartile range. Dots depict individual cells. c) Predicted epigenetic ages in 2i (yellow; nAngermueller = 16, nSmallwood = 12) and serum-grown ESCs (purple; nAngermueller = 65, nSmallwood= 20) across liver (top), multi-tissue (middle), and blood (bottom) models. Two-tailed Welch’s t-test was used for statistical testing, with statistics for each model and dataset treated independently without correction. Box plots highlight median levels and the first and third quartile, with whiskers depicting observations up to 1.5× the interquartile range. Dots depict individual cells. d) Scatterplot relationship between predicted epigenetic age and mean global methylation among all embryonic stem cells (n2i = 28, yellow; nserum = 85, purple). Regression lines (grey) are depicted with 95% confidence intervals (light grey). Pearson correlation (r), and the associated p-value (p) are shown. Two-tailed Pearson correlation analysis was used for statistical testing, with statistics for each model and dataset treated independently without correction. Box plots show median levels and the first and third quartile, and whiskers show 1.5× the interquartile range. Dots depict individual cells, with the symbol denoting study of origin.
Figure 5:
Figure 5:. An epigenetic rejuvenation event during mouse embryogenesis
a) Schematic representation of cells analyzed in this figure. Single cells from mouse embryos at four developmental stages (E4.5, E5.5, E6.5, and E7.5) were isolated and sequenced. Only cells with at least 500,000 CpGs covered were retained for downstream analysis (see Extended Data Fig. 9a for additional details). b) Mean global methylation profiles in single cells across all four developmental stages assayed (nE4.5 = 94, purple; nE5.5 = 101, dark blue; nE6.5 = 145, dark green; nE7.5 = 155, light green). Two-tailed Welch’s t-test was used for statistical testing, and Bonferroni corrections were applied to correct for multiple testing. Violin plots depict the kernel density estimations of the data, and inner boxplots (grey) depict median levels and the first and third quartile, with whiskers extending up to 1.5× the interquartile range. Dots depict individual cells. c) Predicted epigenetic ages for cells in all four developmental stages (nE4.5 = 94; nE5.5 = 101, nE6.5 = 145; nE7.5 = 155), across the liver (top), multi-tissue (middle), and blood (bottom) scAge models. Colors correspond to those detailed in (b). Two-tailed Welch’s t-test was used for statistical testing, with Bonferroni corrections applied to correct for multiple testing. Violin plots depict the kernel density estimate of the data, and inner boxplots (grey) depict median levels and the first and third quartile, with whiskers extending up to 1.5× the interquartile range. Dots depict individual cells. d) Scatterplot depicting the relationship between mean global methylation and predicted epigenetic age across all cells (n = 495) in liver (top), multi-tissue (middle), and blood (bottom) models. Colors correspond to those in (b) and in the legend in the top right. Regression lines (grey) are depicted with 95% confidence intervals (light grey). Pearson correlation (r), and the associated p-value (p) are shown. Two-tailed Pearson correlation analysis was used for statistical testing, with statistics for each dataset treated independently without correction.
Figure 6:
Figure 6:. Lineage-specific resolution reveals stratification in the epigenetic rejuvenation event
a) Schematic representation of the transcriptomic mapping procedure used to assign lineage annotations to individual cells, based on multimodal omics data obtained in this study and a reference single-cell gene expression atlas of mouse gastrulation. b) Bar plot of the count of different cell lineages across the four developmental stages, based on lineage annotations provided by the authors. Color scale defines the developmental stage (E4.5, purple; E5.5, dark blue; E6.5, dark green; E7.5, light green). c) Predicted epigenetic ages for single embryonic cells across liver (top), multi-tissue (middle), and blood (bottom) datasets, grouped by assigned lineage and colored by developmental stage (as detailed in (b)). Number of cells for each lineage-stage pair is shown graphically in panel (b): Epiblast — nE4.5 = 56, nE5.5 = 78, nE6.5 = 94, nE7.5 = 21; Primitive endoderm — nE4.5 = 33; Primitive streak — nE6.5 = 28, nE7.5 = 19, Endoderm — nE7.5 = 24 ; Mesoderm — nE6.5 = 5, nE7.5 = 63 ; Ectoderm — nE7.5 = 27; Visceral endoderm — nE5.5 = 23, nE6.5 = 9; Extra-embryonic endoderm — nE6.5 = 8. Gray rectangle denotes supportive extra-embryonic tissues that appear not to undergo rejuvenation. Two-tailed Welch’s t-test was used for statistical testing, and Bonferroni corrections were applied to account for multiple testing. Violin plots depict the kernel density estimate of the data, and inner boxplots (grey) depict median levels and the first and third quartile, with whiskers extending up to 1.5× the interquartile range. Dots depict individual cells. d) Mean global methylation for single embryonic cells grouped by assigned lineage and colored by developmental stage (as in (b)). Number of cells for each lineage-stage pair is shown graphically in panel (b) and is the same as described in (c). Gray rectangle denotes supportive extra-embryonic tissues. Two-tailed Welch’s t-test was used for statistical testing, and Bonferroni corrections were applied to account for multiple testing. Violin plots depict the kernel density estimation of the data, and inner boxplots (grey) depict median levels and the first and third quartile, with whiskers extending up to 1.5× the interquartile range. Dots depict individual cells.

Comment in

Similar articles

Cited by

References

    1. Horvath S & Raj K DNA methylation-based biomarkers and the epigenetic clock theory of ageing. Nat. Rev. Genet. 19, 371–384 (2018). - PubMed
    1. López-Otín C, Blasco MA, Partridge L, Serrano M & Kroemer G The Hallmarks of Aging. Cell 153, 1194–1217 (2013). - PMC - PubMed
    1. Han Y et al. New targeted approaches for epigenetic age predictions. BMC Biol. 18, 71 (2020). - PMC - PubMed
    1. Horvath S DNA methylation age of human tissues and cell types. Genome Biol. 14, 3156 (2013). - PMC - PubMed
    1. Lister R et al. Human DNA methylomes at base resolution show widespread epigenomic differences. Nature 462, 315–322 (2009). - PMC - PubMed

Publication types