Integrated Genotoxicity Testing of three anti-infective drugs using the TGx-DDI transcriptomic biomarker and high-throughput CometChip® assay in TK6 cells
- PMID: 36211197
- PMCID: PMC9540394
- DOI: 10.3389/ftox.2022.991590
Integrated Genotoxicity Testing of three anti-infective drugs using the TGx-DDI transcriptomic biomarker and high-throughput CometChip® assay in TK6 cells
Abstract
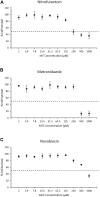
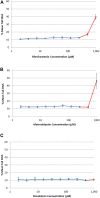
Genotoxicity testing relies on the detection of gene mutations and chromosome damage and has been used in the genetic safety assessment of drugs and chemicals for decades. However, the results of standard genotoxicity tests are often difficult to interpret due to lack of mode of action information. The TGx-DDI transcriptomic biomarker provides mechanistic information on the DNA damage-inducing (DDI) capability of chemicals to aid in the interpretation of positive in vitro genotoxicity data. The CometChip® assay was developed to assess DNA strand breaks in a higher-throughput format. We paired the TGx-DDI biomarker with the CometChip® assay in TK6 cells to evaluate three model agents: nitrofurantoin (NIT), metronidazole (MTZ), and novobiocin (NOV). TGx-DDI was analyzed by two independent labs and technologies (nCounter® and TempO-Seq®). Although these anti-infective drugs are, or have been, used in human and/or veterinary medicine, the standard genotoxicity testing battery showed significant genetic safety findings. Specifically, NIT is a mutagen and causes chromosome damage, and MTZ and NOV cause chromosome damage in conventional in vitro tests. Herein, the TGx-DDI biomarker classified NIT and MTZ as non-DDI at all concentrations tested, suggesting that NIT's mutagenic activity is bacterial specific and that the observed chromosome damage by MTZ might be a consequence of in vitro test conditions. In contrast, NOV was classified as DDI at the second highest concentration tested, which is in line with the fact that NOV is a bacterial DNA-gyrase inhibitor that also affects topoisomerase II at high concentrations. The lack of DNA damage for NIT and MTZ was confirmed by the CometChip® results, which were negative for all three drugs except at overtly cytotoxic concentrations. This case study demonstrates the utility of combining the TGx-DDI biomarker and CometChip® to resolve conflicting genotoxicity data and provides further validation to support the reproducibility of the biomarker.
Keywords: TGx-28.65 genomic biomarker; genetic toxicology; metronidazole; nitrofurantoin; novobiocin; toxicogenomics.
Copyright © 2022 Buick, Rowan-Carroll, Gagné, Williams, Chen, Li, Fornace, Chao, Engelward, Frötschl, Ellinger-Ziegelbauer, Pettit, Aubrecht and Yauk.
Conflict of interest statement
The authors declare that the research was conducted in the absence of any commercial or financial relationships that could be construed as a potential conflict of interest.
Figures


Similar articles
-
A Modern Genotoxicity Testing Paradigm: Integration of the High-Throughput CometChip® and the TGx-DDI Transcriptomic Biomarker in Human HepaRG™ Cell Cultures.Front Public Health. 2021 Aug 18;9:694834. doi: 10.3389/fpubh.2021.694834. eCollection 2021. Front Public Health. 2021. PMID: 34485225 Free PMC article.
-
Flow cytometric micronucleus assay and TGx-DDI transcriptomic biomarker analysis of ten genotoxic and non-genotoxic chemicals in human HepaRG™ cells.Genes Environ. 2020 Feb 4;42:5. doi: 10.1186/s41021-019-0139-2. eCollection 2020. Genes Environ. 2020. PMID: 32042365 Free PMC article.
-
Application of a new approach methodology (NAM)-based strategy for genotoxicity assessment of data-poor compounds.Front Toxicol. 2023 Jan 23;5:1098432. doi: 10.3389/ftox.2023.1098432. eCollection 2023. Front Toxicol. 2023. PMID: 36756349 Free PMC article.
-
TGx-DDI, a Transcriptomic Biomarker for Genotoxicity Hazard Assessment of Pharmaceuticals and Environmental Chemicals.Front Big Data. 2019 Oct 8;2:36. doi: 10.3389/fdata.2019.00036. eCollection 2019. Front Big Data. 2019. PMID: 33693359 Free PMC article. Review.
-
Consensus findings of an International Workshops on Genotoxicity Testing workshop on using transcriptomic biomarkers to predict genotoxicity.Environ Mol Mutagen. 2025 Jan 5. doi: 10.1002/em.22645. Online ahead of print. Environ Mol Mutagen. 2025. PMID: 39757731 Review.
Cited by
-
Role of the antineoplastic drug bleomycin based on toxicogenomic-DNA damage inducing (TGx-DDI) genomic biomarkers data: A meta-analysis.Pak J Med Sci. 2023 Mar-Apr;39(2):423-429. doi: 10.12669/pjms.39.2.7321. Pak J Med Sci. 2023. PMID: 36950431 Free PMC article.
-
Visualization strategies to aid interpretation of high-dimensional genotoxicity data.Environ Mol Mutagen. 2024 Jun;65(5):156-178. doi: 10.1002/em.22604. Epub 2024 May 17. Environ Mol Mutagen. 2024. PMID: 38757760 Free PMC article.
-
Utilization of the CometChip assay for detecting PAH-induced DNA bulky adducts in a 3D primary human bronchial epithelial cell model.Toxicology. 2025 Nov;517:154241. doi: 10.1016/j.tox.2025.154241. Epub 2025 Jul 23. Toxicology. 2025. PMID: 40713011 Free PMC article.
References
-
- Adeleye Y., Andersen M., Clewell R., Davies M., Dent M., Edwards S., et al. (2015). Implementing Toxicity Testing in the 21st Century (TT21C): Making safety decisions using toxicity pathways, and progress in a prototype risk assessment. Toxicology 332, 102–111. 10.1016/j.tox.2014.02.007 - DOI - PubMed
-
- Becker R. A., Chambers J. M., Wilks A. R. (1988). The new S language: A programming environment for data analysis and graphics. Wadsworth & Brooks/Cole.
-
- Blass B. E. (2015). Basic principles of drug discovery and development. Elsevier.
-
- Buick J. K., Moffat I., Williams A., Swartz C. D., Recio L., Hyduke D. R., et al. (2015). Integration of metabolic activation with a predictive toxicogenomics signature to classify genotoxic versus nongenotoxic chemicals in human TK6 cells. Environ. Mol. Mutagen. 56, 520–534. 10.1002/em.21940 - DOI - PMC - PubMed
-
- Buick J. K., Williams A., Gagné R., Swartz C. D., Recio L., Ferguson S. S., et al. (2020). Flow cytometric micronucleus assay and TGx-DDI transcriptomic biomarker analysis of ten genotoxic and non-genotoxic chemicals in human HepaRG™ cells. Genes Environ. 42, 5. 10.1186/s41021-019-0139-2 - DOI - PMC - PubMed
Grants and funding
LinkOut - more resources
Full Text Sources
Molecular Biology Databases

