Relationship of persistent lymphocytosis, antibody titers, and proviral load with expression of interleukin-12, interferon-γ, interleukin-2, interleukin-4, interleukin-10, and transforming growth factor-β in cows infected with bovine leukemia virus from a high-prevalence dairy complex
- PMID: 36211217
- PMCID: PMC9536356
Relationship of persistent lymphocytosis, antibody titers, and proviral load with expression of interleukin-12, interferon-γ, interleukin-2, interleukin-4, interleukin-10, and transforming growth factor-β in cows infected with bovine leukemia virus from a high-prevalence dairy complex
Abstract
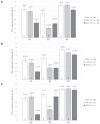
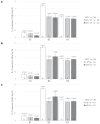
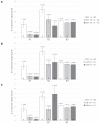
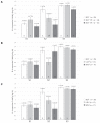
Bovine leukemia virus (BLV) subclinical infection promotes persistent lymphocytosis (PL), which is related to susceptibility and progression to lymphoma. Moreover, lymphocyte counts directly correlate with BLV antibody titers and proviral load, and cell immune responses are considered atypical due to immune suppression. In order to determine the relationship of PL, antibody titers, and proviral load with interleukin (IL)-12, interferon (IFN)-γ, IL-2, IL-4, IL-10, and transforming growth factor (TGF)-β expression in a 3-month interval, 58 cows were selected (30 BLV+ and 28 BLV-) from a high-prevalence dairy herd to complete 3 monthly blood samplings for the assessment of PL, BLV antibody titers, BLV proviral load, and IL-12, IFN-γ, IL-2, IL-4, IL-10, and TGF-β expression. At sampling conclusion, the BLV-infected cows were grouped according to PL, BLV proviral load, and BLV antibody titers as follows: BLV+PL+ (n = 16) and BLV+PL- (n = 14); high proviral load (HPL) (n = 18) and low proviral load (LPL) (n = 13); high antibody titers (HAT) (n = 17) and low antibody titers (LAT) (n = 14). The BLV+PL+ cows showed significantly higher proviral load and antibody titers than the BLV+PL- group; however, the former suggested spread presumably unrelated to lymphoma outcome, because HPL was observed in PL- cows in the last sampling. Consistent with the data, a higher antibody response strongly indicated BLV susceptibility since it was linked to PL+ occurrence and a cytokine profile compatible with immune suppression. Furthermore, a reversion to lower antibody titers was observed in cows with HPL far ahead of time, most likely due to long-term immune suppression. In addition, high expression of IL-10 and TGF-β was associated with reduced IL-12, IFN-γ, IL-2, and IL-4 expression alongside PL, HAT, and HPL in BLV-infected cows, suggesting an IL-10- and TGF-β-induced immune suppression. The IL-10 expression was increasing throughout, implying disease progression, as described. In conclusion, the proliferative expansion of lymphocytes known as PL might enhance a regulatory-rich cell population (Bregs and/or Tregs) that secretes IL-10 and TGF-β, leading to immune suppression. Further studies must be conducted regarding the types of regulatory cells involved in BLV-induced immune suppression.
L’infection subclinique par le virus de la leucémie bovine (BLV) favorise une lymphocytose persistante (PL), qui est liée à la susceptibilité et à la progression vers le lymphome. De plus, le nombre de lymphocytes est directement corrélé aux titres d’anticorps BLV et à la charge provirale, et les réponses immunitaires cellulaires sont considérées comme atypiques en raison de la suppression immunitaire. Afin de déterminer la relation entre PL, les titres d’anticorps et la charge provirale avec l’interleukine (IL)-12, l’interféron (IFN)-γ, l’IL-2, l’IL-4, l’IL-10 et l’expression du facteur de croissance transformant (TGF)-β dans un intervalle de 3 mois, 58 vaches ont été sélectionnées (30 BLV+ et 28 BLV−) à partir d’un troupeau laitier à forte prévalence pour compléter trois prélèvements sanguins mensuels pour l’évaluation de PL, des titres d’anticorps BLV, de la charge provirale BLV et l’expression d’IL-12, IFN-γ, d’IL-2, d’IL-4, d’IL-10 et TGF-β. À la fin de l’échantillonnage, les vaches infectées par le BLV ont été regroupées en fonction du PL, de la charge provirale du BLV et des titres d’anticorps du BLV comme suit : BLV+PL+ (n = 16) et BLV+PL− (n = 14); charge provirale élevée (HPL) (n = 18) et charge provirale faible (LPL) (n = 13); titres d’anticorps élevés (HAT) (n = 17) et titres d’anticorps faibles (LAT) (n = 14). Les vaches BLV+PL+ ont montré une charge provirale et des titres d’anticorps significativement plus élevés que le groupe BLV+PL−; cependant, le premier suggère une propagation vraisemblablement sans rapport avec l’issue du lymphome, car HPL a été observé chez les vaches PL− lors du dernier échantillonnage. Conformément aux données, une réponse anticorps plus élevée indiquait fortement une sensibilité au BLV puisqu’elle était liée à l’apparition de PL+ et à un profil de cytokines compatible avec la suppression immunitaire. De plus, un retour à des titres d’anticorps plus faibles a été observé chez les vaches atteintes de HPL bien avant le temps, probablement en raison d’une immunosuppression à long terme. De plus, une expression élevée d’IL-10 et de TGF-β était associée à une expression réduite d’IL-12, d’IFN-γ, d’IL-2 et d’IL-4 aux côtés de PL, HAT et HPL chez les vaches infectées par le BLV, suggérant une immunosuppression induite par IL-10 et le TGF-β. L’expression d’IL-10 augmentait tout au long, impliquant une progression de la maladie, comme décrit. En conclusion, l’expansion proliférative des lymphocytes connus sous le nom de PL pourrait renforcer une population de cellules riches en régulation (Bregs et/ou Tregs) qui sécrète d’IL-10 et du TGF-β, conduisant à une suppression immunitaire. D’autres études doivent être menées sur les types de cellules régulatrices impliquées dans la suppression immunitaire induite par le BLV.(Traduit par Docteur Serge Messier).
Copyright and/or publishing rights held by the Canadian Veterinary Medical Association.
Figures


References
-
- Juliarena MA, Gutierrez SE, Ceriani C. Determination of proviral load in bovine leukemia virus-infected cattle with and without lymphocytosis. Am J Vet Res. 2007;68:1220–1225. - PubMed
-
- Trainin Z, Brenner J, Meirom R, Ungar-Waron H. Detrimental effect of bovine leukemia virus (BLV) on the immunological state of cattle. Vet Immunol Immunopathol. 1996;54:293–302. - PubMed
-
- Ferrer JF, Marshak RR, Abt DA, Kenyon SJ. Persistent lymphocytosis in cattle: Its cause, nature and relation to lymphosarcoma. Ann Rech Vet. 1978;9:851–857. - PubMed
-
- Konnai S, Usui T, Ikeda M, et al. Imbalance of tumor necrosis factor receptors during progression in bovine leukemia virus infection. Virology. 2005;339:239–248. - PubMed
MeSH terms
Substances
LinkOut - more resources
Full Text Sources
Research Materials
