. 2022 Sep 21:13:1005790.
doi: 10.3389/fimmu.2022.1005790. eCollection 2022.

The impact of pre-transplant donor specific antibodies on the outcome of kidney transplantation - Data from the Swiss transplant cohort study

Collaborators, Affiliations

The impact of pre-transplant donor specific antibodies on the outcome of kidney transplantation - Data from the Swiss transplant cohort study

Lukas Frischknecht et al. Front Immunol. .

Abstract

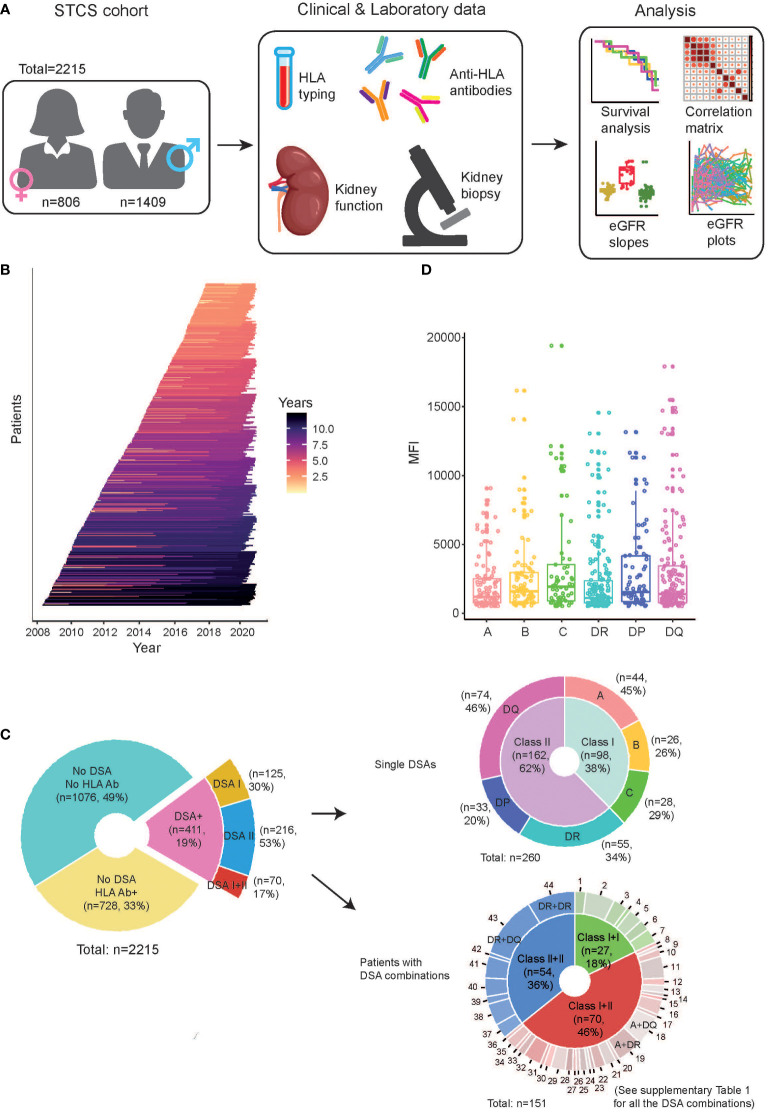
Background: Pre-transplant donor specific antibodies (DSA), directed at non-self human leukocyte antigen (HLA) protein variants present in the donor organ, have been associated with worse outcomes in kidney transplantation. The impact of the mean fluorescence intensity (MFI) and the target HLA antigen of the detected DSA has, however, not been conclusively studied in a large cohort with a complete virtual cross-match (vXM).

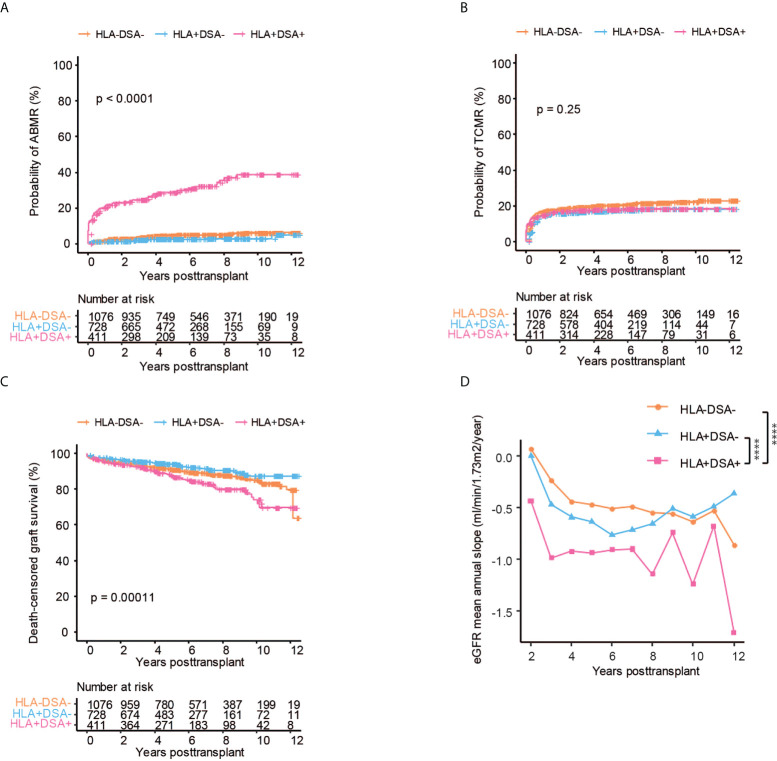
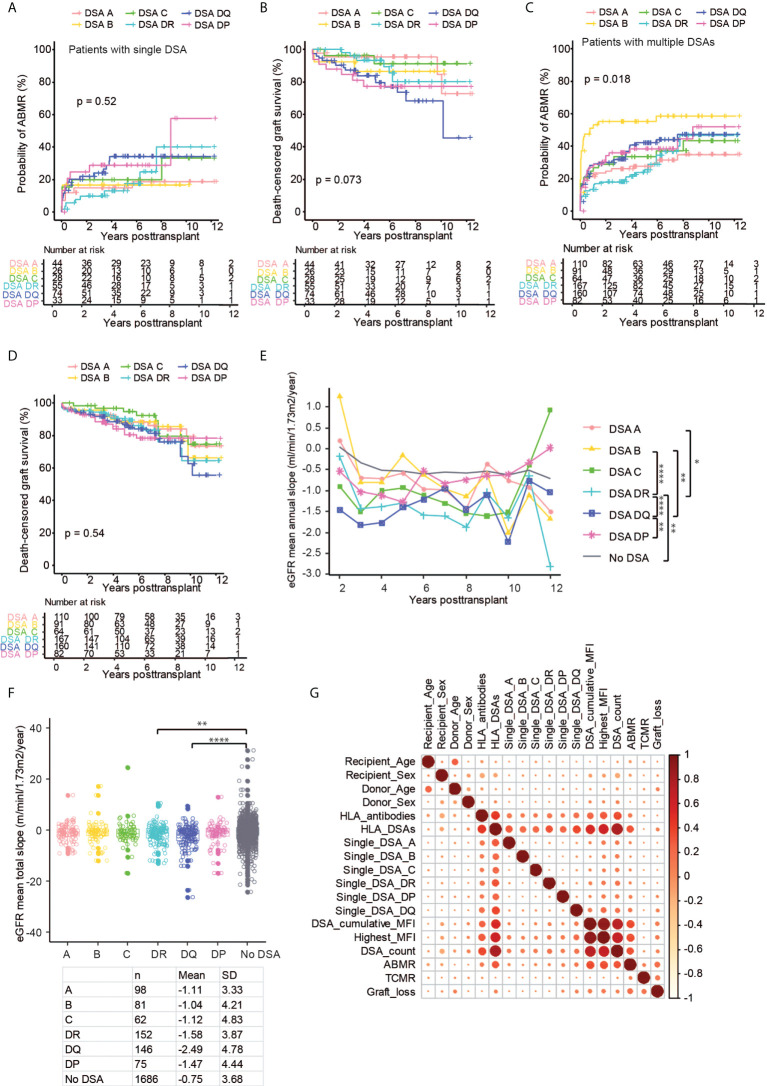
Methods: We investigated the effect of pre-transplant DSA on the risk of antibody-mediated rejection (ABMR), graft loss, and the rate of eGFR decline in 411 DSA positive transplants and 1804 DSA negative controls.

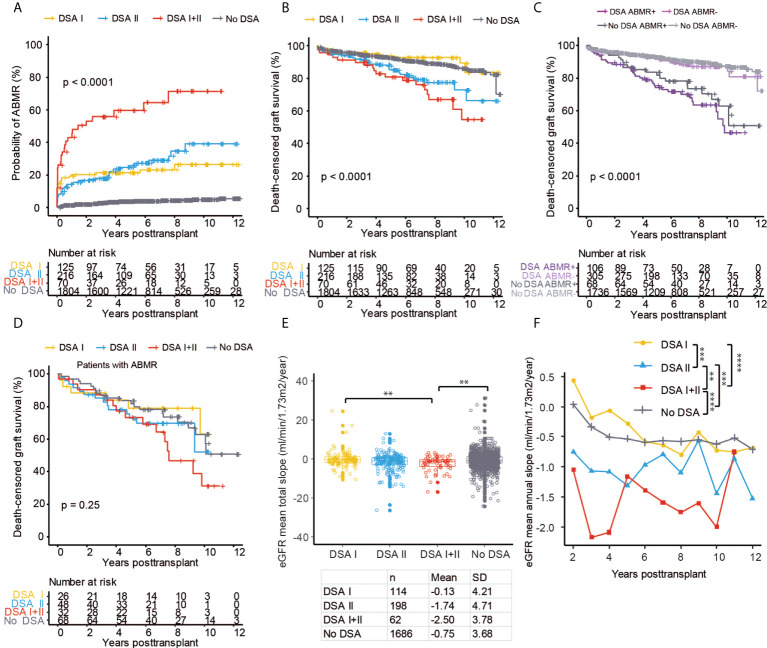
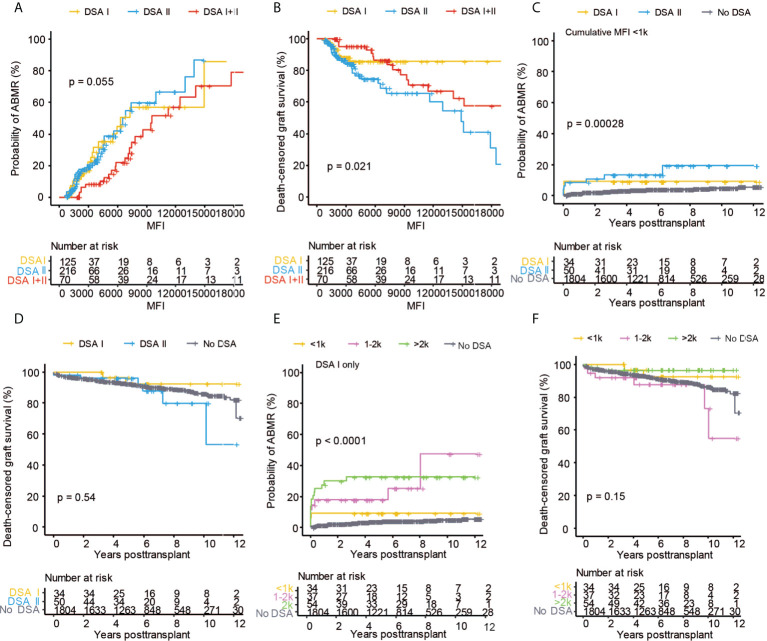
Results: Pre-transplant DSA were associated with a significantly increased risk of ABMR, graft loss, and accelerated eGFR decline. DSA directed at Class I and Class II HLA antigens were strongly associated with increased risk of ABMR, but only DSA directed at Class II associated with graft loss. DSA MFI markedly affected outcome, and Class II DSA were associated with ABMR already at 500-1000 MFI, whereas Class I DSA did not affect outcome at similar low MFI values. Furthermore, isolated DSA against HLA-DP carried comparable risks for ABMR, accelerated eGFR decline, and graft loss as DSA against HLA-DR.

Conclusion: Our results have important implications for the construction and optimization of vXM algorithms used within organ allocation systems. Our data suggest that both the HLA antigen target of the detected DSA as well as the cumulative MFI should be considered and that different MFI cut-offs could be considered for Class I and Class II directed DSA.

Keywords: abmr; donor specific antibodies; graft loss; kidney transplantation; virtual cross-match.


Conflict of interest statement

The authors declare that the research was conducted in the absence of any commercial or financial relationships that could be construed as a potential conflict of interest.

Figures

Figure 1
Figure 1
Characteristics of the study cohort. (A) Schematic of the workflow illustrating the study overview, the data collection from the clinical and laboratory observations, and main types of analyses in this study. (B) The timeline of the study follow-up on individual patients included after kidney transplantation. The individual lines are colored according to length of follow-up. (C) Overview of the patients with regard to the presence of HLA antibodies (HLA Ab) and DSA. In the samples containing DSA, they are further stratified as “single DSAs”, which refer to patients having only one DSA, as well as “patients with DSA combinations”, which refer to patients having multiple DSA. (D) The distribution of MFI of each DSA directed against individual HLA loci in the investigated patients.
Figure 2
Figure 2
The presence of HLA-DSA is associated with an increased risk of ABMR, graft loss, and loss of kidney function. Cumulative incidence of ABMR (A), TCMR (B), death-censored graft survival (C), and the collective mean annual slope of eGFR (D) in patients without anti-HLA antibodies and without DSA (HLA-DSA-), with anti-HLA antibodies but without DSA (HLA+DSA-) and in patients with DSA (HLA+DSA+) respectively. Log-rank test was used to test p value of the Kaplan-Meier survival curves for (A–C). Two-way ANOVA analysis with Sidak’s multiple comparisons as a post hoc test was used for (D) to assess p values; ****p < 0.0001.
Figure 3
Figure 3
Pre-transplant DSA directed against HLA Class II antigens showed significantly worse outcomes after kidney transplantation. Cumulative incidence of ABMR (A) and death-censored graft survival (B) in the patient groups with DSA directed against HLA Class I (DSA I), HLA Class II (DSA II), or a combination of Class I and Class II (DSA I+II) and in patients with no DSA. (C) Cumulative incidence of death-censored graft survival in the cohort stratified into groups based on the presence or absence of DSA and ABMR. (D) Death-censored graft survival in patients with ABMR stratified into DSA I, DSA II, DSA I+II, and no DSA groups. The collective mean total slope (E) and mean annual slope (F) of eGFR in the DSA I, DSA II, DSA I+II, and no DSA groups. Log-rank test was used to test p value of the Kaplan-Meier survival curves for (A–D). One-way ANOVA followed by Dunn’s post hoc test for (E) and two-way ANOVA analysis with Sidak’s multiple comparisons as a post hoc test were used for (F) to assess p values; **p < 0.01, ***p < 0.001, ****p < 0.0001.
Figure 4
Figure 4
The MFI of the pre-transplant DSA has a large impact on kidney transplant outcome. Cumulative incidence of ABMR (A), death-censored graft survival (B), the collective mean total slope (C), and mean annual slope of eGFR (D) in DSA positive patients stratified on the total cumulative MFI into <1k, 1k-5k, 5k-10k, >10k MFI as well as patients with no DSA. Cumulative incidence of ABMR (E), death-censored graft survival (F), and the collective mean total slope (G) in DSA positive patients stratified on the single highest MFI of the detected DSA into groups with <1k, 1k-2k, 2k-5k >5k MFI as well as patients with no DSA. (H) Correlation heat map of kidney transplantation outcome (ABMR, TCMR, and graft loss) with DSA and clinical variables among all the patients. Dot sizes and colors correspond to the Spearman’s correlation coefficient. Log-rank test was used to test p value of the Kaplan-Meier survival curves for (A, B) and (E, F). One-way ANOVA followed by Dunn’s post hoc test for (C) and (G) and two-way ANOVA analysis with Sidak’s multiple comparisons as a post hoc test were used for (D) to assess p values; *p < 0.05, **p < 0.01.
Figure 5
Figure 5
The MFI of pre-transplant DSA directed against HLA class I and II show a different impact on kidney transplant outcome. Cumulative incidence of ABMR (A) and death-censored graft survival (B) in the DSA I, DSA II, DSA I+II groups with regard to cumulative DSA MFI value. Cumulative incidence of ABMR (C) and death-censored graft survival (D) in the DSA I and DSA II groups in patients with a cumulative MFI of <1k. Cumulative incidence of ABMR (E) and death-censored graft survival (F) of patients with only DSA I stratified into groups based on cumulative MFI of <1k, 1k-2k, and >2k. Log-rank test was used to test p value of the Kaplan-Meier survival curves for (A–F).
Figure 6
Figure 6
The impact of the HLA target loci on kidney transplant outcomes in patients with single and multiple DSA. Cumulative incidence of ABMR (A) and death-censored graft survival (B) in patients with a single DSA directed against HLA-A (DSA A), HLA-B (DSA B), HLA-C (DSA C), HLA-DR (DSA DR), HLA-DQ (DSA DQ) and HLA-DP (DSA DP). Cumulative incidence of ABMR (C), death-censored graft survival (D), the collective mean total slope (E), and mean annual slope of eGFR (F) in the patients with combinations of DSA, denoted as mentioned previously. (G) Correlation heat map of kidney transplantation outcome (ABMR, TCMR, and graft loss) DSA characteristics and clinical variables among all investigated patients. Log-rank test was used to test p value of the Kaplan-Meier survival curves for (A–D). One-way ANOVA followed by Dunn’s post hoc test for (E) and two-way ANOVA analysis with Sidak’s multiple comparisons as a post hoc test were used for (F) to assess p values; *p < 0.05, **p < 0.01, ****p < 0.0001.
Figure 7
Figure 7
Partial least squares (PLS) regression biplot for the first two components in graft loss. Correlation shown between graft loss (txFailure) and the risk factors (in blue numbers). The first two axes which correspond to PLS components 1 and 2 are shown. The distance between the individual risk factors and the center indicates the strength of the correlation with each component and their alignments represent the correlation they contribute to the variation explained by each component within the model. (OrganTx, Organ Transplantation; BlTransfusion, Blood Transfusion).

References

    1. Sayegh MH, Carpenter CB. Transplantation 50 years later: Progress, challenges, and promises. N Engl J Med (2004) 351(26):2761–6. doi: 10.1056/NEJMon043418 - DOI - PubMed
    1. Wekerle T, Segev D, Lechler R, Oberbauer R. Strategies for long-term preservation of kidney graft function. Lancet (2017) 389:2152–62. doi: 10.1016/s0140-6736(17)31283-7 - DOI - PubMed
    1. Loupy A, Lefaucheur C. Antibody-mediated rejection of solid-organ allografts. N Engl J Med (2018) 379:1150–60. doi: 10.1056/NEJMra1802677 - DOI - PubMed
    1. Sellarés J, de Freitas DG, Mengel M, Reeve J, Einecke G, Sis B, et al. . Understanding the causes of kidney transplant failure: The dominant role of antibody-mediated rejection and nonadherence. Am J Transplant (2012) 12:388–99. doi: 10.1111/j.1600-6143.2011.03840.x - DOI - PubMed
    1. Webster AC, Pankhurst T, Rinaldi F, Chapman JR, Craig JC. Monoclonal and polyclonal antibody therapy for treating acute rejection in kidney transplant recipients: A systematic review of randomized trial data. Transplantation (2006) 81:953–65. doi: 10.1097/01.tp.0000215178.72344.9d - DOI - PubMed

Publication types