. 2022 Sep 23:13:933241.
doi: 10.3389/fimmu.2022.933241. eCollection 2022.

Cuproptosis-related modification patterns depict the tumor microenvironment, precision immunotherapy, and prognosis of kidney renal clear cell carcinoma

Affiliations

Cuproptosis-related modification patterns depict the tumor microenvironment, precision immunotherapy, and prognosis of kidney renal clear cell carcinoma

Zhiyong Cai et al. Front Immunol. .

Abstract

Background: Due to the different infiltration abundance of immune cells in tumor, the efficacy of immunotherapy varies widely among individuals. Recently, growing evidence suggested that cuproptosis has impact on cancer immunity profoundly. However, the comprehensive roles of cuproptosis-related genes in tumor microenvironment (TME) and in response to immunotherapy are still unclear.

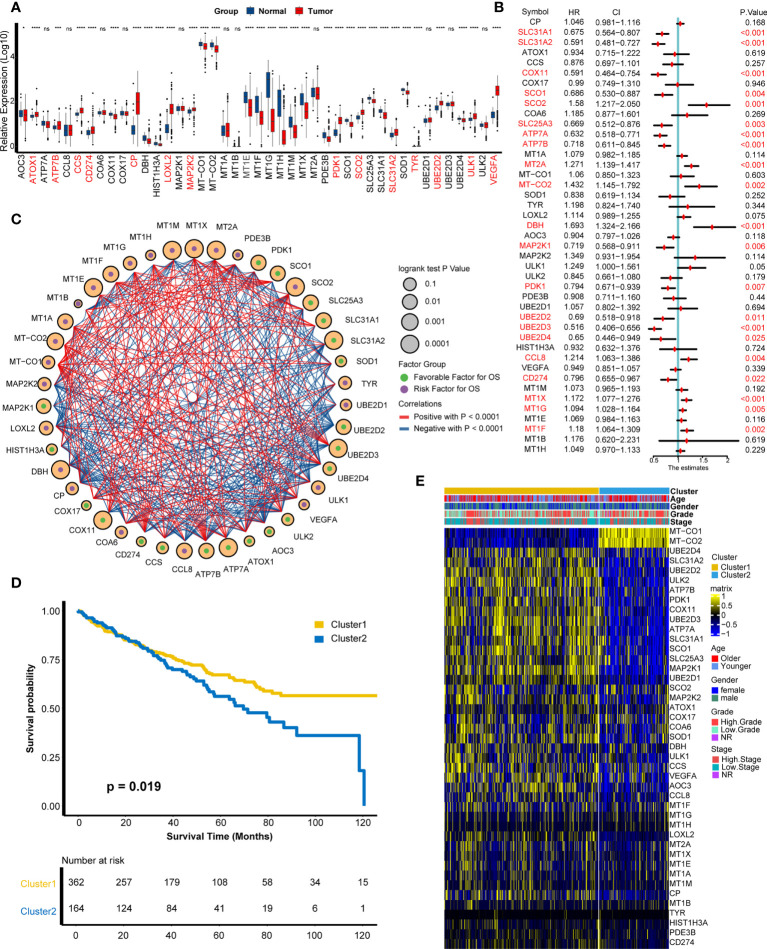
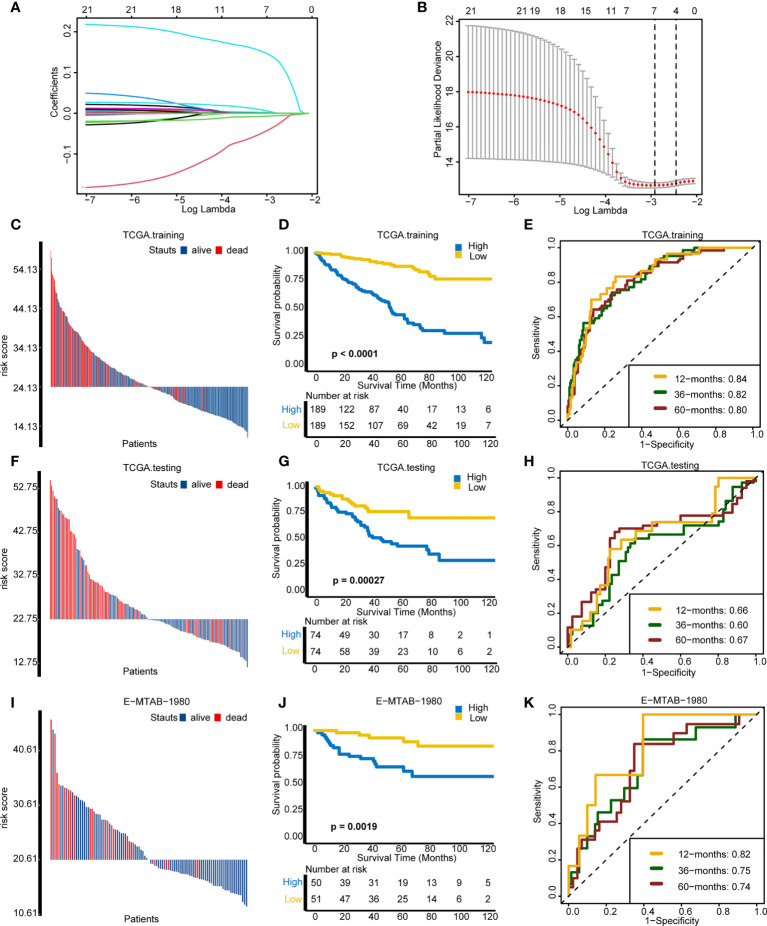
Methods: Based on 43 cuproptosis-related genes, we employed unsupervised clustering to identify cuproptosis-related patterns and single-sample gene set enrichment analysis algorithm to build a cuproptosis signature for individual patient's immune cell infiltration and efficacy of immune checkpoint blockade (ICB) evaluation. Then, the cuproptosis-related genes were narrowed down using univariate Cox regression model and least absolute shrinkage and selection operator algorithm. Finally, a cuproptosis risk score was built by random survival forest based on these narrowed-down genes.

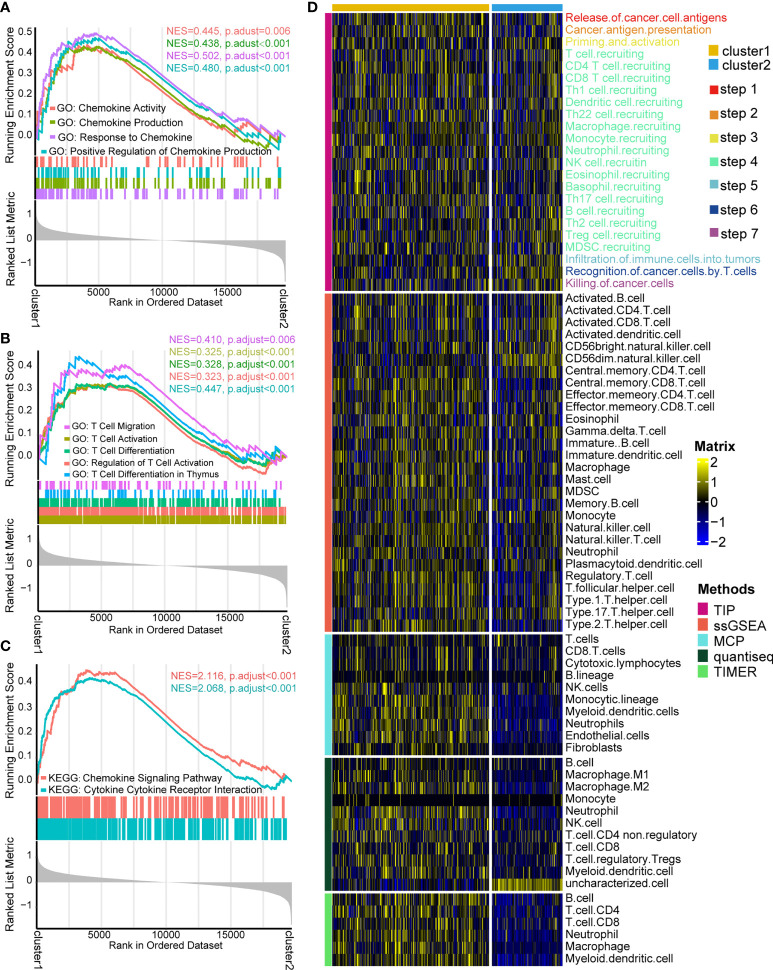
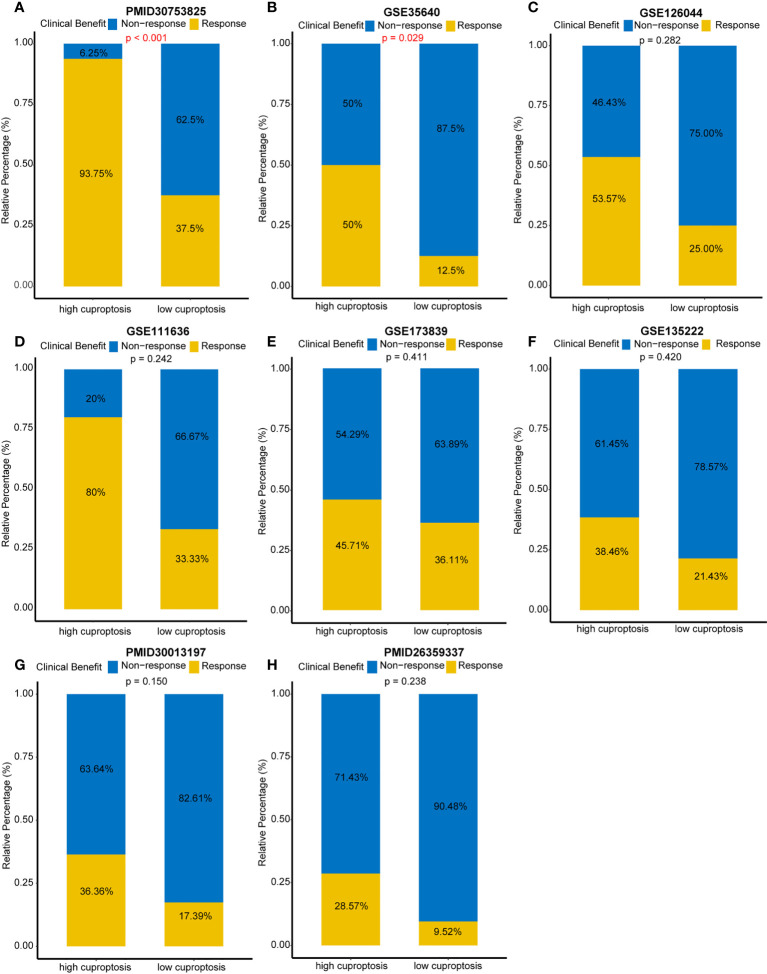
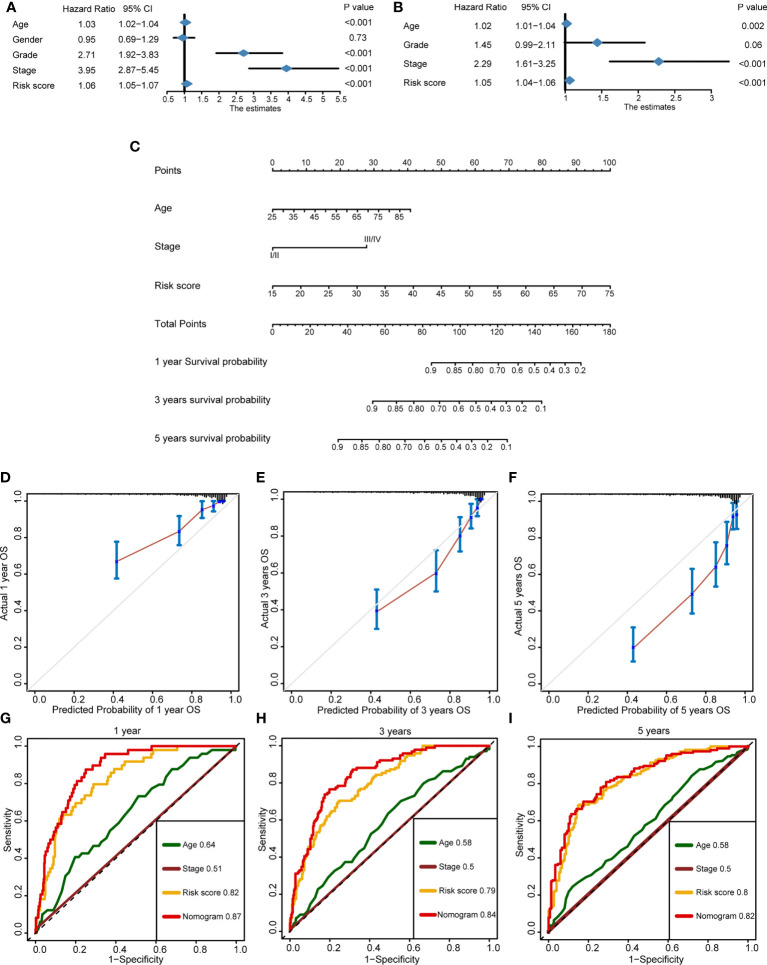
Results: Two distinct cuproptosis-related patterns were developed, with cuproptosis cluster 1 showing better prognosis and higher enrichment of immune-related pathways and infiltration of immune cells. For individual evaluation, the cuproptosis signature that we built could be used not only for predicting immune cell infiltration in TME but also for evaluating an individual's sensitivity to ICBs. Patients with higher cuproptosis signature scores exhibited more activated cancer immune processes, higher immune cell infiltration, and better curative efficacy of ICBs. Furthermore, a robust cuproptosis risk score indicated that patients with higher risk scores showed worse survival outcomes, which could be validated in internal and external validation cohorts. Ultimately, a nomogram which combined the risk score with the prognostic clinical factors was developed, and it showed excellent prediction accuracy for survival outcomes.

Conclusion: Distinct cuproptosis-related patterns have significant differences on prognosis and immune cell infiltration in kidney renal clear cell carcinoma (KIRC). Cuproptosis signature and risk score are able to provide guidance for precision therapy and accurate prognosis prediction for patients with KIRC.

Keywords: KIRC; cuproptosis; immunotherapy; prognosis; tumor microenvironment.


Conflict of interest statement

The authors declare that the research was conducted in the absence of any commercial or financial relationships that could be construed as a potential conflict of interest.

Figures

Figure 1
Figure 1
Development of cuproptosis-related patterns. (A) Expression of cuproptosis-related genes in tumors and adjacent normal tissues. (B) Prognostic analysis of cuproptosis-related genes using univariate Cox regression. (C) Correlation analysis among cuproptosis-related genes. The size of the circle represented the p-value of overall survival, the green and purple dots in the circle meant favorable and risk factor in prognosis, and the red and blue lines that connected two circles meant positive and negative regulating relationships, respectively. (D) Survival outcome between two patterns. (E) Distribution of clinical features (age, gender, grade, and stage) and expression matrix of cuproptosis-related patterns. *p < 0.05, ***p < 0.001, ****p < 0.0001; ns, not statistically significant.
Figure 2
Figure 2
Expression patterns of cuproptosis-related genes on the single-cell level. (A) Fifteen main cell clusters in the scRNA KIRC cohort. (B) Six recognized cell types based on previous cell markers: cancer cells, endothelial cells, vascular smooth muscle cells, T cells, B cells, and macrophage cells. (C–H) Selected cuproptosis-related genes were expressed significantly higher in cancer cells: CP, MT1E, MT1F, MT1X, VEGFA, and PDK1.
Figure 3
Figure 3
Functional enrichment analysis and cancer immunity assessment of cuproptosis-based patterns. (A) Gene Ontology (GO) functional enrichment analysis of chemokine-related pathways. (B) GO functional enrichment analysis of T cell-related pathways. (C) Kyoto Encyclopedia of Genes and Genomes functional enrichment analysis of cytokine/chemokine-related signaling pathways. (D) Expression matrix of cancer immunity cycles and tumor-infiltrating leukocytes between two patterns.
Figure 4
Figure 4
Estimated infiltration level of tumor-infiltrating leukocytes (TILs) and efficacy of immune checkpoint blockade on individuals by cuproptosis signature. (A) Correlation analysis on cuproptosis signature and cancer immunity steps in the TCGA-KIRC and Xiangya-RCC cohorts. *p < 0.05, **p < 0.01, ***p < 0.001; ns, not statistically significant. (B, C) Correlation analysis on cuproptosis signature and TILs in the TCGA-KIRC and Xiangya-RCC cohorts. (D) Expression matrix of TILs (CD8+T cell, dendritic cell, macrophage cell, NK cell, and Th1 cell in the high- and low-score signature groups. (E) Correlation analysis on cuproptosis signature and T cell inflamed score (left) and inhibitory immune checkpoints (right). The solid and dotted lines represent positive and negative connections, respectively; the thickness of the lines represents the coefficient of the relations; and the diverse colors of the lines represent the p-values of the relations.
Figure 5
Figure 5
Direct comparison of immune checkpoint blockades’ efficacy in multiple immunotherapy cohorts. (A) Response rates between different cuproptosis signature groups in the PMID30753825 cohort. (B) Response rates between different cuproptosis signature groups in the GSE35640 cohort. (C–H) Response rates between different cuproptosis signature groups in the GSE126044, GSE111636, GSE173839, GSE135222, PMID30013197, and PMID26359337 cohorts, respectively.
Figure 6
Figure 6
Assessing the prognosis of individuals using the cuproptosis risk score. (A) Coefficients of 21 cuproptosis-related genes with prognostic value. (B) Cross-validation of parameter selection based on the minimum criteria of LASSO regression model. (C–E) Comparisons of survival events, Kaplan–Meier (K–M) survival curves, and time-dependent receiver operating characteristic (ROC) curves between different risk score groups in TCGA training cohort. (F–H) Comparisons of survival events, (K–M) survival curves, and time-dependent ROC curves between different risk score groups in The Cancer Genome Atlas testing cohort. (I–K) Comparisons of survival events, (K–M) survival curves, and time-dependent ROC curves between different risk score groups in the external validation cohort (E-MTAB-1980).
Figure 7
Figure 7
Development of a nomogram for better forecasting survival outcome in clinical practice. (A) Prognostic factors selected by univariate Cox regression. (B) Independent prognostic factors selected by multivariate Cox regression. (C) The nomogram-predicted overall survival at 1, 3, and 5 years by incorporating independent prognostic factors. (D–F) The calibration curves exhibited the clinical relevance of a nomogram at 1, 3, and 5 years. (G–I) Time-dependent receiver operating characteristics showed the prediction accuracy of a nomogram, risk score, age, and stage at 1, 3, and 5 years.

References

    1. Ljungberg B, Albiges L, Abu-Ghanem Y, Bensalah K, Dabestani S, Fernández-Pello S, et al. European Association of urology guidelines on renal cell carcinoma: The 2019 update. Eur Urol (2019) 75(5):799–810. doi: 10.1016/j.eururo.2019.02.011 - DOI - PubMed
    1. Siegel RL, Miller KD, Fuchs HE, Jemal A. Cancer statistics, 2021. CA: Cancer J Clin (2021) 71(1):7–33. doi: 10.3322/caac.21654 - DOI - PubMed
    1. Simonaggio A, Epaillard N, Pobel C, Moreira M, Oudard S, Vano YA. Tumor microenvironment features as predictive biomarkers of response to immune checkpoint inhibitors (ICI) in metastatic clear cell renal cell carcinoma (mccRCC). Cancers (2021) 13(2):231–53. doi: 10.3390/cancers13020231 - DOI - PMC - PubMed
    1. Larroquette M, Peyraud F, Domblides C, Lefort F, Bernhard JC, Ravaud A, et al. Adjuvant therapy in renal cell carcinoma: Current knowledges and future perspectives. Cancer Treat Rev (2021) 97:102207. doi: 10.1016/j.ctrv.2021.102207 - DOI - PubMed
    1. Motzer RJ, Tannir NM, McDermott DF, Arén Frontera O, Melichar B, Choueiri TK, et al. Nivolumab plus ipilimumab versus sunitinib in advanced renal-cell carcinoma. N Engl J Med (2018) 378(14):1277–90. doi: 10.1056/NEJMoa1712126 - DOI - PMC - PubMed

Publication types