

Identification and validation of autophagy-related gene expression for predicting prognosis in patients with idiopathic pulmonary fibrosis
- PMID: 36211385
- PMCID: PMC9533718
- DOI: 10.3389/fimmu.2022.997138
Identification and validation of autophagy-related gene expression for predicting prognosis in patients with idiopathic pulmonary fibrosis
Abstract
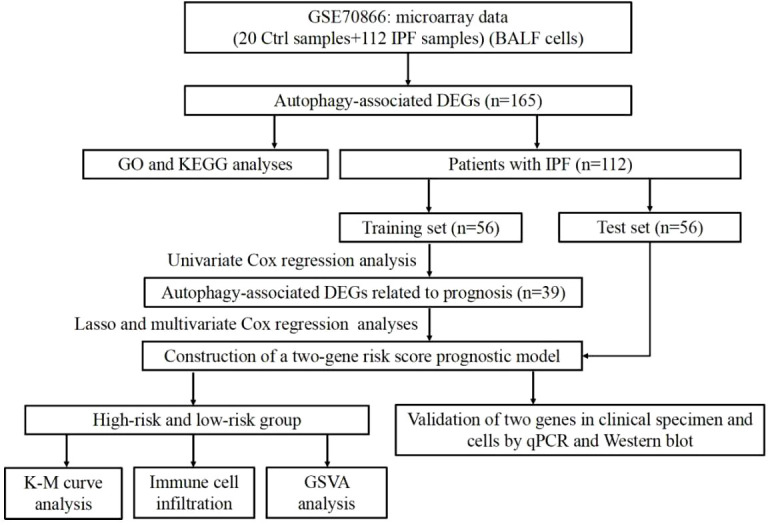
Background: Idiopathic pulmonary fibrosis (IPF) is a chronic, progressive, and fatal fibrotic pulmonary disease with unknow etiology. Owing to lack of reliable prognostic biomarkers and effective treatment measures, patients with IPF usually exhibit poor prognosis. The aim of this study is to establish a risk score prognostic model for predicting the prognosis of patients with IPF based on autophagy-related genes.
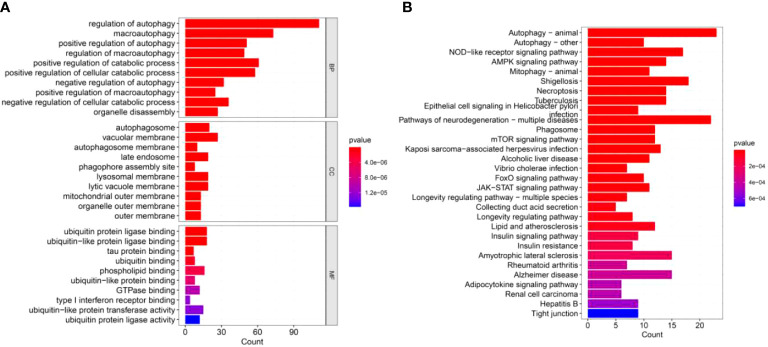
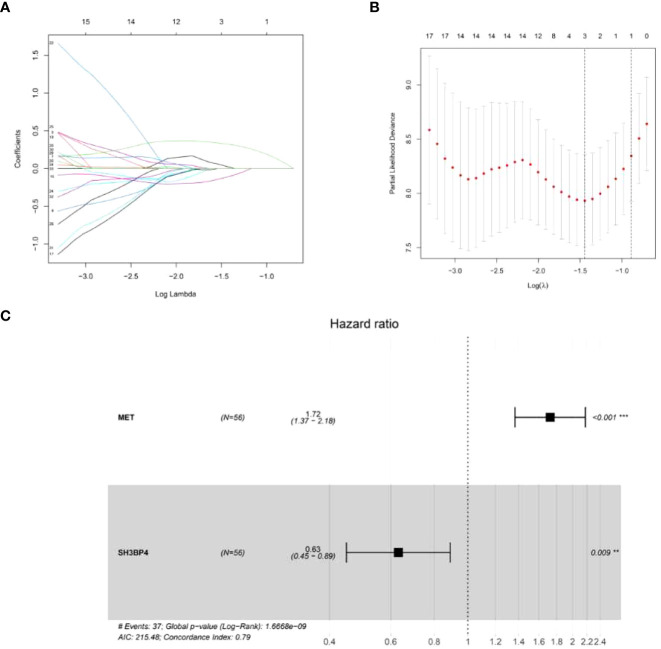
Methods: The GSE70866 dataset was obtained from the gene expression omnibus (GEO) database. The autophagy-related genes were collected from the Molecular Signatures Database (MSigDB). Gene enrichment analysis for differentially expressed genes (DEGs) was performed to explore the function of DEGs. Univariate, least absolute shrinkage and selection operator (LASSO), as well as multivariate Cox regression analyses were conducted to identify a multi-gene prognostic model. Receiver operating characteristic (ROC) curve was applied to assess the prediction accuracy of the model. The expression of genes screened from the prognostic model was validated in clinical samples and human lung fibroblasts by qPCR and western blot assays.
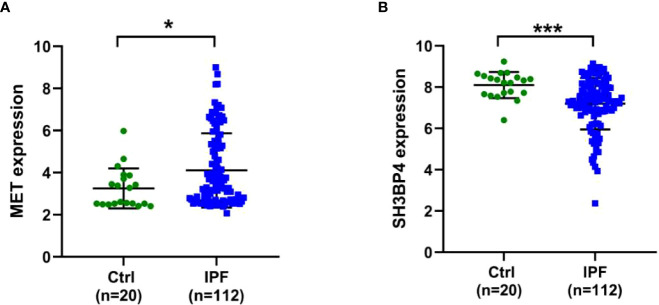
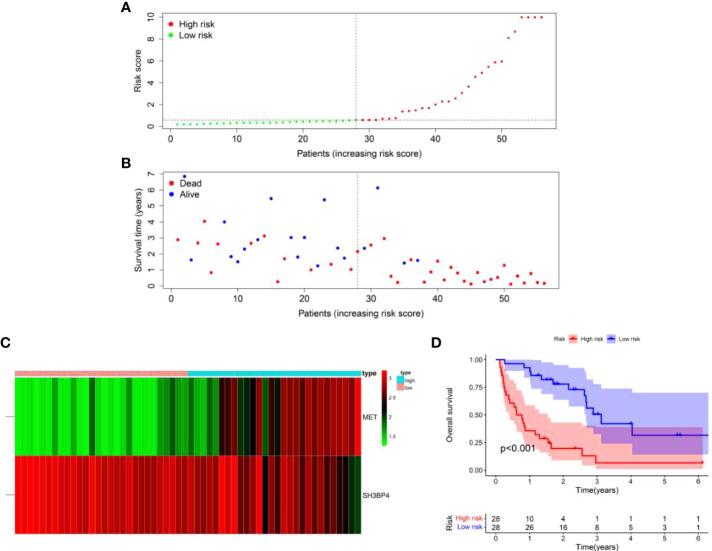
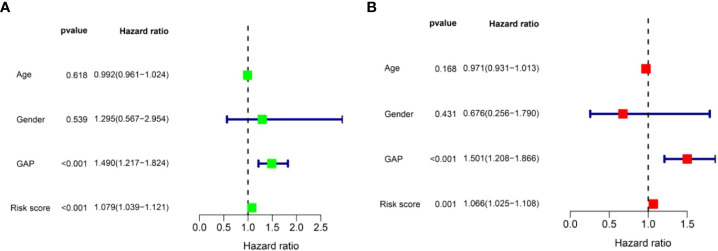
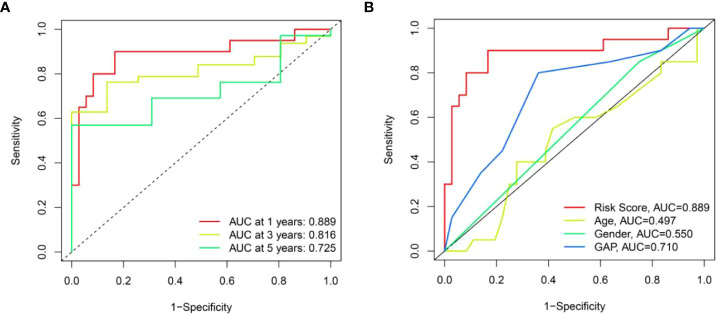
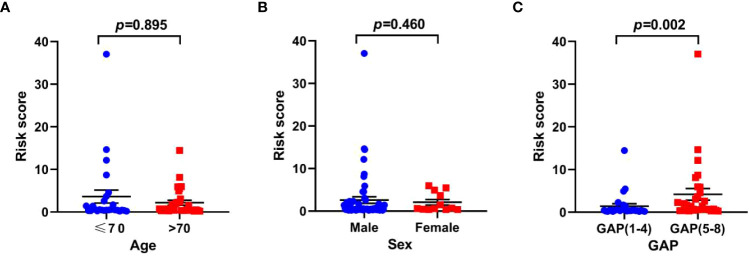
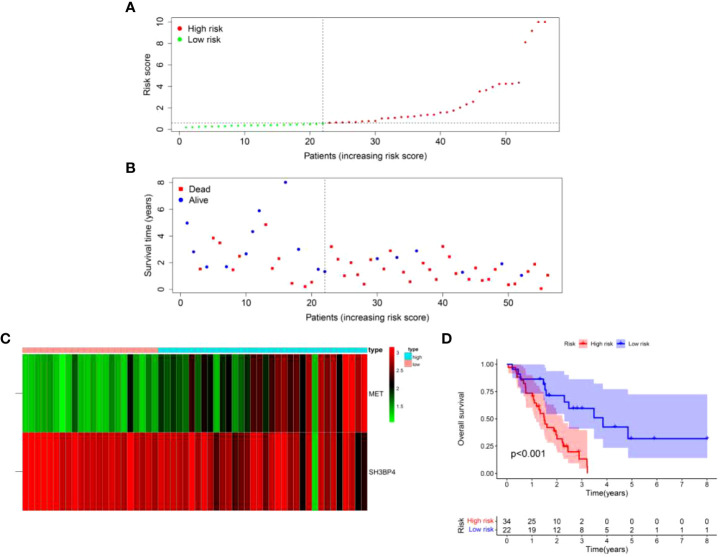
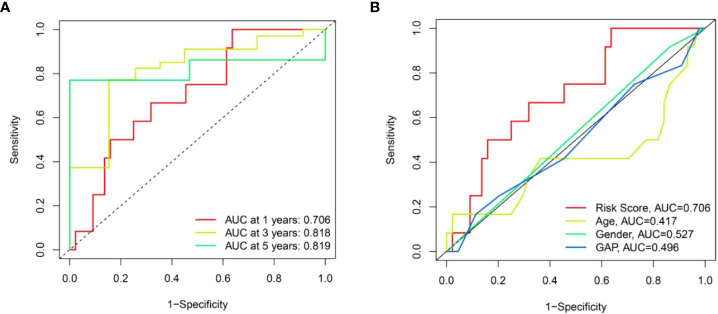
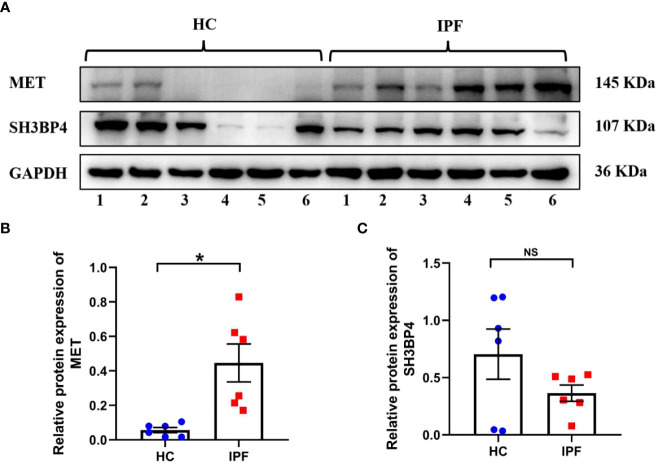
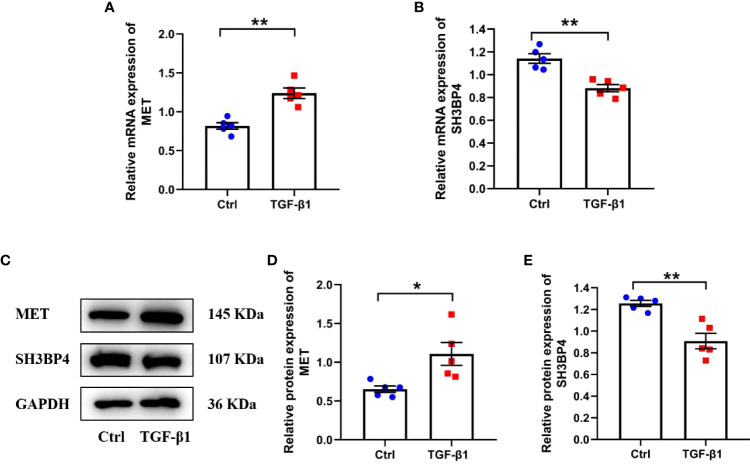
Results: Among the 514 autophagy-related genes, a total of 165 genes were identified as DEGs. These DEGs were enriched in autophagy-related processes and pathways. Based on the univariate, LASSO, and multivariate Cox regression analyses, two genes (MET and SH3BP4) were included for establishing the risk score prognostic model. According to the median value of the risk score, patients with IPF were stratified into high-risk and low-risk groups. Patients in high-risk group had shorter overall survival (OS) than low-risk group in both training and test cohorts. Multivariate regression analysis indicated that prognostic model can act as an independent prognostic indicator for IPF. ROC curve analysis confirmed the reliable predictive value of prognostic model. In the validation experiments, upregulated MET expression and downregulated SH3BP4 expression were observed in IPF lung tissues and TGF-β1-activated human lung fibroblasts, which is consistent with results from microarray data analysis.
Conclusion: These findings indicated that the risk score prognostic model based on two autophagy-related genes can effectively predict the prognosis of patients with IPF.
Keywords: MET; SH3BP4; autophagy; idiopathic pulmonary fibrosis; prognostic model.
Copyright © 2022 Huang, Xu, Ju, Zhong, He and Tang.
Conflict of interest statement
The authors declare that the research was conducted in the absence of any commercial or financial relationships that could be construed as a potential conflict of interest.
Figures

Similar articles
-
An 8-ferroptosis-related genes signature from Bronchoalveolar Lavage Fluid for prognosis in patients with idiopathic pulmonary fibrosis.BMC Pulm Med. 2022 Jan 5;22(1):15. doi: 10.1186/s12890-021-01799-7. BMC Pulm Med. 2022. PMID: 34983465 Free PMC article.
-
Establishment and validation of a prognostic model for idiopathic pulmonary fibrosis based on mitochondrial-related genes.J Thorac Dis. 2024 Nov 30;16(11):7427-7445. doi: 10.21037/jtd-24-760. Epub 2024 Nov 14. J Thorac Dis. 2024. PMID: 39678889 Free PMC article.
-
Prognostic value of tripartite motif (TRIM) family gene signature from bronchoalveolar lavage cells in idiopathic pulmonary fibrosis.BMC Pulm Med. 2022 Dec 6;22(1):467. doi: 10.1186/s12890-022-02269-4. BMC Pulm Med. 2022. PMID: 36474231 Free PMC article.
-
A Systematic Review of Mortality Risk Prediction Models for Idiopathic Pulmonary Fibrosis.Br J Hosp Med (Lond). 2025 Apr 25;86(4):1-22. doi: 10.12968/hmed.2024.0934. Epub 2025 Apr 21. Br J Hosp Med (Lond). 2025. PMID: 40265534
-
Molecular and Genetic Biomarkers in Idiopathic Pulmonary Fibrosis: Where Are We Now?Biomedicines. 2023 Oct 16;11(10):2796. doi: 10.3390/biomedicines11102796. Biomedicines. 2023. PMID: 37893169 Free PMC article. Review.
Cited by
-
Integrating machine learning with bioinformatics for predicting idiopathic pulmonary fibrosis prognosis: developing an individualized clinical prediction tool.Exp Biol Med (Maywood). 2024 Dec 23;249:10215. doi: 10.3389/ebm.2024.10215. eCollection 2024. Exp Biol Med (Maywood). 2024. PMID: 39764456 Free PMC article.
-
Construction of an artificial neural network diagnostic model and investigation of immune cell infiltration characteristics for idiopathic pulmonary fibrosis.BMC Pulm Med. 2024 Sep 17;24(1):458. doi: 10.1186/s12890-024-03249-6. BMC Pulm Med. 2024. PMID: 39289672 Free PMC article.
-
Development and validation of the prognostic model based on autophagy-associated genes in idiopathic pulmonary fibrosis.Front Immunol. 2022 Dec 12;13:1049361. doi: 10.3389/fimmu.2022.1049361. eCollection 2022. Front Immunol. 2022. PMID: 36578501 Free PMC article.
-
Signature identification based on immunogenic cell death-related lncRNAs to predict the prognosis and immune activity of patients with endometrial carcinoma.Transl Cancer Res. 2024 Jun 30;13(6):2913-2937. doi: 10.21037/tcr-23-2243. Epub 2024 Jun 27. Transl Cancer Res. 2024. PMID: 38988945 Free PMC article.
-
RalB promotes lymph node metastasis in tongue squamous cell carcinoma.Genes Genomics. 2025 Jun;47(6):697-705. doi: 10.1007/s13258-025-01628-9. Epub 2025 Apr 10. Genes Genomics. 2025. PMID: 40208483
References
-
- King TE, Albera C, Bradford WZ, Costabel U, du Bois RM, Leff JA, et al. . All-cause mortality rate in patients with idiopathic pulmonary fibrosis. implications for the design and execution of clinical trials. Am J Respir Crit Care Med (2014) 189(7):825–31. doi: 10.1164/rccm.201311-1951OC - DOI - PubMed
Publication types
MeSH terms
Substances
LinkOut - more resources
Full Text Sources
Miscellaneous