. 2022 Sep 22:9:933526.
doi: 10.3389/fnut.2022.933526. eCollection 2022.

Dynamic patterns of postprandial metabolic responses to three dietary challenges

Affiliations

Dynamic patterns of postprandial metabolic responses to three dietary challenges

Patrick Weinisch et al. Front Nutr. .

Abstract

Food intake triggers extensive changes in the blood metabolome. The kinetics of these changes depend on meal composition and on intrinsic, health-related characteristics of each individual, making the assessment of changes in the postprandial metabolome an opportunity to assess someone's metabolic status. To enable the usage of dietary challenges as diagnostic tools, profound knowledge about changes that occur in the postprandial period in healthy individuals is needed. In this study, we characterize the time-resolved changes in plasma levels of 634 metabolites in response to an oral glucose tolerance test (OGTT), an oral lipid tolerance test (OLTT), and a mixed meal (SLD) in healthy young males (n = 15). Metabolite levels for samples taken at different time points (20 per individual) during the challenges were available from targeted (132 metabolites) and non-targeted (502 metabolites) metabolomics. Almost half of the profiled metabolites (n = 308) showed a significant change in at least one challenge, thereof 111 metabolites responded exclusively to one particular challenge. Examples include azelate, which is linked to ω-oxidation and increased only in OLTT, and a fibrinogen cleavage peptide that has been linked to a higher risk of cardiovascular events in diabetes patients and increased only in OGTT, making its postprandial dynamics a potential target for risk management. A pool of 89 metabolites changed their plasma levels during all three challenges and represents the core postprandial response to food intake regardless of macronutrient composition. We used fuzzy c-means clustering to group these metabolites into eight clusters based on commonalities of their dynamic response patterns, with each cluster following one of four primary response patterns: (i) "decrease-increase" (valley-like) with fatty acids and acylcarnitines indicating the suppression of lipolysis, (ii) "increase-decrease" (mountain-like) including a cluster of conjugated bile acids and the glucose/insulin cluster, (iii) "steady decrease" with metabolites reflecting a carryover from meals prior to the study, and (iv) "mixed" decreasing after the glucose challenge and increasing otherwise. Despite the small number of subjects, the diversity of the challenges and the wealth of metabolomic data make this study an important step toward the characterization of postprandial responses and the identification of markers of metabolic processes regulated by food intake.

Keywords: dietary challenge; longitudinal metabolomics; metabolic adaptation; nutritional metabolomics; postprandial metabolism; response patterns; time-series data.


Conflict of interest statement

The authors declare that the research was conducted in the absence of any commercial or financial relationships that could be construed as a potential conflict of interest.

Figures

Figure 1
Figure 1
Metabolic responses to three dietary challenges. (A) Fifteen young healthy male participants completed three dietary challenges. Up to eight blood plasma samples were taken from baseline to 4 h postprandially in intervals from 15 to 60 min. Each sample was analyzed using a non-targeted and a targeted mass spectrometry-based metabolomics approach to identify metabolites increasing or decreasing in response to a challenge in a time-resolved manner. (B) Out of 634 measured metabolites that survived data quality control, we identified those metabolites in each challenge that displayed a significant change during the 4 h after ingestion of the challenge drink (based on a repeated measure ANOVA-type statistics; Bonferroni adjusted p < 0.05). The Venn diagram illustrates the number of overlapping and unique metabolites with significant responses to the challenges with 89 metabolites that showed changes irrespective of the composition of the meal. (C) The 308 metabolites with significant postprandial responses are distributed over the 8 investigated metabolite classes (saturated color in the outer circle indicates the portion of significant metabolites in the respective class in relation to the number of metabolites measured from this class, which is shown in the inner circle).
Figure 2
Figure 2
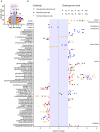
Fold changes of metabolites at different sampling time points after ingestion for results with largest effects/smallest p-values. (A) Volcano plot showing the log2 fold change of each metabolite in each challenge after each sampled time point (time points are indicated by different symbols) in relation to the p-value (ANOVA-type statistic) that the metabolite reached in the test for significant postprandial changes in a challenge, i.e., each metabolite is displayed multiple times per challenge. For each challenge, only metabolites with any significant postprandial change and large fold changes [abs(log2fc) > 1] or with very low p-values [–log10(p-value) > 40] are colored (red: OGTT; blue: SLD; yellow: OLTT) in this plot. (B) Metabolites/time points meeting one of both coloring criteria in the volcano plot are integrated into the forest plot, which displays the observed log2 fold changes. The gray plot band depicts the band of log2fc between −1 and 1, for which the fold changes are shown only if the p-value of the metabolite was very low for a particular challenge (i.e., if the p-value of the metabolite meets the above threshold). Otherwise, fold changes with abs(log2fc) < 1 are not displayed.
Figure 3
Figure 3
Temporal plots of sums of conjugated and unconjugated bile acids. Bile acids that exhibited significant temporal changes in at least one of the challenges were split into unconjugated (n = 6) and conjugated (n = 3) compounds. For each group, we calculated the total sum of abundances (based on normalized ion counts). (A) Log2 fold changes in the sum of conjugated bile acids ± the standard error of the mean (SEM) after the ingestion of the different challenge drinks. (B) Log2 fold changes in the sum of unconjugated bile acids ± SEM.
Figure 4
Figure 4
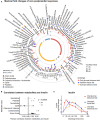
Metabolite pool of the core postprandial response to dietary intake. (A) Circular plot of the largest absolute log2 fold changes of the 89 metabolites that display significant concentration changes in all three challenges. Lollipop length represents the largest log2 fold change in a metabolite within each challenge; colors represent the challenge and the size of the bubble represents the –log10(p-value); the gray circles indicate log2 fold changes from −2 to 3; bindicates metabolites measured using targeted metabolomics (AbsoluteIDQ p150). (B) Pearson correlation of the 89 core metabolites with insulin sorted by metabolite class and colored by significance after multiple testing (black: Bonferroni adjusted p < 0.05). (C) Time-resolved log2 fold changes of insulin levels in relation to the time of ingestion (t = 0) for the three challenges (red: OGTT; blue: SLD challenge; yellow: OLTT). Data are represented as mean over the 15 participants ± SEM.
Figure 5
Figure 5
Temporal patterns of core postprandial responses identified by fuzzy c-means cluster analysis. Graphs show four general patterns of responses (A–D). The black line depicts the mean z-score of trajectories over the 15 participants for each metabolite in a cluster. The colored donuts depict the distribution of metabolites in a cluster over the eight metabolite classes. (A) Metabolic responses (Cluster 1, 2) with postprandial decreases and increases from baseline until 4 h. (B) Responses with postprandial increases and decreases (Cluster 3, 4) from baseline until 4 h. (C) Response with steady decreasing trajectories (Cluster 5) from OGTT to OLTT. (D) Dissimilar metabolic responses in OGTT compared to SLD/OLTT (Cluster 6–8).
Figure 6
Figure 6
Challenge-specific postprandial responses. (A) Distribution of metabolites with significant challenge-specific postprandial responses (Bonferroni adjusted p < 0.05) over metabolite classes. (B) Temporal profiles for selected examples of metabolites showing challenge-specific postprandial responses. Data are represented as mean across all 15 participants ± SEM.

References

    1. Dinneen S. Carbohydrate metabolism in non-insulin-dependent diabetes mellitus. N Engl J Med. (1992) 327:707–13. 10.1056/NEJM199209033271007 - DOI - PubMed
    1. Stroeve JHM, van Wietmarschen H, Kremer BHA, van Ommen B, Wopereis S. Phenotypic flexibility as a measure of health: the optimal nutritional stress response test. Genes Nutr. (2015) 10:1–21. 10.1007/s12263-015-0459-1 - DOI - PMC - PubMed
    1. Lairon D, Lopez-Miranda J, Williams C. Methodology for studying postprandial lipid metabolism. Euro J Clin Nutr. (2007) 61:1145–61. 10.1038/sj.ejcn.1602749 - DOI - PubMed
    1. Baker PR, Boyle KE, Koves TR, Ilkayeva OR, Muoio DM, Houmard JA, et al. . Metabolomic analysis reveals altered skeletal muscle amino acid and fatty acid handling in obese humans. Obesity. (2015) 23:981–8. 10.1002/oby.21046 - DOI - PMC - PubMed
    1. Scalbert A, Brennan L, Manach C, Andres-Lacueva C, Dragsted LO, Draper J, et al. . The food metabolome: a window over dietary exposure. Am J Clin Nutr. (2014) 99:1286–308. 10.3945/ajcn.113.076133 - DOI - PubMed