

A novel LUAD prognosis prediction model based on immune checkpoint-related lncRNAs
- PMID: 36212122
- PMCID: PMC9533213
- DOI: 10.3389/fgene.2022.1016449
A novel LUAD prognosis prediction model based on immune checkpoint-related lncRNAs
Abstract
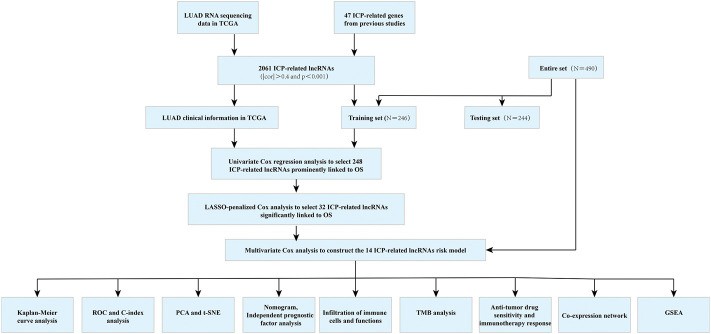
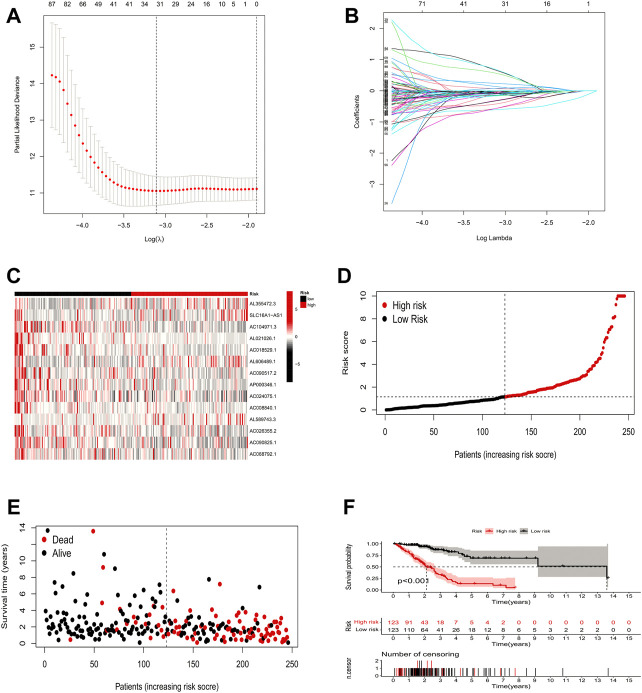
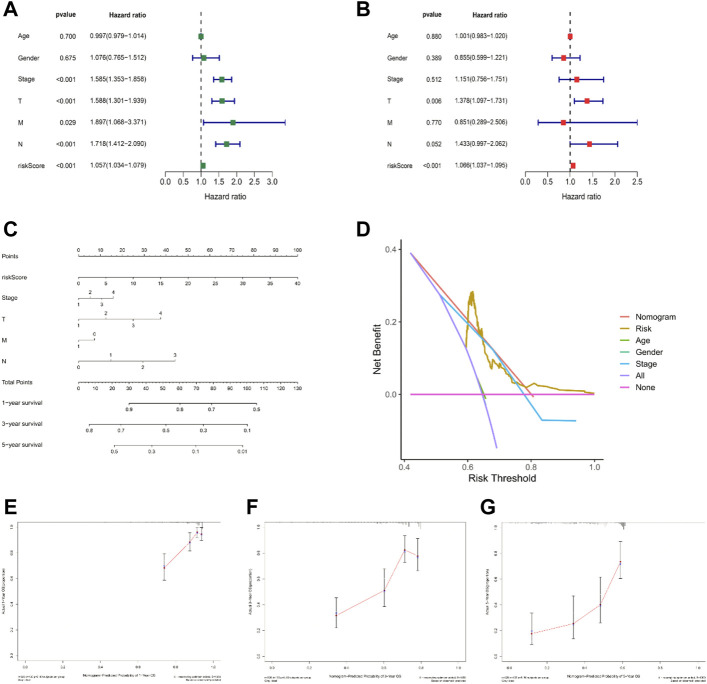
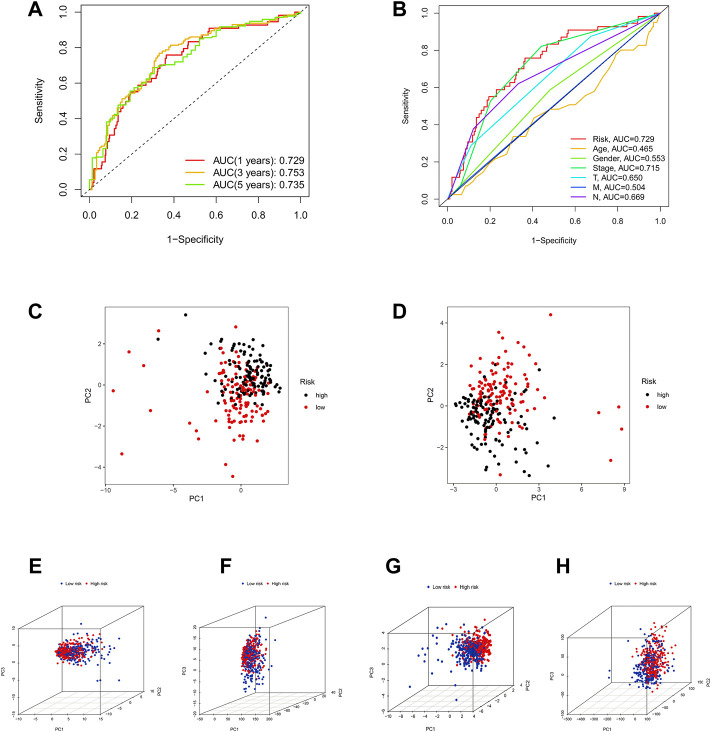
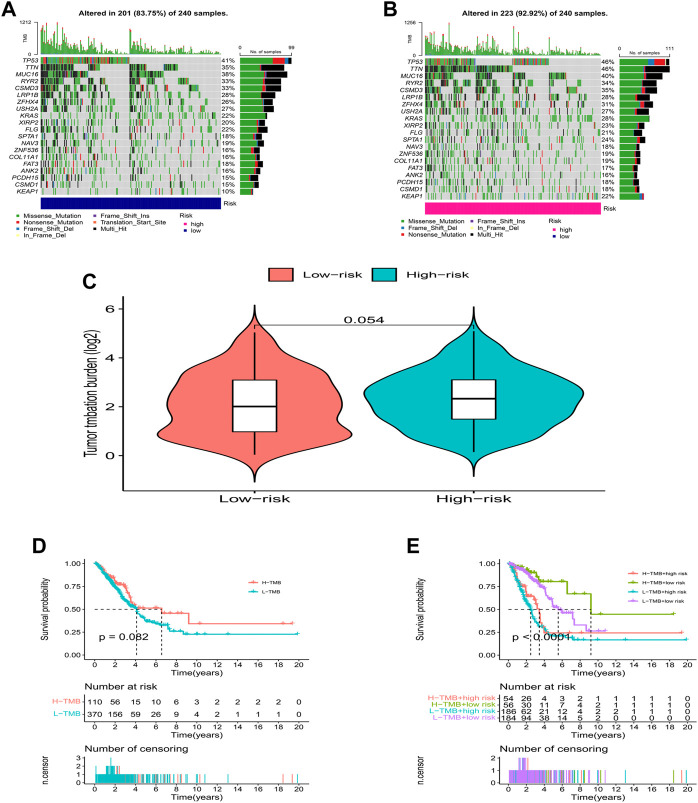
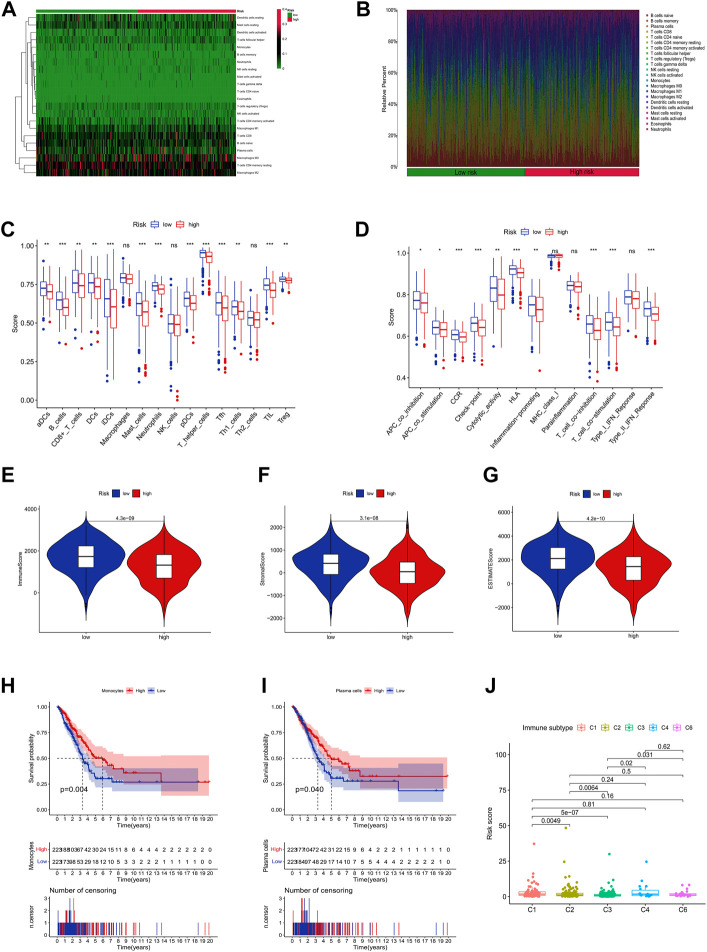
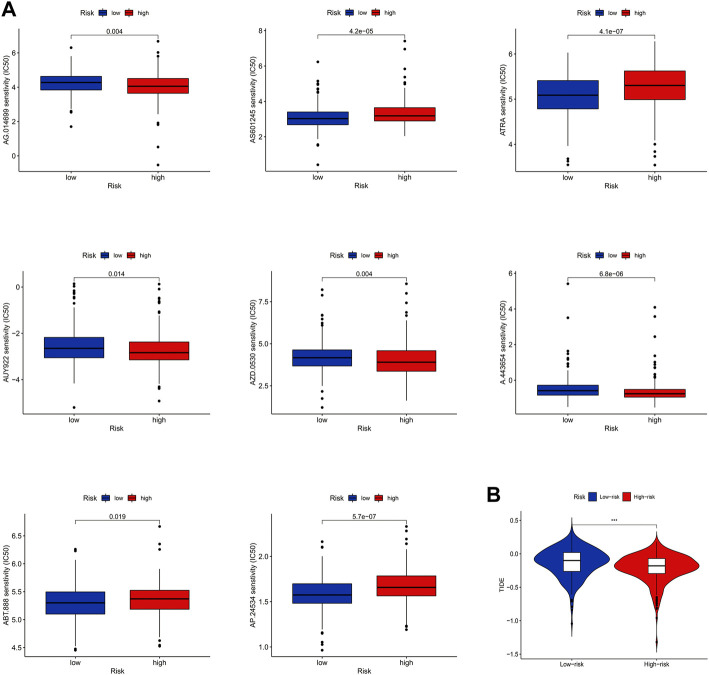
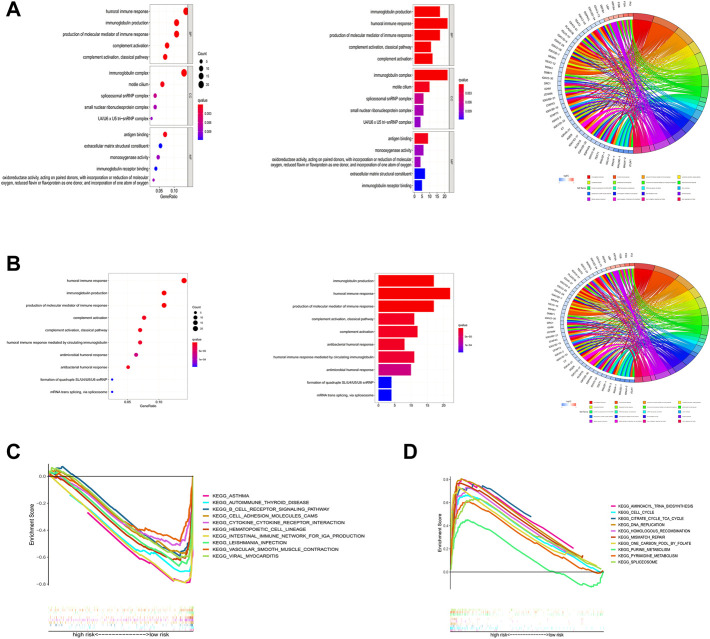
Lung adenocarcinoma (LUAD) is a malignant disease with an extremely poor prognosis, and there is currently a lack of clinical methods for early diagnosis and precise treatment and management. With the deepening of tumor research, more and more attention has been paid to the role of immune checkpoints (ICP) and long non-coding RNAs (lncRNAs) regulation in tumor development. Therefore, this study downloaded LUAD patient data from the TCGA database, and finally screened 14 key ICP-related lncRNAs based on ICP-related genes using univariate/multivariate COX regression analysis and LASSO regression analysis to construct a risk prediction model and corresponding nomogram. After multi-dimensional testing of the model, the model showed good prognostic prediction ability. In addition, to further elucidate how ICP plays a role in LUAD, we jointly analyzed the immune microenvironmental changes in LAUD patients and performed a functional enrichment analysis. Furthermore, to enhance the clinical significance of this study, we performed a sensitivity analysis of common antitumor drugs. All the above works aim to point to new directions for the treatment of LUAD.
Keywords: bioinformatic analyse; immune check point; lncRNA; lung adenocarcinoma; tumor microenvironment.
Copyright © 2022 Liu, Yu, Cheng, Zhang, Luo, Liao, Chen, Zheng, Long, Wu, Qu, Gong and Song.
Conflict of interest statement
The authors declare that the research was conducted in the absence of any commercial or financial relationships that could be construed as a potential conflict of interest.
Figures
Similar articles
-
Prognostic Value of Genomic Instability of m6A-Related lncRNAs in Lung Adenocarcinoma.Front Cell Dev Biol. 2022 Mar 3;10:707405. doi: 10.3389/fcell.2022.707405. eCollection 2022. Front Cell Dev Biol. 2022. PMID: 35309906 Free PMC article.
-
Construction of a Prognostic Immune-Related LncRNA Risk Model for Lung Adenocarcinoma.Front Cell Dev Biol. 2021 Mar 18;9:648806. doi: 10.3389/fcell.2021.648806. eCollection 2021. Front Cell Dev Biol. 2021. PMID: 33869203 Free PMC article.
-
Identification and Validation of a Three Pyroptosis-Related lncRNA Signature for Prognosis Prediction in Lung Adenocarcinoma.Front Genet. 2022 Jul 19;13:838624. doi: 10.3389/fgene.2022.838624. eCollection 2022. Front Genet. 2022. PMID: 35928454 Free PMC article.
-
A Novel Necroptosis-Related lncRNA Signature Predicts the Prognosis of Lung Adenocarcinoma.Front Genet. 2022 Mar 17;13:862741. doi: 10.3389/fgene.2022.862741. eCollection 2022. Front Genet. 2022. PMID: 35368663 Free PMC article.
-
Relationships of N6-Methyladenosine-Related Long Non-Coding RNAs With Tumor Immune Microenvironment and Clinical Prognosis in Lung Adenocarcinoma.Front Genet. 2021 Oct 20;12:714697. doi: 10.3389/fgene.2021.714697. eCollection 2021. Front Genet. 2021. PMID: 34777460 Free PMC article.
Cited by
-
[High LINC00626 expression promotes esophagogastric junction adenocarcinoma metastasis: the mediating role of the JAK1/STAT3/KHSRP axis].Nan Fang Yi Ke Da Xue Xue Bao. 2024 Mar 20;44(3):541-552. doi: 10.12122/j.issn.1673-4254.2024.03.16. Nan Fang Yi Ke Da Xue Xue Bao. 2024. PMID: 38597446 Free PMC article. Chinese.
-
Polo-like Kinase 4: A Multifaceted Marker Linking Tumor Aggressiveness and Unfavorable Prognosis, and Insights into Therapeutic Strategies.Cancers (Basel). 2023 Sep 21;15(18):4663. doi: 10.3390/cancers15184663. Cancers (Basel). 2023. PMID: 37760631 Free PMC article.
References
-
- Bejarano L., Jordāo M. J. C., Joyce J. A. (2021). Therapeutic targeting of the tumor microenvironment. Cancer Discov. 11 (4), 933–959. 10.1158/2159-8290.CD-20-1808 - DOI - PubMed
LinkOut - more resources
Full Text Sources