

Testing inter-observer error under a collaborative research framework for studying lithic shape variability
- PMID: 36212164
- PMCID: PMC9525927
- DOI: 10.1007/s12520-022-01676-2
Testing inter-observer error under a collaborative research framework for studying lithic shape variability
Abstract
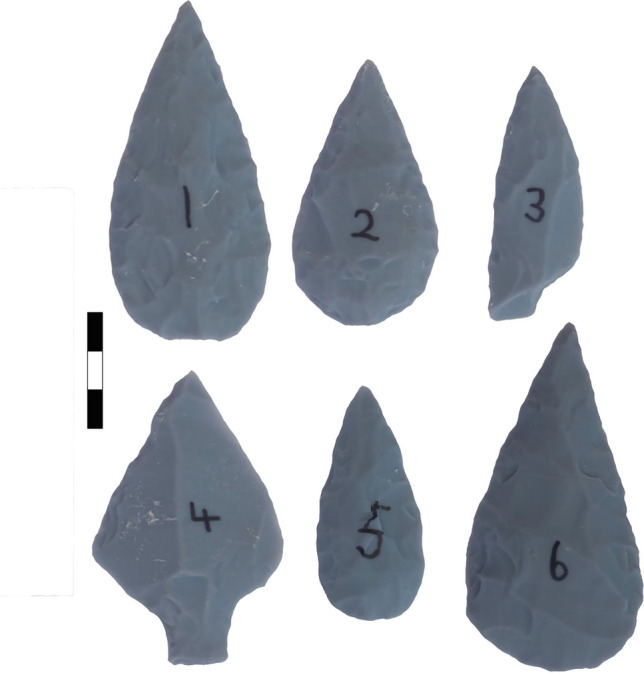
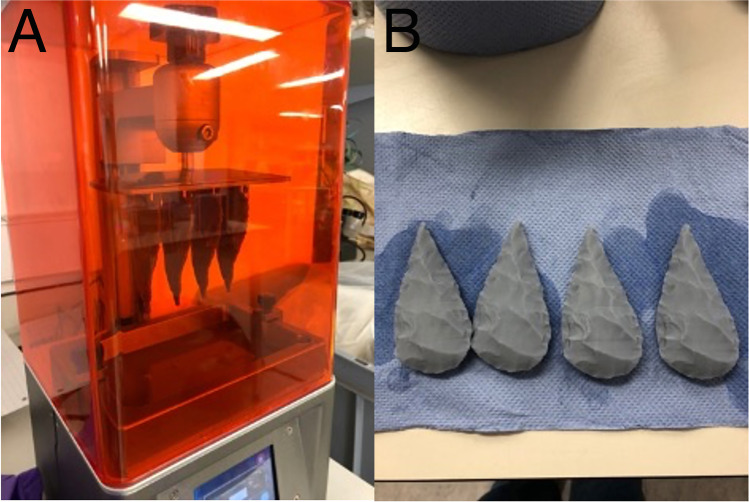
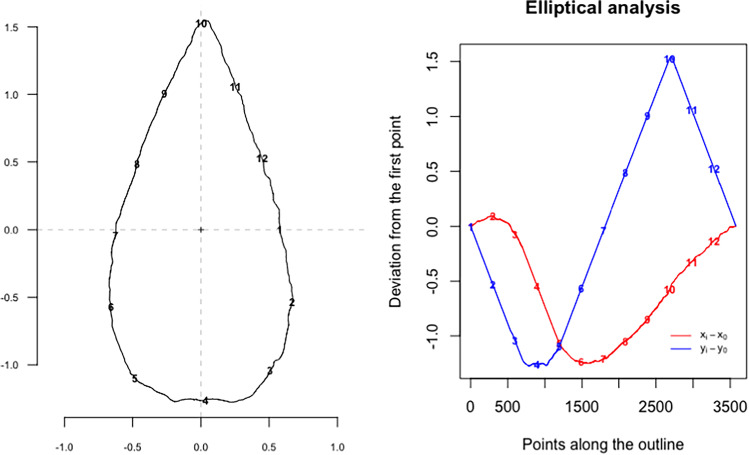
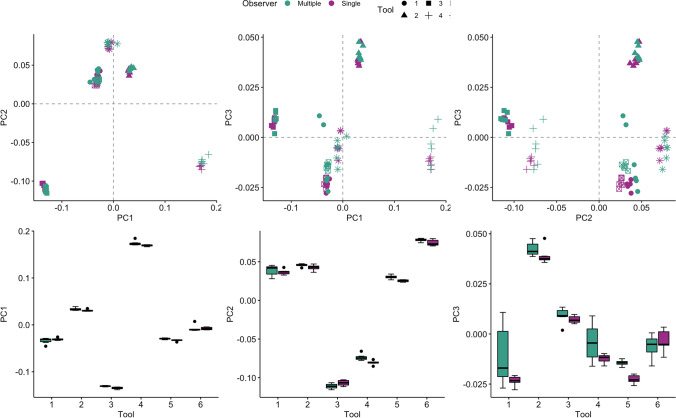
Evaluating error that arises through the aggregation of data recorded by multiple observers is a key consideration in many metric and geometric morphometric analyses of stone tool shape. One of the most common approaches involves the convergence of observers for repeat trails on the same set of artefacts: however, this is logistically and financially challenging when collaborating internationally and/or at a large scale. We present and evaluate a unique alternative for testing inter-observer error, involving the development of 3D printed copies of a lithic reference collection for distribution among observers. With the aim of reducing error, clear protocols were developed for photographing and measuring the replicas, and inter-observer variability was assessed on the replicas in comparison with a corresponding data set recorded by a single observer. Our results demonstrate that, when the photography procedure is standardized and dimensions are clearly defined, the resulting metric and geometric morphometric data are minimally affected by inter-observer error, supporting this method as an effective solution for assessing error under collaborative research frameworks. Collaboration is becoming increasingly important within archaeological and anthropological sciences in order to increase the accessibility of samples, encourage dual-project development between foreign and local researchers and reduce the carbon footprint of collection-based research. This study offers a promising validation of a collaborative research design whereby researchers remotely work together to produce comparable data capturing lithic shape variability.
Supplementary information: The online version contains supplementary material available at 10.1007/s12520-022-01676-2.
Keywords: 3D printing; Geometric morphometrics; Inter-observer reliability; Metric measurements; Stone tools.
© Crown 2022.
Conflict of interest statement
Conflicts of interestThe authors declare no competing interest.
Figures


References
-
- Athreya S, Ackermann RR (2019) Colonialism and narratives of human origins in Asia and Africa. In: Porr M, Matthews JM (eds) interrogating human origins: decolonisation and the deep past. Routledge, London. 10.4324/9780203731659-4
-
- Bonhomme V, Picq S, Gaucherel C, Claude J. Momocs: outline analysis using R. J Stat Softw. 2014;56:1–24. doi: 10.18637/jss.v056.i13. - DOI
-
- Bonhomme V, Forster E, Wallace M, Stillman E, Charles M, Jones G. Identification of inter- and intra-species variation in cereal grains through geometric morphometric analysis, and its resilience under experimental charring. J Archaeol Sci. 2017;86:60–67. doi: 10.1016/j.jas.2017.09.010. - DOI
LinkOut - more resources
Full Text Sources