Comparison and interpretation of freshwater bacterial structure and interactions with organic to nutrient imbalances in restored wetlands
- PMID: 36212857
- PMCID: PMC9533089
- DOI: 10.3389/fmicb.2022.946537
Comparison and interpretation of freshwater bacterial structure and interactions with organic to nutrient imbalances in restored wetlands
Abstract
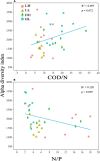
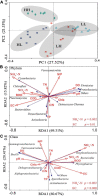
Chemical oxygen demand to nitrogen (COD/N) and nitrogen to phosphorus (N/P) ratios have distinct effects on bacterial community structure and interactions. However, how organic to nutrient imbalances affect the structure of freshwater bacterial assemblages in restored wetlands remains poorly understood. Here, the composition and dominant taxa of bacterial assemblages in four wetlands [low COD/N and high N/P (LH), low COD/N and low N/P (LL), high COD/N and high N/P (HH), and high COD/N and low N/P (HL)] were investigated. A total of 7,709 operational taxonomic units were identified by high throughput sequencing, and Actinobacteria, Proteobacteria, and Cyanobacteria were the most abundant phyla in the restored wetlands. High COD/N significantly increased bacterial diversity and was negatively correlated with N/P (R 2 = 0.128; p = 0.039), and the observed richness (Sobs) indices ranged from 860.77 to 1314.66. The corresponding Chao1 and phylogenetic diversity (PD) values ranged from 1533.42 to 2524.56 and 127.95 to 184.63. Bacterial beta diversity was negatively related to COD/N (R 2 = 0.258; p < 0.001). The distribution of bacterial assemblages was mostly driven by variations in ammonia nitrogen (NH4 +-N, p < 0.01) and electrical conductivity (EC, p < 0.01), which collectively explained more than 80% of the variation in bacterial assemblages. However, the dominant taxa Proteobacteria, Firmicutes, Cyanobacteria, Bacteroidetes, Verrucomicrobia, Planctomycetes, Chloroflexi, and Deinococcus-Thermus were obviously affected by variation in COD/N and N/P (p < 0.05). The highest node and edge numbers and average degree were observed in the LH group. The co-occurrence networkindicated that LH promoted bacterial network compactness and bacterial interaction consolidation. The relationships between organic to nutrient imbalances and bacterial assemblages may provide a theoretical basis for the empirical management of wetland ecosystems.
Keywords: bacterial assemblages; co-occurrence network; nutrient imbalance; organic matter; restored wetlands.
Copyright © 2022 Zheng, Zhang, Yin, Qin, Chen, Zhang, Zhao, Leng, An and Xia.
Conflict of interest statement
The authors declare that the research was conducted in the absence of any commercial or financial relationships that could be construed as a potential conflict of interest.
Figures


Similar articles
-
Composition and assembly mechanisms of prokaryotic communities in wetlands, and their relationships with different vegetation and reclamation methods.Sci Total Environ. 2023 Nov 1;897:166190. doi: 10.1016/j.scitotenv.2023.166190. Epub 2023 Aug 9. Sci Total Environ. 2023. PMID: 37567310
-
The Composition and Diversity of the Rhizosphere Bacterial Community of Ammodendron bifolium Growing in the Takeermohuer Desert Are Different from Those in the Nonrhizosphere.Microb Ecol. 2023 Nov 27;87(1):2. doi: 10.1007/s00248-023-02320-9. Microb Ecol. 2023. PMID: 38008827
-
[Comparison of Soil Bacterial Community Structure Between Paddy Fields and Dry Land in the Huixian Karst Wetland, China].Huan Jing Ke Xue. 2019 Jul 8;40(7):3313-3323. doi: 10.13227/j.hjkx.201811048. Huan Jing Ke Xue. 2019. PMID: 31854733 Chinese.
-
[Effects of Land Use Changes on Soil Bacterial Community Diversity in the Riparian Wetland Along the Downstream of Songhua River].Huan Jing Ke Xue. 2020 Sep 8;41(9):4273-4283. doi: 10.13227/j.hjkx.202003088. Huan Jing Ke Xue. 2020. PMID: 33124309 Chinese.
-
Impacts of silver nanoparticles on the nutrient removal and functional bacterial community in vertical subsurface flow constructed wetlands.Bioresour Technol. 2017 Nov;243:1216-1226. doi: 10.1016/j.biortech.2017.07.178. Epub 2017 Aug 3. Bioresour Technol. 2017. PMID: 28801173 Review.
Cited by
-
Abundance trade-offs and dominant taxa maintain the stability of the bacterioplankton community underlying Microcystis blooms.Front Microbiol. 2023 May 19;14:1181341. doi: 10.3389/fmicb.2023.1181341. eCollection 2023. Front Microbiol. 2023. PMID: 37275174 Free PMC article.
References
-
- Aanderud Z. T., Saurey S., Ball B. A., Wall D. H., Barrett J. E., Muscarella M. E., et al. (2018). Stoichiometric shifts in soil C: N:P promote bacterial taxa dominance, maintain biodiversity, and deconstruct community assemblages. Front. Microbiol. 9:1401. 10.3389/fmicb.2018.01401 - DOI - PMC - PubMed
-
- Bastian M., Heymann S., Jacomy M. (2009). Gephi: An open source software for exploring and manipulating networks. Proc. Int. AAAI Conf. Web Soc. Media 3 361–362. 10.13140/2.1.1341.1520 - DOI
-
- Baxter A. M., Johnson L., Edgerton J., Royer T., Leff L. G. (2012). Structure and function of denitrifying bacterial assemblages in low-order Indiana streams. Freshw. Sci. 31 304–317. 10.1899/11-066.1 - DOI
LinkOut - more resources
Full Text Sources
Miscellaneous

