. 2022 Sep 23:9:1007064.
doi: 10.3389/fmolb.2022.1007064. eCollection 2022.

Requirements for MRN endonuclease processing of topoisomerase II-mediated DNA damage in mammalian cells

Affiliations

Requirements for MRN endonuclease processing of topoisomerase II-mediated DNA damage in mammalian cells

Yilun Sun et al. Front Mol Biosci. .

Abstract

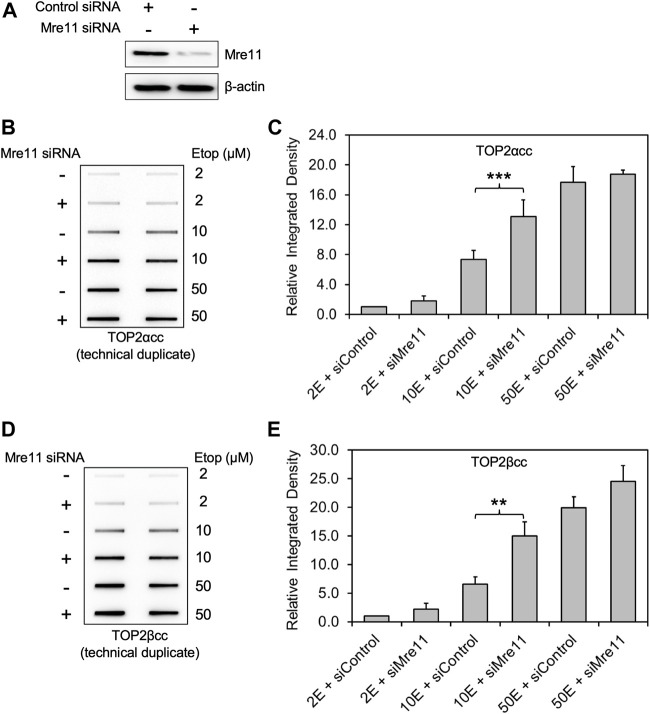
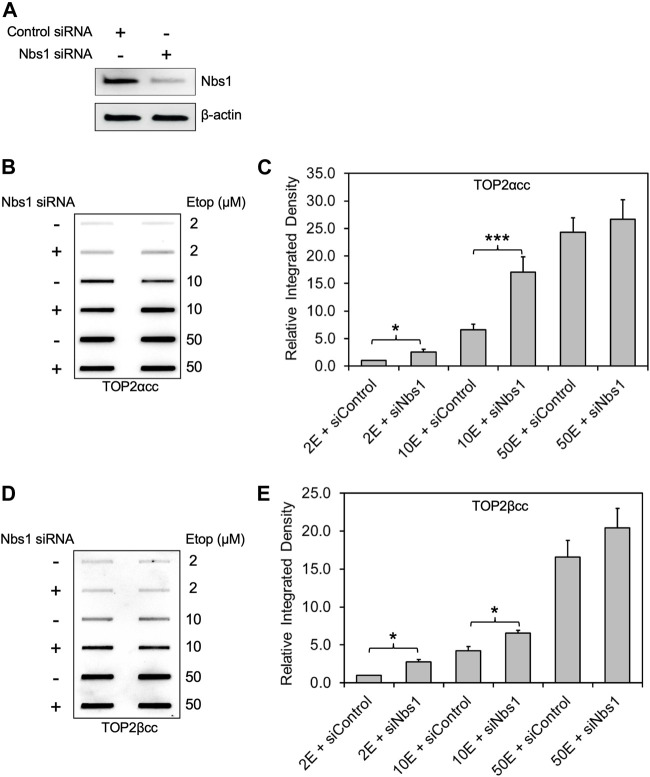
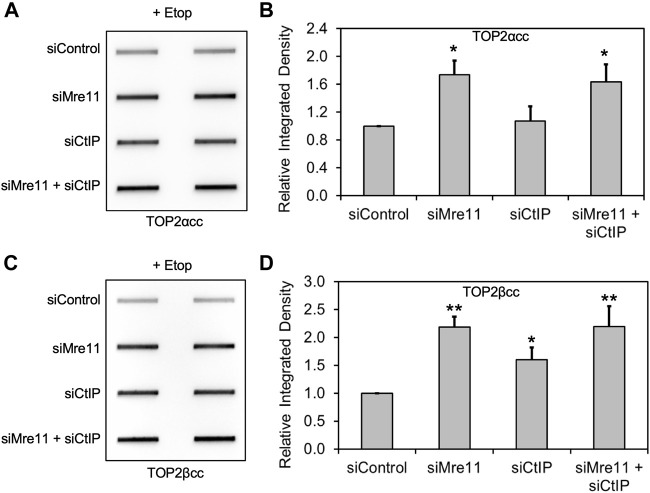
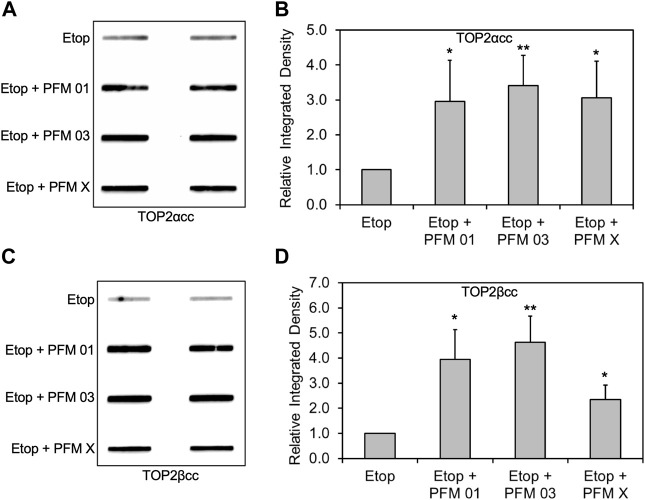
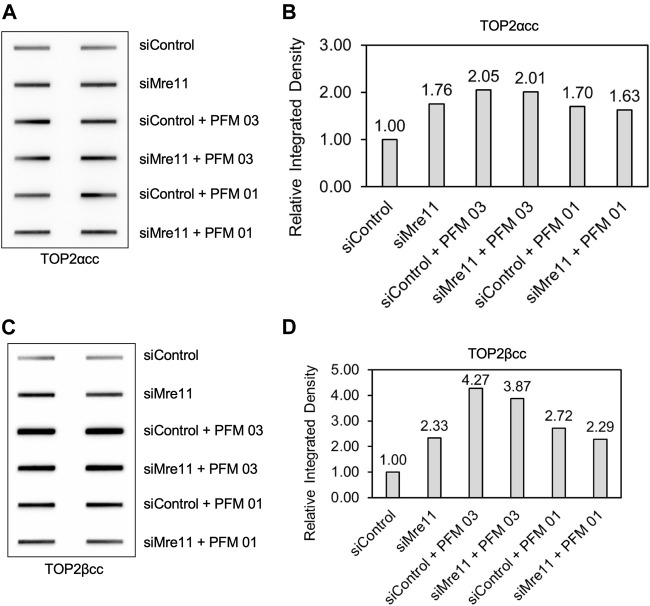
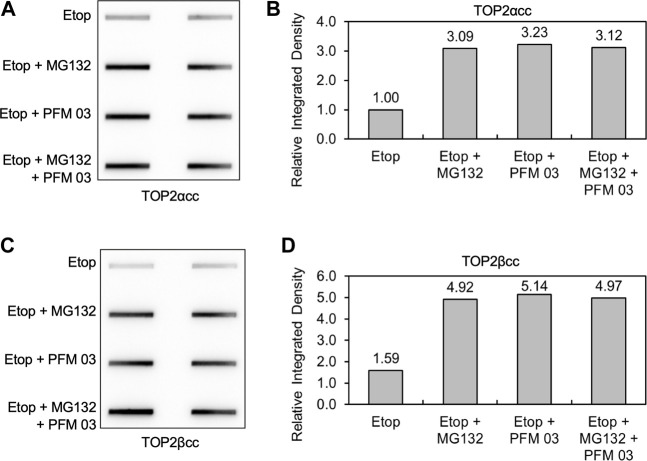
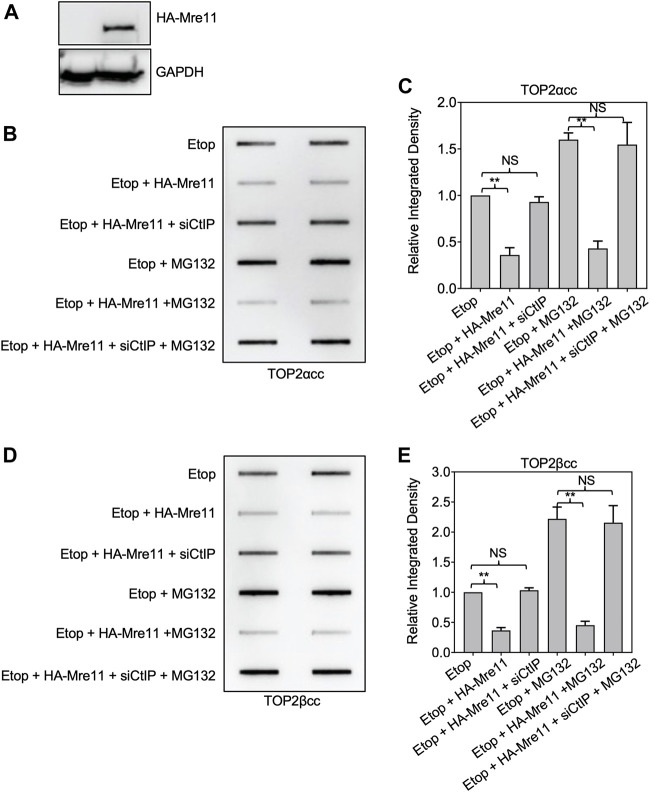
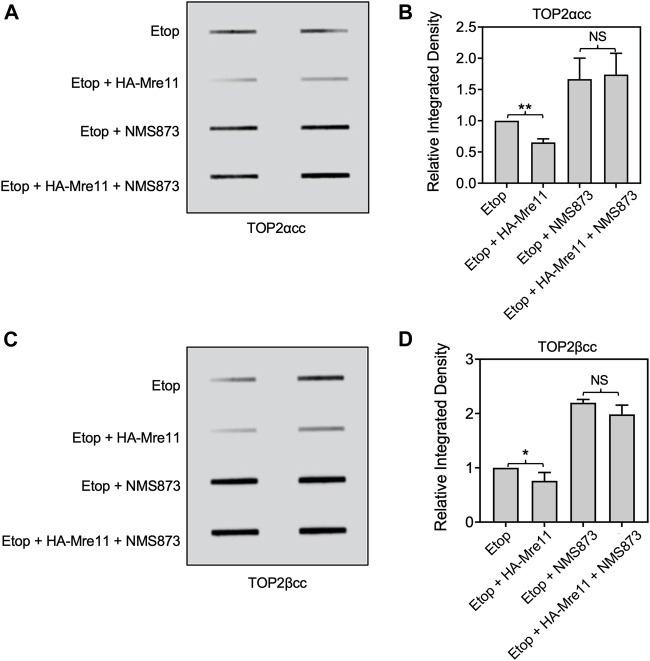
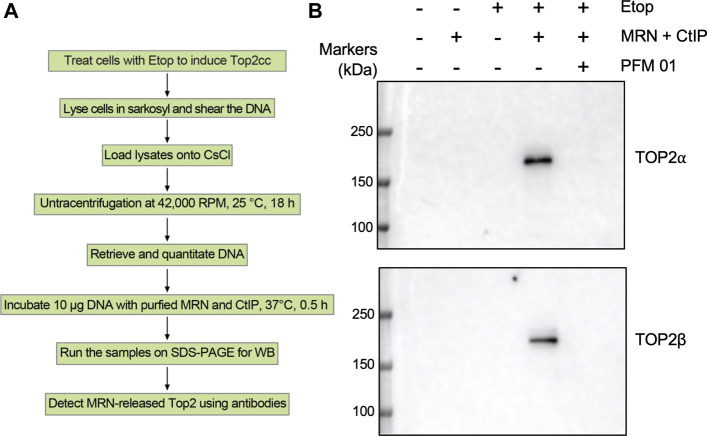
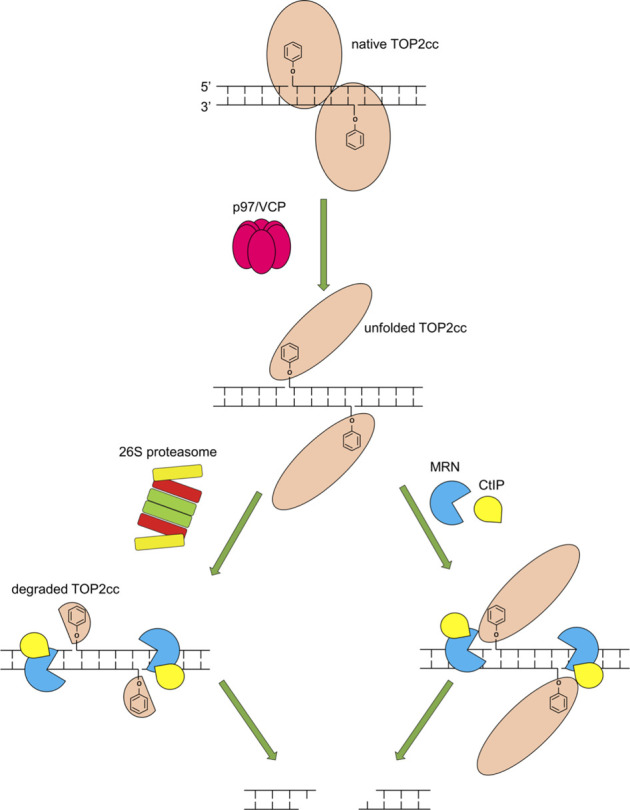
During a normal topoisomerase II (TOP2) reaction, the enzyme forms a covalent enzyme DNA intermediate consisting of a 5' phosphotyrosyl linkage between the enzyme and DNA. While the enzyme typically rejoins the transient breakage after strand passage, a variety of conditions including drugs targeting TOP2 can inhibit DNA resealing, leading to enzyme-mediated DNA damage. A critical aspect of the repair of TOP2-mediated damage is the removal of the TOP2 protein covalently bound to DNA. While proteolysis plays a role in repairing this damage, nucleolytic enzymes must remove the phosphotyrosyl-linked peptide bound to DNA. The MRN complex has been shown to participate in the removal of TOP2 protein from DNA following cellular treatment with TOP2 poisons. In this report we used an optimized ICE (In vivo Complex of Enzyme) assay to measure covalent TOP2/DNA complexes. In agreement with previous independent reports, we find that the absence or inhibition of the MRE11 endonuclease results in elevated levels of both TOP2α and TOP2β covalent complexes. We also examined levels of TOP2 covalent complexes in cells treated with the proteasome inhibitor MG132. Although MRE11 inhibition plus MG132 was not synergistic in etoposide-treated cells, ectopic overexpression of MRE11 resulted in removal of TOP2 even in the presence of MG132. We also found that VCP/p97 inhibition led to elevated TOP2 covalent complexes and prevented the removal of TOP2 covalent complexes by MRE11 overexpression. Our results demonstrate the existence of multiple pathways for proteolytic processing of TOP2 prior to nucleolytic processing, and that MRE11 can process TOP2 covalent complexes even when the proteasome is inhibited. The interactions between VCP/p97 and proteolytic processing of TOP2 covalent complexes merit additional investigation.

Keywords: DNA-protein crosslink (DPC) repair; Mre11-Rad50-Nbs1 complex; VCP/p97; proteasome; topoisomerase II (TOP2).


Conflict of interest statement

The authors declare that the research was conducted in the absence of any commercial or financial relationships that could be construed as a potential conflict of interest.

Figures

FIGURE 1
FIGURE 1
Knockdown of MRE11 by siRNA increases the level of etoposide-induced TOP2-DNA complexes as detected by ICE. RH30 cells were transfected with non-targeting siRNA control (siControl) or siRNA targeting MRE11 (siMRE11), followed by treatment with etoposide (Etop) at the indicated concentrations. (A) Western blot assessing MRE11 knockdown efficiency. Semi-quantitative image analysis of immunoblots using ImageJ indicates that treatment with siMre11 resulted in 94% knockdown of endogenous MRE11 (quantitation not shown). (B) ICE assay illustrating TOP2αcc in MRE11 knockdown cells. The panel illustrates a representative assay. In all cases, the assay includes technical replicates. At least three biological replicates were performed for all experimental conditions. No detectable signal is ever observed under our conditions in cells treated with a solvent control, over more than 20 experiments. Samples without etoposide were therefore not typically analyzed in ICE assays. (C) Densitometric analysis of all experiments comparing relative integrated densities of TOP2αcc signal amongst MRE11 knockdown and control cells treated with 2 μM, 10 and 50 μM etoposide (2E, 10E and 50E). Integrated density of TOP2αcc signal of each group was normalized to that of control cells treated with 2 μM etoposide. *** denotes p-value < 0.001, determined using Student’s t-test. Samples not marked with a bar did not result in a statistically significant difference. (D) ICE assay illustrating TOP2βcc. The panel illustrates a representative assay. In all cases, the assay includes technical replicates. (E) Densitometric analysis of all experiments comparing relative integrated densities of TOP2βcc signal amongst MRE11 knockdown and control cells treated with 2 μM, 10 and 50 μM etoposide. Integrated density of TOP2αcc signal of each group was normalized to that of control cells treated with 2 μM etoposide. ** denotes p-value < 0.01.
FIGURE 2
FIGURE 2
Knockdown of NBS1 by siRNA increases the level of etoposide-induced TOP2-DNA complexes. Experimental conditions and methods were the same as Figure 1. (A) Western blot assessing NBS1 levels using antibody against NBS1. Semi-quantitative image analysis of immunoblots using ImageJ indicated that treatment with siNbs1 resulted in 85% knockdown of endogenous NBS1 (quantitation not shown). β-actin was used as a protein loading control. (B) ICE assay illustrating TOP2αcc in NBS1 knockdown cells. The panel illustrates a representative assay. (C) Densitometric analysis of all experiments comparing relative integrated densities of TOP2αcc signal amongst NBS1 knockdown and control cells treated with 2 μM, 10 and 50 μM etoposide. Integrated density of TOP2αcc signal of each group was normalized to that of control cells treated with 2 μM etoposide. * denotes p-value <0.05. Samples not marked with a bar did not result in a statistically significant difference. (D) ICE assay illustrating TOP2βcc. The panel illustrates a representative assay. (E) Densitometric analysis of all experiments comparing relative integrated densities of TOP2βcc signal amongst MRE11 knockdown and control cells.
FIGURE 3
FIGURE 3
Knockdown of MRE11 and CtIP are epistatic for repair of TOP2 covalent complexes. We carried out siRNA knockdowns as in Figure 1 (for MRE11) and Supplementary Figure S1 (for CtIP). The results shown were following treatment with 10 μM etoposide for 2 h. (A) ICE assay illustrating TOP2αcc under the conditions indicated. (B) Densitometric analysis of all experiments comparing relative integrated densities of TOP2αcc signal. Integrated density of TOP2αcc signal of each group was normalized to that of cells treated with siControl. (C) ICE assay illustrating TOP2βcc under the conditions indicated. (D) Densitometric analysis of all experiments comparing relative integrated densities of TOP2βcc signal.
FIGURE 4
FIGURE 4
Inhibition of MRE11 endonuclease activity results in accumulation of etoposide-induced TOP2/DNA complexes. RH30 cells were pre-treated with 25 μM PFM01, 25 μM PFM03, or 25 μM PFM X for 4 h. Etoposide (10 μM) was added, and incubation was continued for 2 h. Cells were then harvested for ICE assays. (A) Representative ICE assay measuring the levels of TOP2αcc (B) Densitometric analysis of all assays comparing relative integrated densities of TOP2αcc signals. Integrated density of TOP2αcc signal of each group was normalized to that of cells treated with etoposide alone. (C) Representative ICE assay measuring the levels of TOP2βcc. (D) Densitometric analysis of all assays comparing relative integrated densities of TOP2βcc signals. Integrated density of TOP2βcc signal of each group was normalized to that of cells treated with etoposide alone.
FIGURE 5
FIGURE 5
Inhibition of MRE11 endonuclease activity does not change the level of TOP2 covalent complexes when MRE11 is depleted. RH30 cells were transfected with non-targeting siRNA control (siControl) or siRNA targeting MRE11 (siMRE11) as in Figure 1. These cells were then pre-treated with 25 μM PFM03 where indicated. Etoposide (10 μM) was added, and incubation was continued for 2 h before ICE assays. (A) Representative ICE assay measuring the levels of TOP2αcc. (B) Densitometric analysis of all assays comparing relative integrated densities of TOP2αcc signals. Integrated density of TOP2αcc signal of each group was normalized to that of siControl cells treated with etoposide alone. Levels of TOP2αcc for siControl versus siMre11 cells treated with PFM03 were not statistically different. (C) Representative ICE assay measuring the levels of TOP2βcc. (D) Densitometric analysis of all assays comparing relative integrated densities of TOP2βcc signals.
FIGURE 6
FIGURE 6
MRE11 inhibitors do not enhance levels of covalent complexes upon concurrent treatment with proteasome inhibitors. RH30 cells were pre-treated with 25 μM PFM03, 10 μM MG132, or 25 μM PFM 03 + 10 μM MG132 for 4 h. Etoposide (10 μM) was added, and incubation was continued for 2 h before ICE assays. (A) Representative ICE assay measuring the levels of TOP2αcc. (B) Densitometric analysis of all assays comparing relative integrated densities of TOP2αcc signals. Integrated density of TOP2αcc signal of each group was normalized to that of cells treated with etoposide alone. (C) Representative ICE assay measuring the levels of TOP2βcc. (D) Densitometric analysis of all assays comparing relative integrated densities of TOP2βcc signals.
FIGURE 7
FIGURE 7
Ectopic expression of MRE11 results in removal of TOP2ccs in cells treated with proteasome inhibitors. HEK293 cells were transfected with indicated plasmid and or siRNA for 48 h prior to treatment with 10 μM MG132 for 1 h. Etoposide (10 μM) was added, and incubation was continued for 1 h before ICE assays. (A) Western blot assessing MRE11-HA plasmid transfection efficiency. (B) Representative ICE assay measuring the levels of TOP2αcc. (C) Densitometric analysis of all assays comparing relative integrated densities of TOP2αcc signals of cells. Integrated density of TOP2αcc signal of each group was normalized to that of control cells (no transfection) treated with etoposide alone. (D) Representative ICE assay measuring the levels of TOP2βcc. (E) Densitometric analysis of all assays comparing relative integrated densities of TOP2βcc signals.
FIGURE 8
FIGURE 8
Inhibition of VCP/p97 prevents processing by ectopic expression of MRE11. HEK293 cells were transfected with HA-MRE11 overexpressing plasmid for 48 h prior to treatment with 10 μM NMS873 1 h. Etoposide (10 μM) was added, and incubation was continued for 1 h before ICE assays. (A) Representative ICE assay measuring the levels of TOP2αcc. (B) Densitometric analysis of all assays comparing relative integrated densities of TOP2αcc signals. Integrated density of TOP2αcc signal of each group was normalized to that of control cells (no transfection) treated with etoposide alone. (C) Representative ICE assay measuring the levels of TOP2βcc. (D) Densitometric analysis of all assays comparing relative integrated densities of TOP2βcc signals. NS, not significant.
FIGURE 9
FIGURE 9
In vitro processing of TOP2 covalent complexes by purified MRN proteins. (A) Scheme for in vitro TOP2cc repair assay using ICE samples. (B) HEK293 cells were treated with Etoposide (10 μM) for 30 min and then subjected to ICE assays to induce TOP2cc. 10 µg DNA samples isolated by ICE assay were incubated with purified human MRN complex (100 nM) and CtIP (100 nM) for 30 min at 37°C, followed by addition of Laemmli buffer and Western blotting.
FIGURE 10
FIGURE 10
Model of requirements for the MRN complex to repair TOP2cc. Upon trapping of a TOP2cc, VCP/p97 is recruited and unfolds the TOP2cc, enabling the 26S proteasome (left) and the MRN complex and CtIP (right) to process the TOP2cc. The MRN complex in cooperation with CtIP incises the vicinity of the TOP2cc using its single-strand endonuclease activity, releasing the TOP2cc and liberating the otherwise TOP2-linked DSB (the release may require Mre11 3′-5′ exonuclease activity following its endonucleolytic incision). Proteolytic degradation of TOP2cc by the 26S proteasome may facilitate the nucleolytic processing by the MRN complex and CtIP.

References

    1. Altan B., Yokobori T., Ide M., Bai T., Yanoma T., Kimura A., et al. (2016). High expression of MRE11-RAD50-NBS1 is associated with poor prognosis and chemoresistance in gastric cancer. Anticancer Res. 36, 5237–5247. 10.21873/anticanres.11094 - DOI - PubMed
    1. Anand J., Sun Y., Zhao Y., Nitiss K. C., Nitiss J. L. (2018). Detection of topoisomerase covalent complexes in eukaryotic cells. Methods Mol. Biol. 1703, 283–299. 10.1007/978-1-4939-7459-7_20 - DOI - PubMed
    1. Aparicio T., Baer R., Gottesman M., Gautier J. (2016). MRN, CtIP, and BRCA1 mediate repair of topoisomerase II-DNA adducts. J. Cell Biol. 212, 399–408. 10.1083/jcb.201504005 - DOI - PMC - PubMed
    1. Bian L., Meng Y., Zhang M., Li D. (2019). MRE11-RAD50-NBS1 complex alterations and DNA damage response: Implications for cancer treatment. Mol. Cancer 18, 169. 10.1186/s12943-019-1100-5 - DOI - PMC - PubMed
    1. Boot A., Liu M., Stantial N., Shah V., Yu W., Nitiss K. C., et al. (2022). Recurrent mutations in topoisomerase IIα cause a previously undescribed mutator phenotype in human cancers. Proc. Natl. Acad. Sci. U. S. A. 119, e2114024119. 10.1073/pnas.2114024119 - DOI - PMC - PubMed