

Control charts for measurement error models
- PMID: 36213519
- PMCID: PMC9533293
- DOI: 10.1007/s10182-022-00462-8
Control charts for measurement error models
Abstract
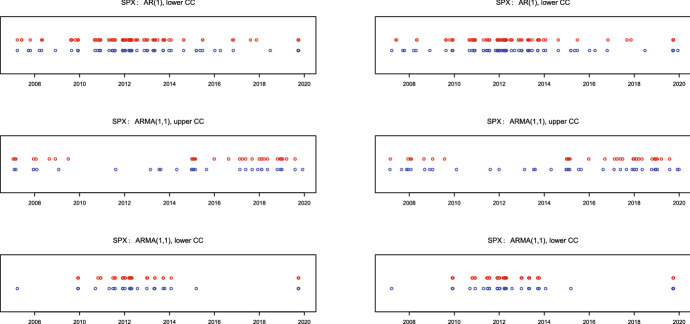
We consider a linear measurement error model (MEM) with AR(1) process in the state equation which is widely used in applied research. This MEM could be equivalently re-written as ARMA(1,1) process, where the MA(1) parameter is related to the variance of measurement errors. As the MA(1) parameter is of essential importance for these linear MEMs, it is of much relevance to provide instruments for online monitoring in order to detect its possible changes. In this paper we develop control charts for online detection of such changes, i.e., from AR(1) to ARMA(1,1) and vice versa, as soon as they occur. For this purpose, we elaborate on both cumulative sum (CUSUM) and exponentially weighted moving average (EWMA) control charts and investigate their performance in a Monte Carlo simulation study. The empirical illustration of our approach is conducted based on time series of daily realized volatilities.
Keywords: Control charts; Measurement error; Statistical process control; Volatility modeling.
© The Author(s) 2022.
Figures


References
-
- Andersen TG, Bollerslev T, Diebold FX, Ebens H. The distribution of realized stock return volatility. J. Financ. Econ. 2001;61(1):43–76. doi: 10.1016/S0304-405X(01)00055-1. - DOI
-
- Barndorff-Nielsen O, Shephard N. Econometric analysis of realized volatility and its use in estimating stochastic volatility models. J. Roy. Stat. Soc. B. 2002;64:253–280. doi: 10.1111/1467-9868.00336. - DOI
-
- Bodnar O, Schmid W. Surveillance of the mean behaviour of multivariate time series. Stat. Neerl. 2007;61:383–406. doi: 10.1111/j.1467-9574.2007.00365.x. - DOI
-
- Bollerslev T, Patton AJ, Quaedvlieg R. Exploiting the errors: a simple approach for improved volatility forecasting. J. Econ. 2016;192:1–18. doi: 10.1016/j.jeconom.2015.10.007. - DOI
-
- Brockwell PJ, Davis RA. Time Series: Theory and Methods. Berlin: Springer; 2009.
LinkOut - more resources
Full Text Sources
Research Materials