. 2022 Oct 4;7(6):e1039.
doi: 10.1097/PR9.0000000000001039. eCollection 2022 Nov-Dec.

Preliminary study: quantification of chronic pain from physiological data

Affiliations

Preliminary study: quantification of chronic pain from physiological data

Zhuowei Cheng et al. Pain Rep. .

Abstract

Introduction: It is unknown if physiological changes associated with chronic pain could be measured with inexpensive physiological sensors. Recently, acute pain and laboratory-induced pain have been quantified with physiological sensors.

Objectives: To investigate the extent to which chronic pain can be quantified with physiological sensors.

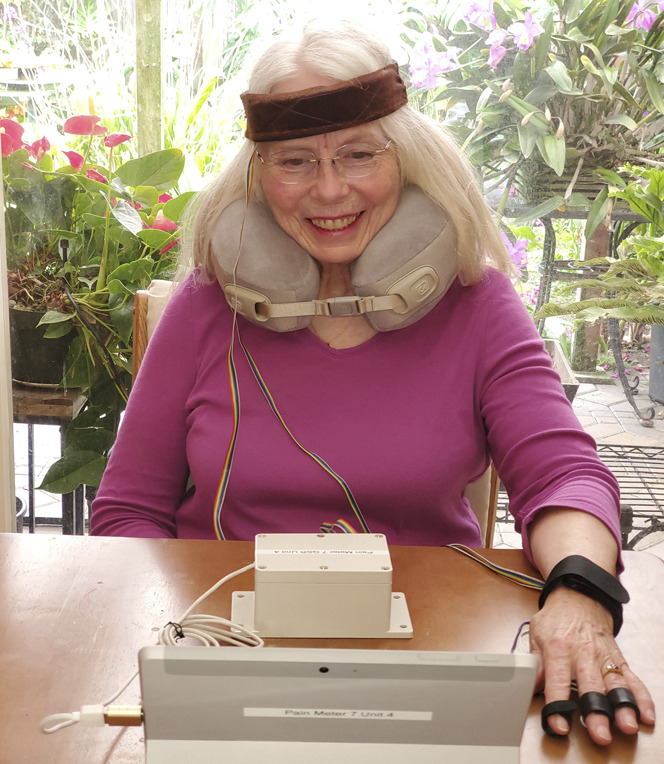
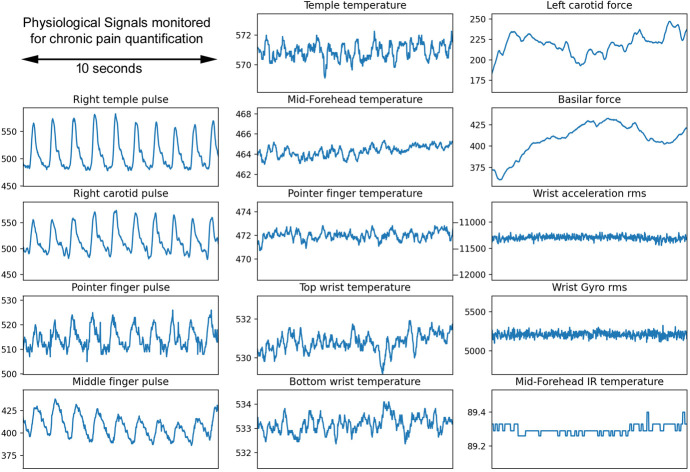
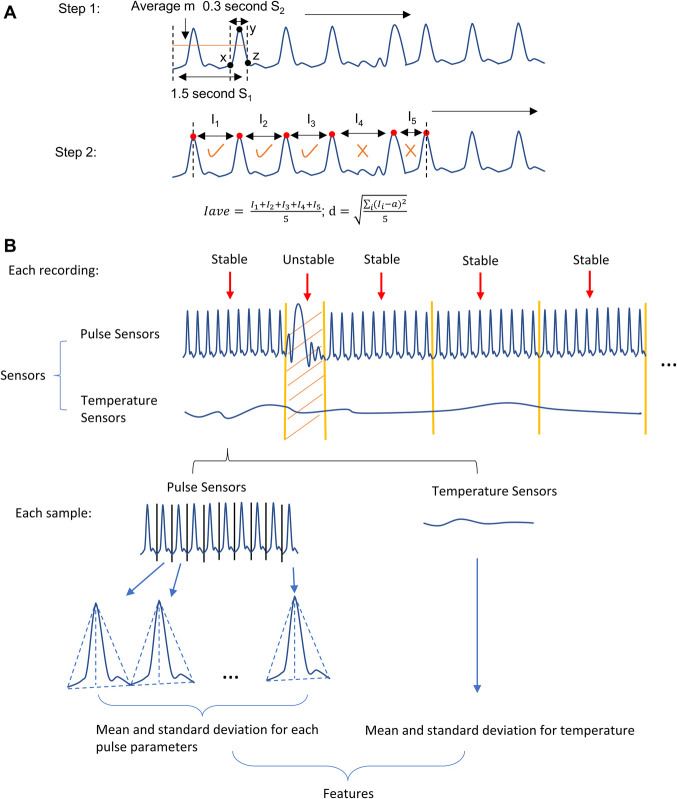
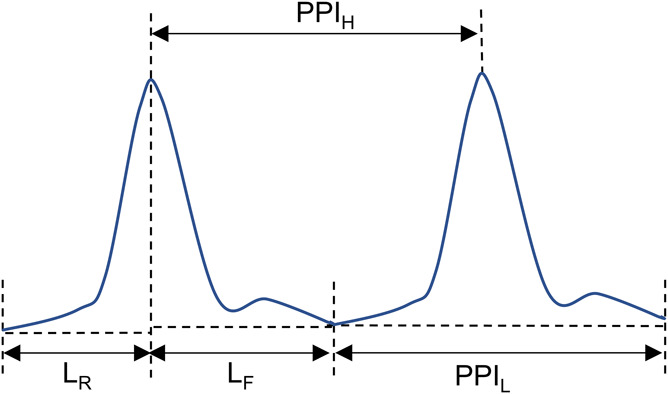
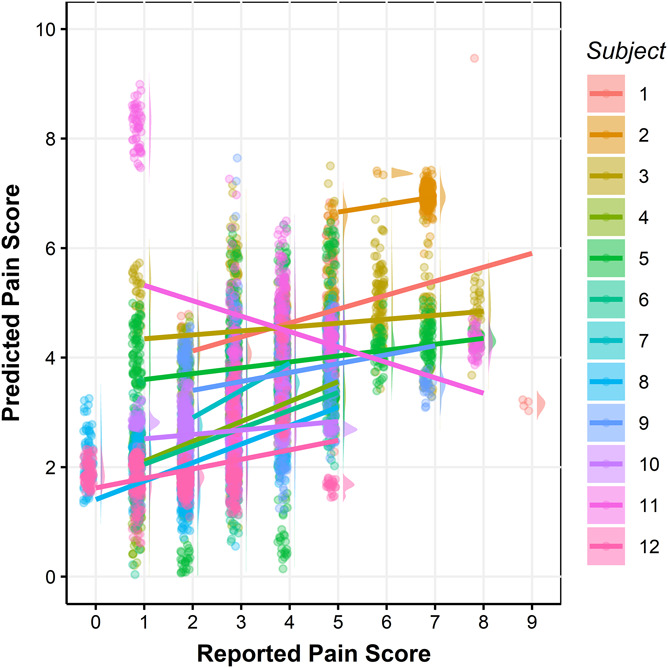
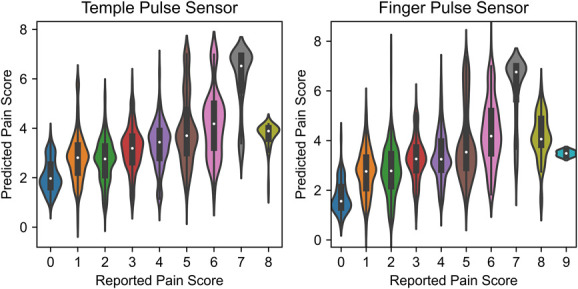
Methods: Data were collected from chronic pain sufferers who subjectively rated their pain on a 0 to 10 visual analogue scale, using our recently developed pain meter. Physiological variables, including pulse, temperature, and motion signals, were measured at head, neck, wrist, and finger with multiple sensors. To quantify pain, features were first extracted from 10-second windows. Linear models with recursive feature elimination were fit for each subject. A random forest regression model was used for pain score prediction for the population-level model.

Results: Predictive performance was assessed using leave-one-recording-out cross-validation and nonparametric permutation testing. For individual-level models, 5 of 12 subjects yielded intraclass correlation coefficients between actual and predicted pain scores of 0.46 to 0.75. For the population-level model, the random forest method yielded an intraclass correlation coefficient of 0.58. Bland-Altman analysis shows that our model tends to overestimate the lower end of the pain scores and underestimate the higher end.

Conclusion: This is the first demonstration that physiological data can be correlated with chronic pain, both for individuals and populations. Further research and more extensive data will be required to assess whether this approach could be used as a "chronic pain meter" to assess the level of chronic pain in patients.

Keywords: Chronic pain; Pain quantification; Physiological data; Random forest.


Conflict of interest statement

The authors have no conflicts of interest to declare.Sponsorships or competing interests that may be relevant to content are disclosed at the end of this article.

Figures

Figure 1.
Figure 1.
Pain Meter contains (1) PPG pulse sensors in a headband, in a neck pillow, wristband, and on the fingertip; (2) temperature sensors on the temple, forehead, wrist, and fingertip; (3) 3-axis accelerometers and 3-axis gyros in the headband and wristband; and (4) force sensors on the left carotid and basilar. PPG, photoplethysmograms.
Figure 2.
Figure 2.
An example of the signals recorded from Pain Meter.
Figure 3.
Figure 3.
Preprocessing and feature extraction. (A) Step 1: Detect all pulse peaks in the recording by comparing the moving average m of each 100 data-point segment in S1 (S1 is 1.5-second-long) with the last 20 data points in S2 (S2 is 0.3-second-long) of S1. If the first and last data point in S2 is smaller than m and the max value of S2 is larger than m, then a peak is detected. Step 2: Take the first 6 peaks and calculate the mean Iave and SD d of the time between peaks. If Iave is between 0.6 and 1.2 seconds and d is smaller than 0.2 and if the time I between 2 peaks is between 0.9 and 1.1 times Iave, this data segment is classified as stable. Otherwise, this data segment is classified as unstable. Repeat this process for all the data. (B) The data preprocessing and feature extraction steps: (1) Remove unstable segments and divide the rest of the recording into continuous 10-second samples. (2) Inside each sample, extract pulse features such as the mean and SD for each pulse parameters and mean and SD for temperature.
Figure 4.
Figure 4.
Pulse parameters. LR is the width of the rising part of the pulse; LF is the width of the falling part of the pulse; PPIH is the interval between 2 consecutive highs; and PPIL is the interval between 2 consecutive lows.
Figure 5.
Figure 5.
Cross-validated predicted pain scores vs reported pain scores for each subject. Different colors represent different subjects in the raincloud plots. Each dot represents one sample, and each line is the fitted linear regression line for each subject. In total, there are 6982 samples, 99.50% of the data is shown in the figure. The rest were omitted to provide higher resolution for the bulk of the data. The Pearson correlation coefficients between reported and the predicted pain scores are 0.78, 0.29, 0.14, 0.54, 0.19, 0.49, 0.56, 0.50, 0.24, 0.16, −0.31, and 0.35, respectively, for subjects 1 through 12.
Figure 6.
Figure 6.
Cross-validated predicted pain scores vs reported pain scores for population-level models. Left panel shows the results from the model using signals from temple pulse sensors, and right panel shows the results from the model using signals from pointer finger pulse sensors. The violin plots for each class shows the distributions of the predicted pain scores.

Similar articles

Cited by

References

    1. Åkerblom S, Perrin S, Fischer MR, McCracken LM. Treatment outcomes in group-based cognitive behavioural therapy for chronic pain: an examination of PTSD symptoms. Eur J Pain 2020;24:807–17. - PubMed
    1. Ambrose KR, Golightly YM. Physical exercise as non-pharmacological treatment of chronic pain: why and when. Best Pract Res Clin Rheumatol 2015;29:120–30. - PMC - PubMed
    1. Ashar YK, Gordon A, Schubiner H, Uipi C, Knight K, Anderson Z, Carlisle J, Polisky L, Geuter S, Flood TF, Kragel PA, Dimidjian S, Lumley MA, Wager TD. Effect of pain reprocessing therapy vs placebo and usual care for patients with chronic back pain. JAMA Psychiatry 2022;79:13. - PMC - PubMed
    1. Aytur SA, Ray KL, Meier SK, Campbell J, Gendron B, Waller N, Robin DA. Neural mechanisms of acceptance and commitment therapy for chronic pain: a network-based fMRI approach. Front Hum Neurosci 2021;15. doi:10.3389/fnhum.2021.587018 - DOI - PMC - PubMed
    1. Baliki MN, Chialvo DR, Geha PY, Levy RM, Harden RN, Parrish TB, Apkarian Av. Chronic pain and the emotional brain: specific brain activity associated with spontaneous fluctuations of intensity of chronic back pain. J Neurosci 2006;26:12165–73. - PMC - PubMed