. 2022 Jul 30;14(15):1-24.
doi: 10.3390/w14152361.

Developing Indicators of Nutrient Pollution in Streams Using 16S rRNA Gene Metabarcoding of Periphyton-Associated Bacteria

Affiliations

Developing Indicators of Nutrient Pollution in Streams Using 16S rRNA Gene Metabarcoding of Periphyton-Associated Bacteria

Erik M Pilgrim et al. Water (Basel). .

Abstract

Indicators based on nutrient-biota relationships in streams can inform water quality restoration and protection programs. Bacterial assemblages could be particularly useful indicators of nutrient effects because they are species-rich, important contributors to ecosystem processes in streams, and responsive to rapidly changing conditions. Here, we sampled 25 streams weekly (12-14 times each) and used 16S rRNA gene metabarcoding of periphyton-associated bacteria to quantify the effects of total phosphorus (TP) and total nitrogen (TN). Threshold indicator taxa analysis identified assemblage-level changes and amplicon sequence variants (ASVs) that increased or decreased with increasing TP and TN concentrations (i.e., low P, high P, low N, and high N ASVs). Boosted regression trees confirmed that relative abundances of gene sequence reads for these four indicator groups were associated with nutrient concentrations. Gradient forest analysis complemented these results by using multiple predictors and random forest models for each ASV to identify portions of TP and TN gradients at which the greatest changes in assemblage structure occurred. Synthesized statistical results showed bacterial assemblage structure began changing at 24 μg TP/L with the greatest changes occurring from 110 to 195 μg/L. Changes in the bacterial assemblages associated with TN gradually occurred from 275 to 855 μg/L. Taxonomic and phylogenetic analyses showed that low nutrient ASVs were commonly Firmicutes, Verrucomicrobiota, Flavobacteriales, and Caulobacterales, Pseudomonadales, and Rhodobacterales of Proteobacteria, whereas other groups, such as Chitinophagales of Bacteroidota, and Burkholderiales, Rhizobiales, Sphingomonadales, and Steroidobacterales of Proteobacteria comprised the high nutrient ASVs. Overall, the responses of bacterial ASV indicators in this study highlight the utility of metabarcoding periphyton-associated bacteria for quantifying biotic responses to nutrient inputs in streams.

Keywords: 16S; TITAN; agriculture; bioassessment; biomonitoring; boosted regression trees; gradient forest; nitrogen; periphyton; phosphorus; threshold indicator taxa analysis.


Conflict of interest statement

Conflicts of Interest: The authors declare no conflict of interest.

Figures

Figure 1.
Figure 1.
Map of collection sites in the East Fork of the Little Miami River Watershed.
Figure 2.
Figure 2.
Nonmetric multidimensional scaling ordination showing Spearman correlations of axis scores with total phosphorus (TP), total nitrogen (TN), watershed percent forest, watershed percent agriculture, and relative abundances of low P, low N, high P, and high N bacterial ASVs. Vectors are scaled to span the range of possible correlation coefficients (−1 to 1) along NMDS axes.
Figure 3.
Figure 3.
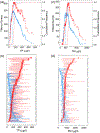
Threshold indicator taxa analysis showing sumZ scores and change points of ASVs for TP (a,b) and TN (c,d). Filtered refers to results using only ASVs identified as being pure (consistent response direction in >95% of bootstrap replicates) and reliable (consistently significant responses in >95% of bootstrap replicates). Red shows increaser sumZ scores and ASVs; blue shows decreaser sumZ scores and ASVs. For (a,c), circles; show the sumZ scoses of decreaser tend increaser ASVs at each observed nutrient concentration, and cumulative frequencies show the distribution of assemblage change points (max sumZ) based on 100 bootstraps. For (b,d), open circles show change points for each ASV (y-axis tick mares) scaled according to magnitude; of z scores, and dotted liners show the 5th and 95th quantiles based on 1000 bootstraps. Narrow peaks in sumZ scores, steep increases in the cumulative frequency curves, and multiple ASV change points occurring within a narrow range of TP or TN concentrations suggest nutrient thresholds at these concentrations. Broad peaks in sumZ scores, gradual increases in cumulative frequency curves, and gradual addition of ASV change points indicate more gradual responses to nutrient concentration and a longer gradient of community change.
Figure 4.
Figure 4.
Partial dependence plots from boosted regression trees showing responses of bacterial metrics to TP(a,b) or TN (c,d) while controlling for the average effect of other variables. FF = fitted functions. Rug plots show deciles of predictor values.
Figure 5.
Figure 5.
Gradient Forest analysis results showing bacterial ASV assemblage responses to TP (a) and TN (b). Compositional change based on aggregating ASV responses were determined lay split importance and values along TP and TN gradients (bars) and the ratios (blue lines) of split density (black lines) to data density (red lines). Peaks and regions of standardized split density plots with ratios above 1 (horizontal dashed blue lines) mark portions of the TP or TN gradient within which ASV compositional change is relatively greater other points along the nutrient gradient.
Figure 6.
Figure 6.
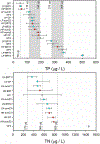
Summary of change points for TP and TN across the indicator analyses. Circles denote the mid-response value with horizontal bars show 5th to 95th quantiles for TITAN results and the beginning and end of responses for boosted regression trees and gradient forest results. Light blue circles are for low nutrient taxa, red circles are for high nutrient taxa, and gray circles are assemblage changes from gradient forest analytes. Bacterial responses occurred at multiple values along the TP or TN gradients and those are noted as sumZ1, sumZ2, BRT1, BRT2, etc. Vertical dashed lines and gray bars mark concentrations on the TP or TN gradients with substantial changes in bacterial assemblage. (LP = low phosphorus, LN = low nitrogen, HP = high phosphorus, HN = high nitrogen, CP = change point, BRT = boosted regression tree analysis, GF = gradient forest analysis). GF2 has no horizontal bars because it only briefly exceeded the density-of-splits to density-of-data ratio of 1.
Figure 7.
Figure 7.
Phylogenetic tree of the 429 ASVs comprising 75% of the total relative abundance among all samples. Indicator ASVs from TITAN are marked. Major bacterial taxonomic groups are color coded in the legend in the order they appear in the tree, clockwise from the cyanobacteria near the top. Groups with only 1 or 2 members are unmarked.
Figure 8.
Figure 8.
Breakdown of the indicator ASVs within the top 15 bacterial groups by count (a) or by proportion (b).

References

    1. Beusen AHW; Bouwman AF; Van Beek LPH; Mogollón JM; Middelburg JJ Global riverine N and P transport to ocean increased during the 20th century despite increased retention along the aquatic continuum. Biogeosciences 2016, 13, 2441–2451.
    1. Sabo RD; Clark CM; Bash J; Sobota D; Cooter E; Dobrowski JP; Houlton BZ; Rea A; Schwede D; Morford SL; et al. Decadal shift in nitrogen inputs and fluxes across the contiguous United States: 2002–2012. J. Geophys. Res.-Biogeosci 2019, 124, 3104–3124.
    1. Sabo RD; Clark CM; Gibbs DA; Metson GS; Todd MJ; LeDuc SD; Greiner D; Fry JA; Polinsky R; Yang Q; et al. Phosphorus inventory for the conterminous United States (2002–2012). J. Geophys. Res.-Biogeosci 2021, 126, e2020JG005684. - PMC - PubMed
    1. United States Environmental Protection Agency. National Rivers and Streams Assessment 2008–2009: A Collaborative Survey; EPA/841/R-16/007; Office of Water and Office of Research and Development: Washingon, DC, USA, 2016.
    1. Dodds WK; Smith VH Nitrogen, phosphorus, and eutrophication in streams. Inland Waters 2016, 6, 155–164.

LinkOut - more resources