

Causal association of epigenetic aging and COVID-19 severity and susceptibility: A bidirectional Mendelian randomization study
- PMID: 36213637
- PMCID: PMC9538153
- DOI: 10.3389/fmed.2022.989950
Causal association of epigenetic aging and COVID-19 severity and susceptibility: A bidirectional Mendelian randomization study
Abstract
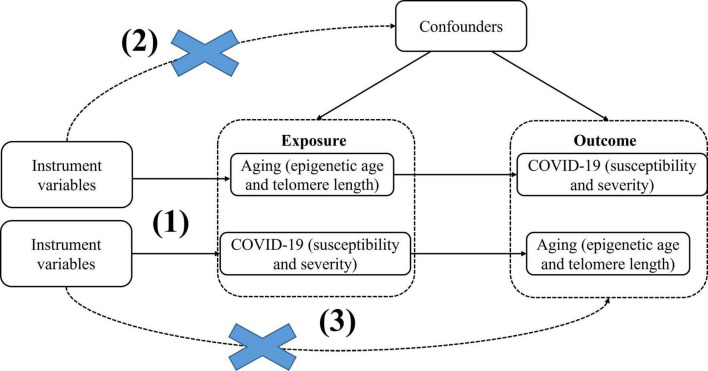
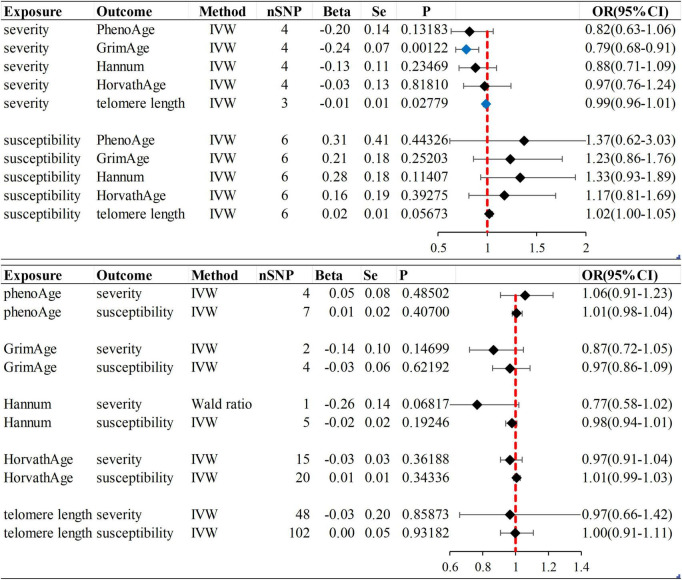
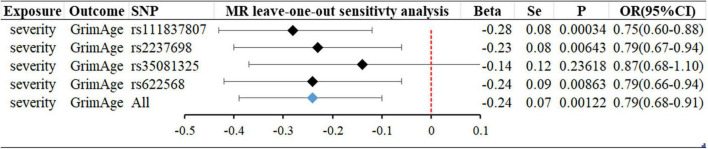
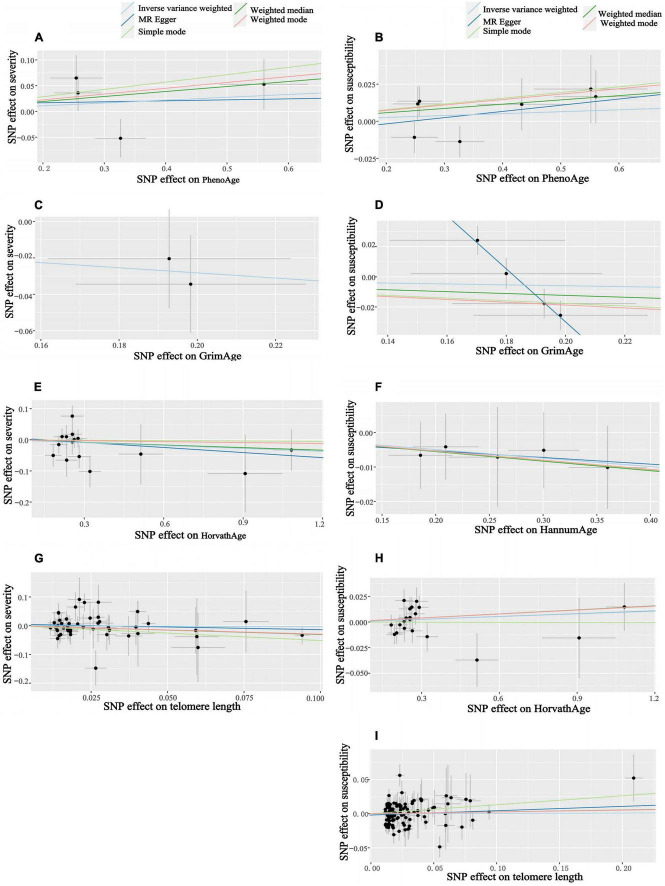
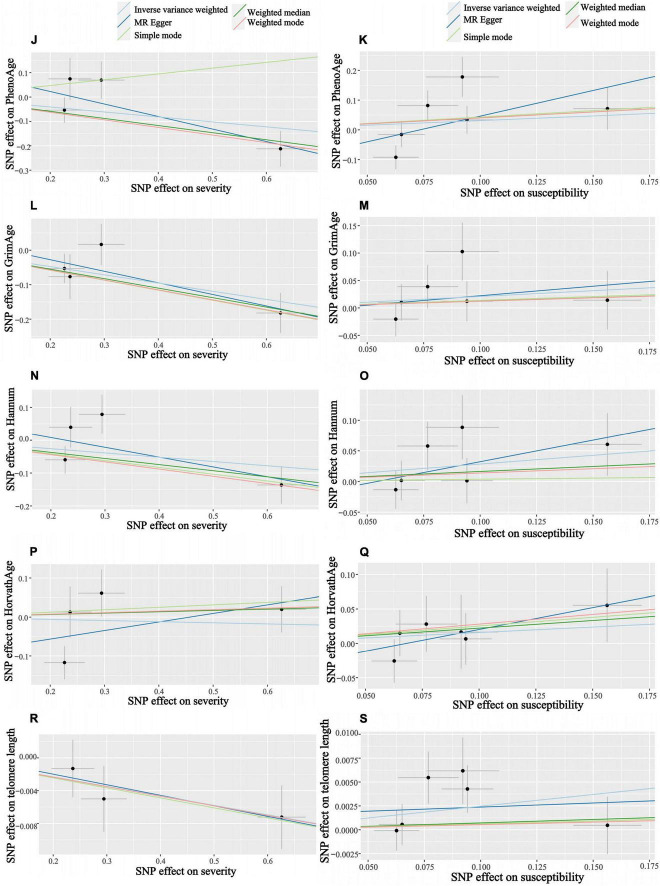
Observational data from China, the United States, France, and Italy suggest that chronological age is an adverse COVID-19 outcome risk factor, with older patients having a higher severity and mortality rate than younger patients. Most studies have gotten the same view. However, the role of aging in COVID-19 adverse effects is unclear. To more accurately assess the effect of aging on adverse COVID-19, we conducted this bidirectional Mendelian randomization (MR) study. Epigenetic clocks and telomere length were used as biological indicators of aging. Data on epigenetic age (PhenoAge, GrimAge, Intrinsic HorvathAge, and HannumAge) were derived from an analysis of biological aging based on genome-wide association studies (GWAS) data. The telomere length data are derived from GWAS and the susceptibility and severity data are derived from the COVID-19 Host Genetics Initiative (HGI). Firstly, epigenetic age and telomere length were used as exposures, and following a screen for appropriate instrumental variables, we used random-effects inverse variance weighting (IVW) for the main analysis, and combined it with other analysis methods (e.g., MR Egger, Weighted median, simple mode, Weighted mode) and multiple sensitivity analysis (heterogeneity analysis, horizontal multiplicity analysis, "leave-one-out" analysis). For reducing false-positive rates, Bonferroni corrected significance thresholds were used. A reverse Mendelian randomization analysis was subsequently performed with COVID-19 susceptibility and severity as the exposure. The results of the MR analysis showed no significant differences in susceptibility to aging and COVID-19. It might suggest that aging is not a risk factor for COVID-19 infection (P-values are in the range of 0.05-0.94). According to the results of our analysis, we found that aging was not a risk factor for the increased severity of COVID-19 (P > 0.05). However, severe COVID-19 can cause telomere lengths to become shorter (beta = -0.01; se = 0.01; P = 0.02779). In addition to this, severe COVID-19 infection can slow the acceleration of the epigenetic clock "GrimAge" (beta = -0.24, se = 0.07, P = 0.00122), which may be related to the closely correlation of rs35081325 and COVID-19 severity. Our study provides partial evidence for the causal effects of aging on the susceptibility and severity of COVID-19.
Keywords: COVID-19; Mendelian randomization; SARS-CoV-2; aging; epigenetic age; genome-wide association study (GWAS); telomere length.
Copyright © 2022 Xu, Zhang, Shi, Chen, Shi and Yu.
Conflict of interest statement
The authors declare that the research was conducted in the absence of any commercial or financial relationships that could be construed as a potential conflict of interest.
Figures
Similar articles
-
Causal association of obesity with epigenetic aging and telomere length: a bidirectional mendelian randomization study.Lipids Health Dis. 2024 Mar 12;23(1):78. doi: 10.1186/s12944-024-02042-y. Lipids Health Dis. 2024. PMID: 38475782 Free PMC article.
-
Assessing the causal role of epigenetic clocks in the development of multiple cancers: a Mendelian randomization study.Elife. 2022 Mar 29;11:e75374. doi: 10.7554/eLife.75374. Elife. 2022. PMID: 35346416 Free PMC article.
-
Epigenetic age acceleration and risk of aortic valve stenosis: a bidirectional Mendelian randomization study.Clin Epigenetics. 2024 Mar 12;16(1):41. doi: 10.1186/s13148-024-01647-5. Clin Epigenetics. 2024. PMID: 38475866 Free PMC article.
-
Association Between Telomere Length and Skin Cancer and Aging: A Mendelian Randomization Analysis.Front Genet. 2022 Jul 12;13:931785. doi: 10.3389/fgene.2022.931785. eCollection 2022. Front Genet. 2022. PMID: 35903361 Free PMC article.
-
The impact of COVID-19 on "biological aging".Front Immunol. 2024 Jun 10;15:1399676. doi: 10.3389/fimmu.2024.1399676. eCollection 2024. Front Immunol. 2024. PMID: 38919619 Free PMC article. Review.
Cited by
-
SARS-CoV-2 and the DNA damage response.J Gen Virol. 2023 Nov;104(11):001918. doi: 10.1099/jgv.0.001918. J Gen Virol. 2023. PMID: 37948194 Free PMC article. Review.
-
Enzymatic approaches against SARS-CoV-2 infection with an emphasis on the telomere-associated enzymes.Biotechnol Lett. 2023 Mar;45(3):333-345. doi: 10.1007/s10529-023-03352-4. Epub 2023 Jan 28. Biotechnol Lett. 2023. PMID: 36707451 Free PMC article. Review.
-
Causal associations between type 1 diabetes and COVID-19 infection and prognosis: a two-sample Mendelian randomization study.BMJ Open Diabetes Res Care. 2023 Jun;11(3):e003167. doi: 10.1136/bmjdrc-2022-003167. BMJ Open Diabetes Res Care. 2023. PMID: 37311601 Free PMC article.
-
Causal Association of Telomere Length and Loss of Bone: a Directional Mendelian Randomization Study of Multi-Outcomes.Appl Biochem Biotechnol. 2024 Oct;196(10):7045-7063. doi: 10.1007/s12010-024-04899-2. Epub 2024 Mar 13. Appl Biochem Biotechnol. 2024. PMID: 38478320
-
The causal effects of intelligence and fluid intelligence on Parkinson's disease: a Mendelian randomization study.Front Aging Neurosci. 2024 May 23;16:1388795. doi: 10.3389/fnagi.2024.1388795. eCollection 2024. Front Aging Neurosci. 2024. PMID: 38846742 Free PMC article.
References
-
- World Health Organization [WHO]. WHO. Coronavirus Disease (COVID-19) Dashboard. (2022). Available online at: https://covid19.who.int/ (accessed May 14, 2022).
-
- Levin AT, Hanage WP, Owusu-Boaitey N, Cochran KB, Walsh SP, Meyerowitz-Katz G. Assessing the age specificity of infection fatality rates for COVID-19: systematic review, meta-analysis, and public policy implications. Eur J Epidemiol. (2020) 35:1123–38. 10.1007/s10654-020-00698-1 - DOI - PMC - PubMed
Publication types
LinkOut - more resources
Full Text Sources
Miscellaneous