. 2022 Sep 21:16:886465.
doi: 10.3389/fnins.2022.886465. eCollection 2022.

Predicting the true extent of glioblastoma based on probabilistic tractography

Affiliations

Predicting the true extent of glioblastoma based on probabilistic tractography

David Kis et al. Front Neurosci. .

Abstract

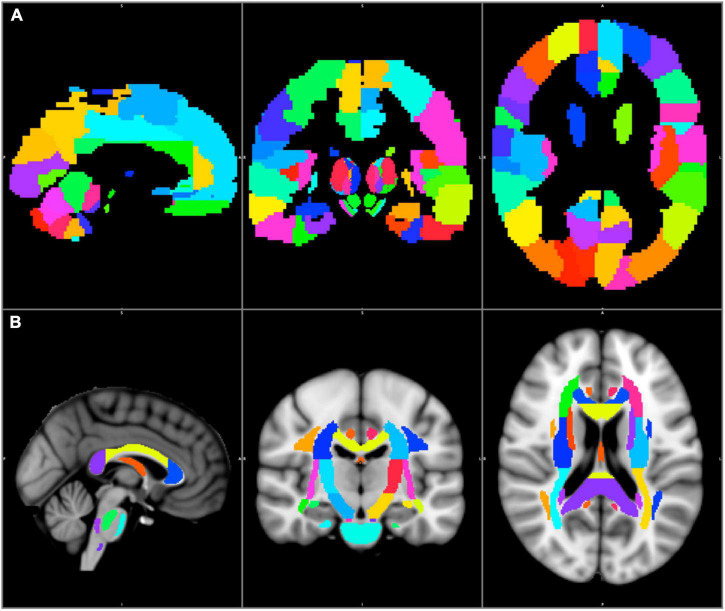
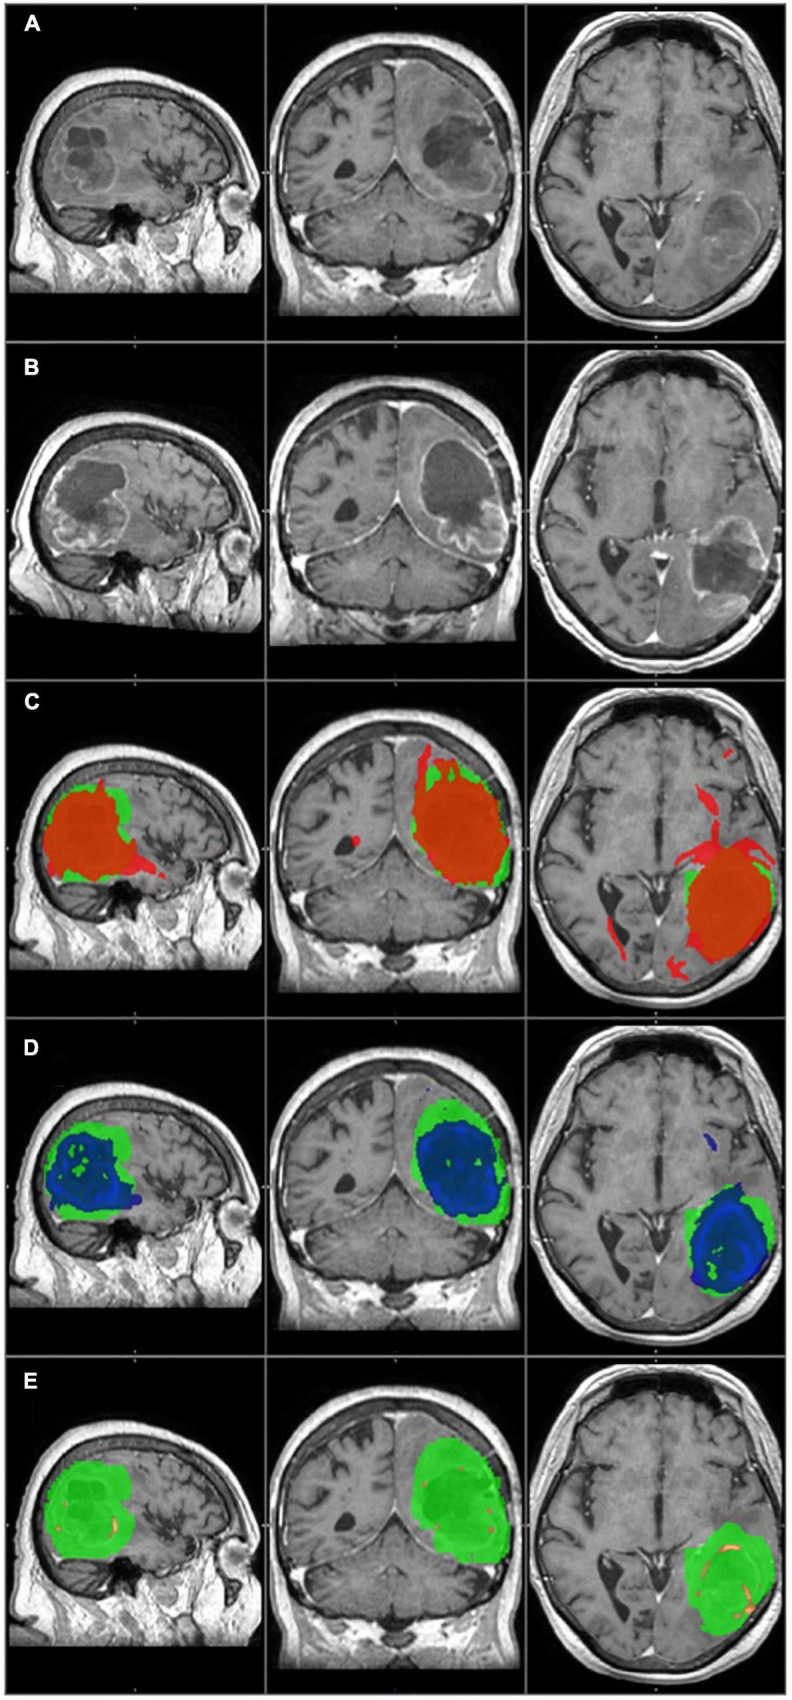
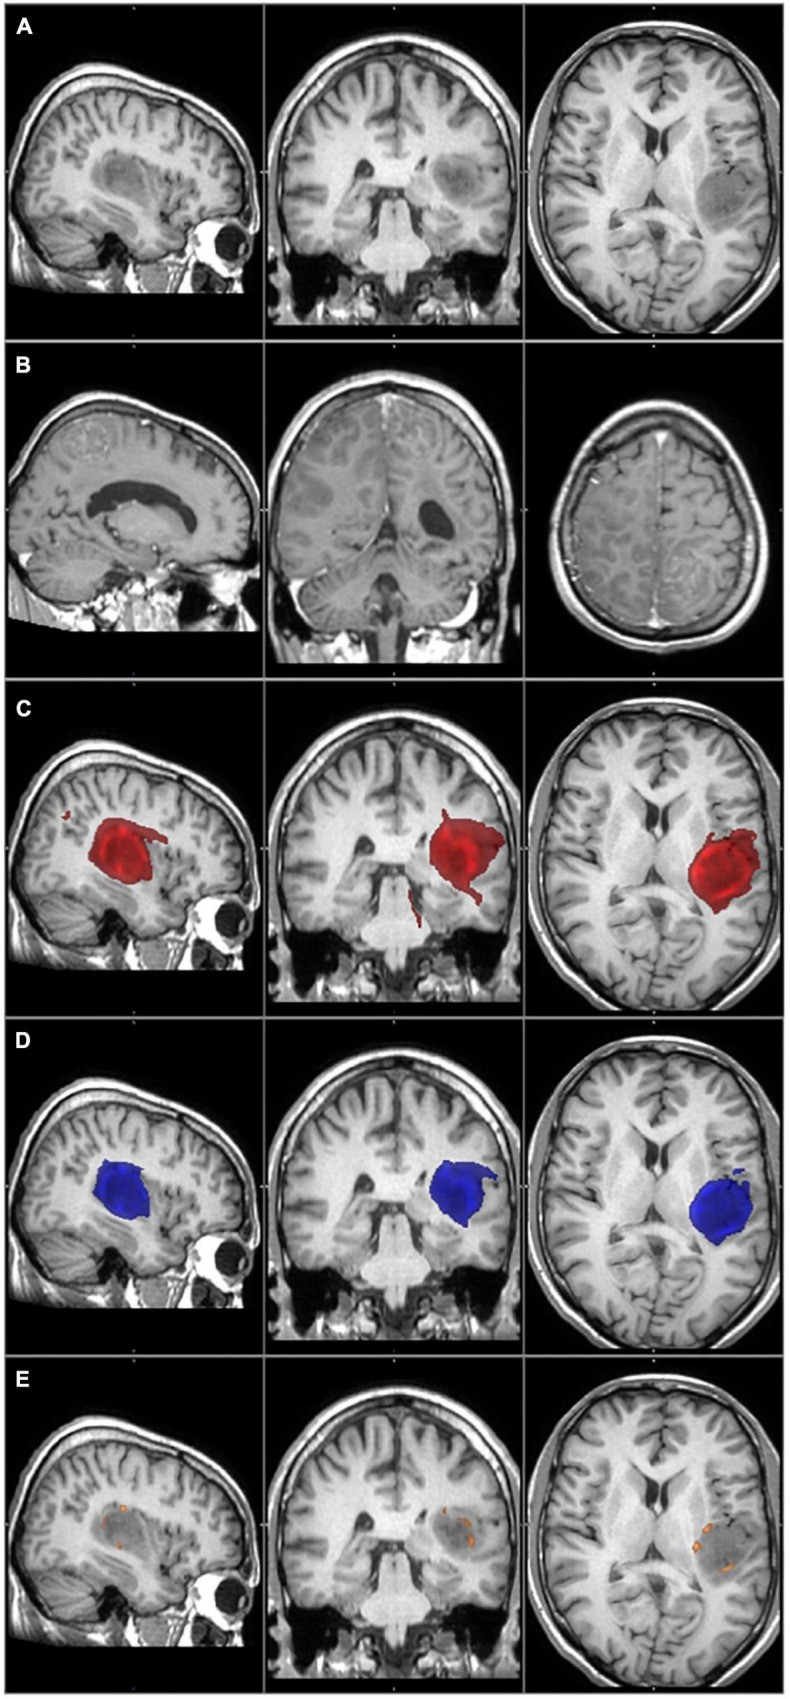
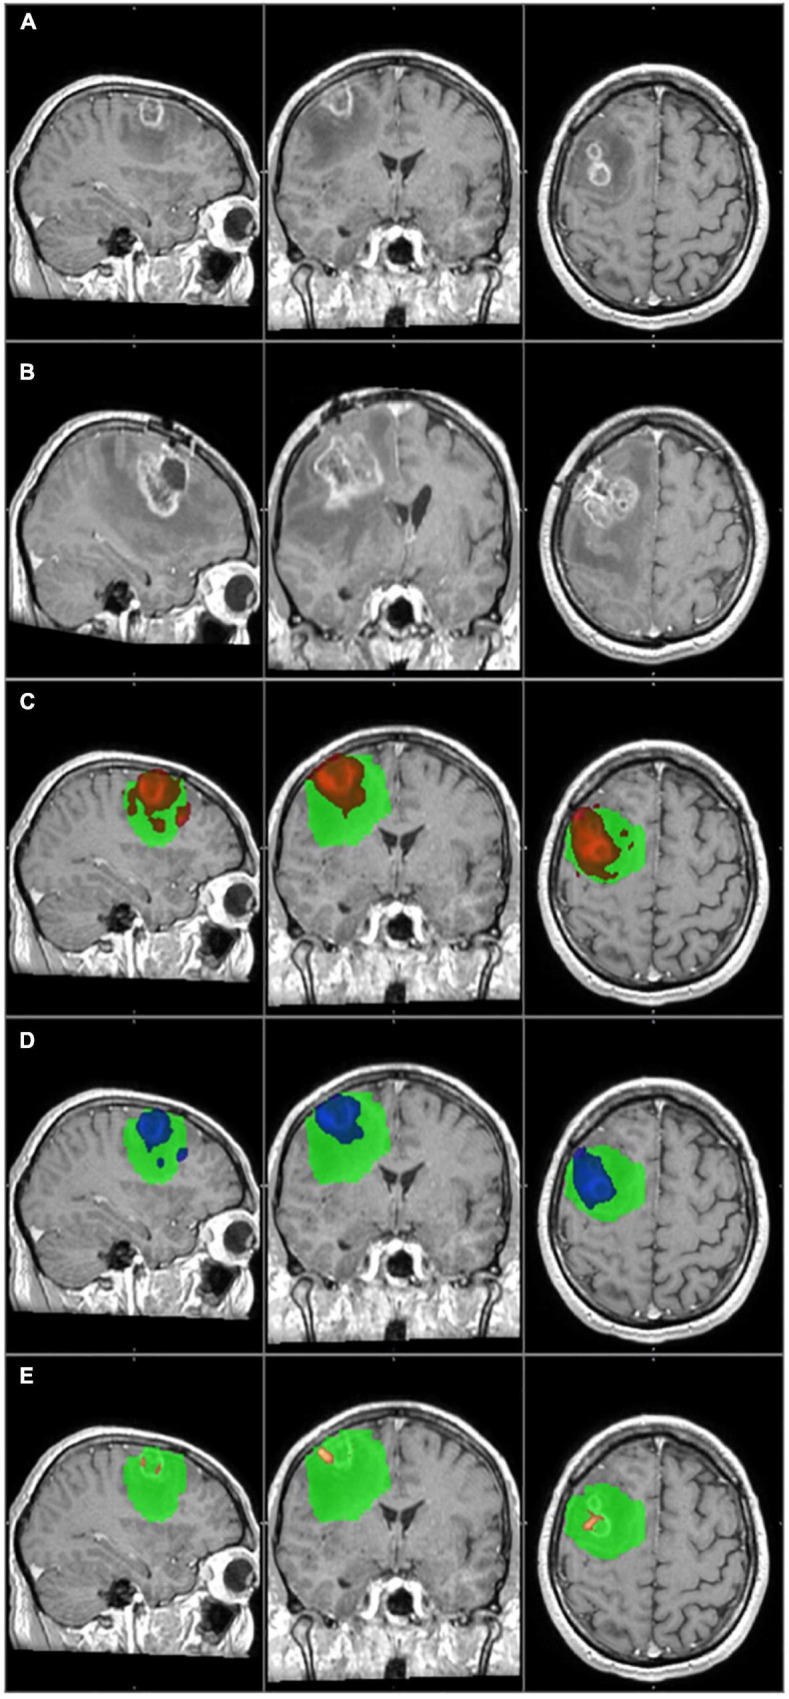
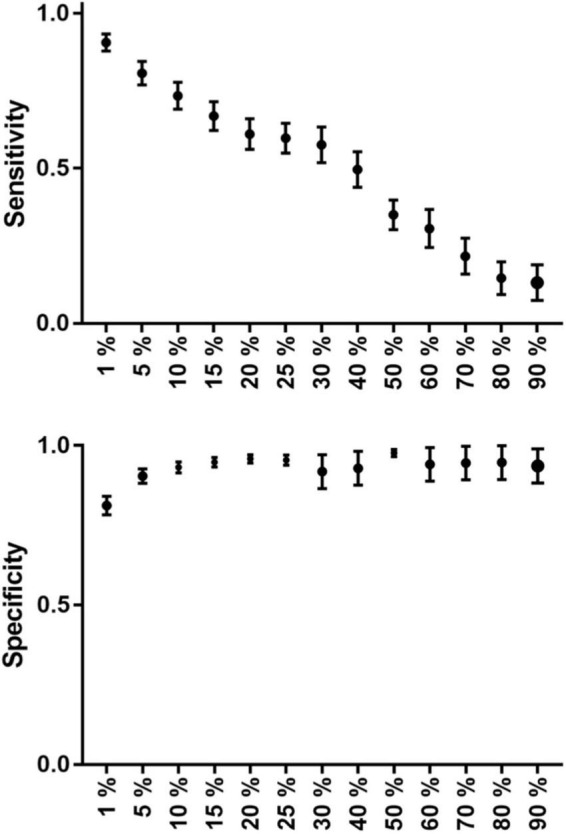
Glioblastoma is the most frequent type of primary brain tumors. Despite the advanced therapy, most of the patients die within 2 years after the diagnosis. The tumor has a typical appearance on MRI: a central hypointensity surrounded by an inhomogeneous, ring-shaped contrast enhancement along its border. Too small to be recognized by MRI, detached individual tumor cells migrate along white matter fiber tracts several centimeters away from the edge of the tumor. Usually these cells are the source of tumor recurrence. If the infiltrated brain areas could be identified, longer survival time could be achieved through supratotal resection and individually planned radiation therapy. Probabilistic tractography is an advanced imaging method that can potentially be used to identify infiltrated pathways, thus the real extent of the glioblastoma. Our study consisted of twenty high grade glioma patients. Probabilistic tractography was started from the tumor. The location of tumor recurrence on follow-up MRI was considered as the primary infiltrated white matter tracts. The results of probabilistic tractography were evaluated at thirteen different thresholds. The overlap with the tumor recurrence of each threshold level was then defined to calculate the sensitivity and specificity. In the group level, sensitivity (81%) and specificity (90%) were the most reliable at 5% threshold level. There were two outliers in the study group, both with high specificity and very low sensitivity. According to our results, probabilistic tractography can help to define the true extent of the glioblastoma at the time of diagnosis with high sensitivity and specificity. Individually planned surgery and irradiation could provide a better chance of survival in these patients.

Keywords: extended survival; glioblastoma; infiltration; probabilistic tractography; tumor recurrence.


Conflict of interest statement

The authors declare that the research was conducted in the absence of any commercial or financial relationships that could be construed as a potential conflict of interest.

Figures

FIGURE 1
FIGURE 1
The AAL3 cortical (A) and the JHU–ICBM–DTI–81 white matter labels subcortical (B) regions are shown in the MNI152 1 mm space.
FIGURE 2
FIGURE 2
The primary tumor, the recurrence tumor, and the overlap between the different TCs and the tumor recurrence mask of the representative case of Patient 14 are displayed in this figure. All images are transformed to the MNI152 1 mm space. (A) The preoperative contrast enhanced T1 image. A huge tumor with ring shaped contrast enhancement can be seen in the left temporo-parito-occipital region. (B) The size and the location of the tumor recurrence. (C) The 1% TC (red) is overlapped on the tumor recurrence mask (green). (D) The 5% TC (blue) is overlapped on the tumor recurrence mask (green). (E) The 40% TC (red-yellow) is overlapped on the tumor recurrence mask (green). (C–E) Are on the preoperative T1 images. Although the sensitivity is higher at 1% than at 5%, the specificity is lower due to the greater number of false positive regions. The best overlap can be seen at the 5% threshold level. At 40%, the TC is almost invisible and covers only a small portion of the tumor recurrence mask resulting in high specificity but low sensitivity.
FIGURE 3
FIGURE 3
The primary tumor, the recurrence tumor, and the overlap between the different TCs and the tumor recurrence mask of the representative case of Patient 1 are displayed in this figure. All images are transformed to the MNI152 1 mm space. (A) The preoperative contrast enhanced T1 image. The tumor is located in the left temporo-parietal region and does not enhance the contrast agent, but histology verified the glioblastoma. (B) The size and the location of the tumor recurrence. (C) The 1% TC (red) is overlapped on the tumor recurrence mask (green). (D) The 5% TC (blue) is overlapped on the tumor recurrence mask (green). (E) The 40% TC (red-yellow) is overlapped on the tumor recurrence mask (green). (C–E) Are on the preoperative T1 images. The main part of the recurrence is far away from the original tumor location, which leads to very low sensitivity even at the 1% threshold level.
FIGURE 4
FIGURE 4
The primary tumor, the recurrence tumor, and the overlap between the different TCs and the tumor recurrence mask of the representative case of Patient 20 are displayed in this figure. All images are transformed to the MNI152 1 mm space. (A) The preoperative contrast enhanced T1 image. Two small tumors with ring shaped contrast enhancement can be seen in the right frontal region. (B) The size and the location of the tumor recurrence. (C) The 1% TC (red) is overlapped on the tumor recurrence mask (green). (D) The 5% TC (blue) is overlapped on the tumor recurrence mask (green). (E) The 40% TC (red-yellow) is overlapped on the tumor recurrence mask (green). (C–E) Are on the preoperative T1 images. As it can be seen, the TCs are fully overlapping with the tumor recurrence mask and therefore the specificity is 100% at every threshold. On the other hand the recurrence remarkably exceeds the border of the TCs, and the sensitivity is low, even at 1%. Please note that the direction of the recurrence is in correspondence with the TCs, and the low sensitivity is the result of the fast tumor progression.
GRAPH 1
GRAPH 1
The group average sensitivity and specificity values (with standard error of mean) can be seen on this graph at each threshold level. Sensitivity decreases in a nearly linear fashion, while specificity has a nearly parabolic increase along the increasing threshold levels.

References

    1. Ahmed F. I., Abdullah K. G., Durgin J., Salinas R. D., O’Rourke D. M., Brem S. (2019). Evaluating the Association Between the Extent of Resection and Survival in Gliosarcoma. Cureus 11:e4374. 10.7759/cureus.4374 - DOI - PMC - PubMed
    1. Altieri R., Melcarne A., Soffietti R., Rudá R., Franchino F., Pellerino A., et al. (2019). Supratotal Resection of Glioblastoma: Is Less More? Surg. Technol. Int. 10 432–440. - PubMed
    1. Andersson J. L. R., Sotiropoulos S. N. (2016). An integrated approach to correction for off-resonance effects and subject movement in diffusion MR imaging. NeuroImage 125 1063–1078. 10.1016/j.neuroimage.2015.10.019 - DOI - PMC - PubMed
    1. Bammer R. (2003). Basic principles of diffusion-weighted imaging. Eur. J. Radiol. 45 169–184. 10.1016/s0720-048x(02)00303-0 - DOI - PubMed
    1. Barani I. J., Larson D. A. (2015). Radiation therapy of glioblastoma. Cancer Treat. Res. 163 49–73. 10.1007/978-3-319-12048-5_4 - DOI - PubMed

LinkOut - more resources