. 2022 Oct 10:11:e79346.
doi: 10.7554/eLife.79346.

Evolutionary rescue of phosphomannomutase deficiency in yeast models of human disease

Affiliations

Evolutionary rescue of phosphomannomutase deficiency in yeast models of human disease

Ryan C Vignogna et al. Elife. .

Abstract

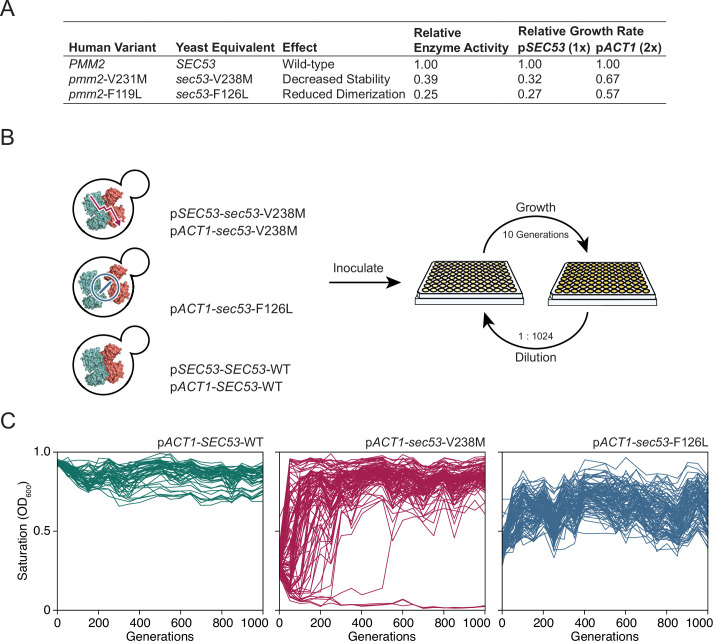
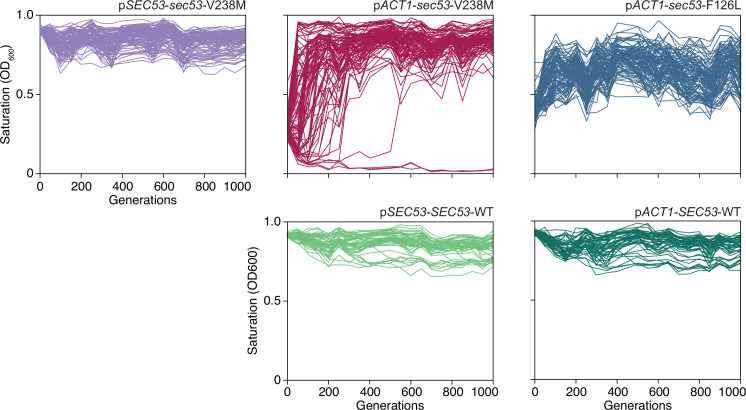
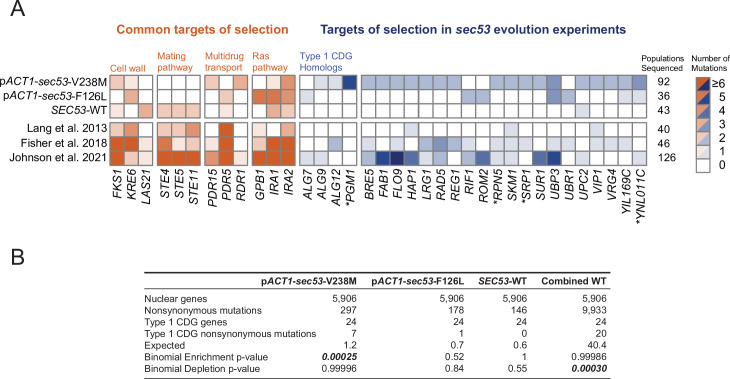
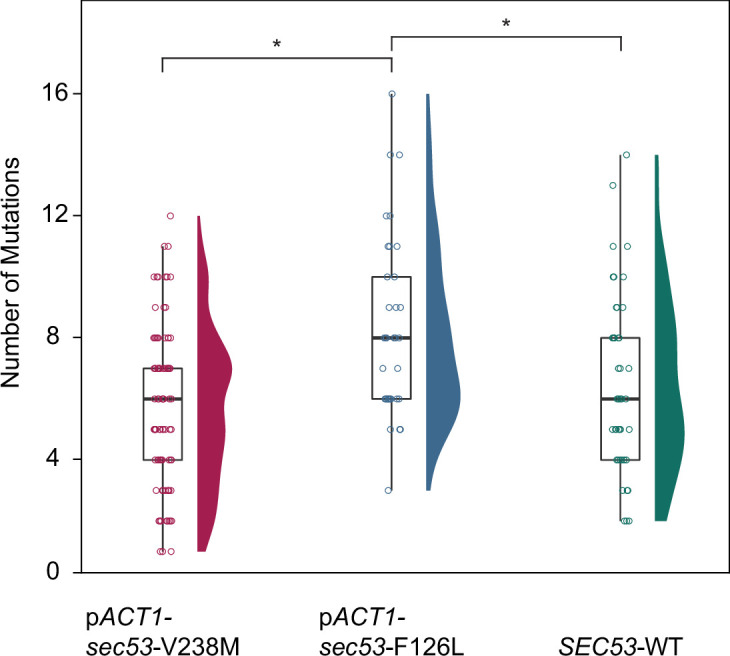
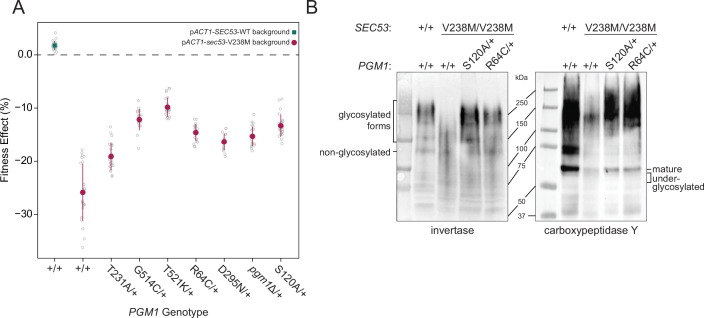
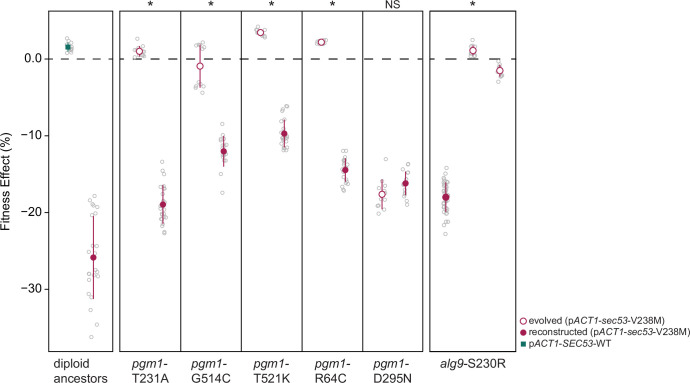
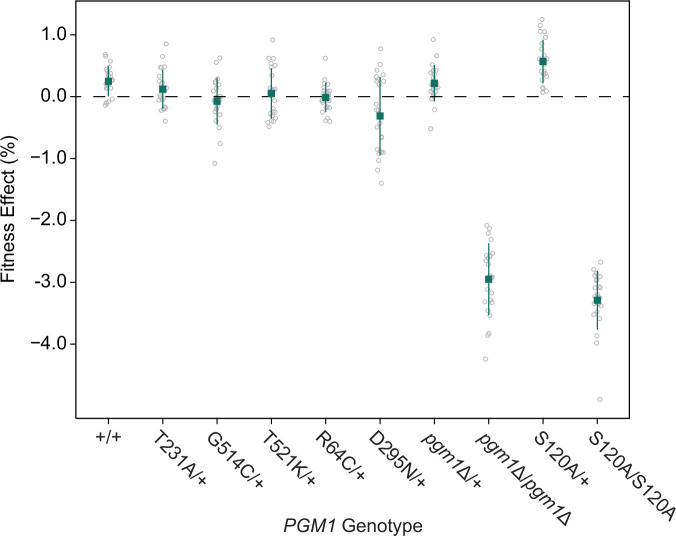
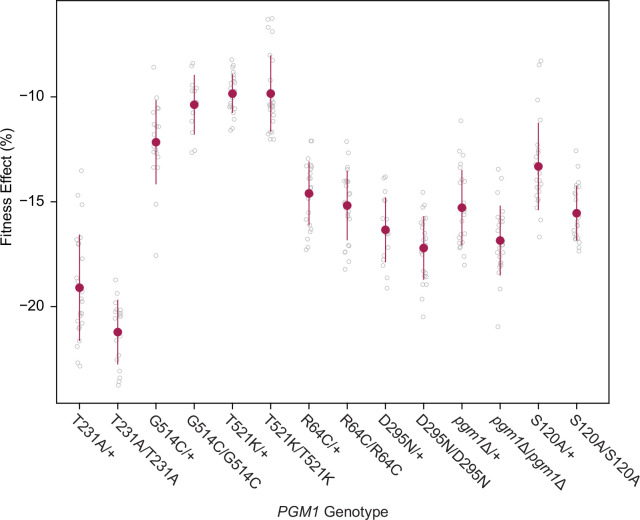
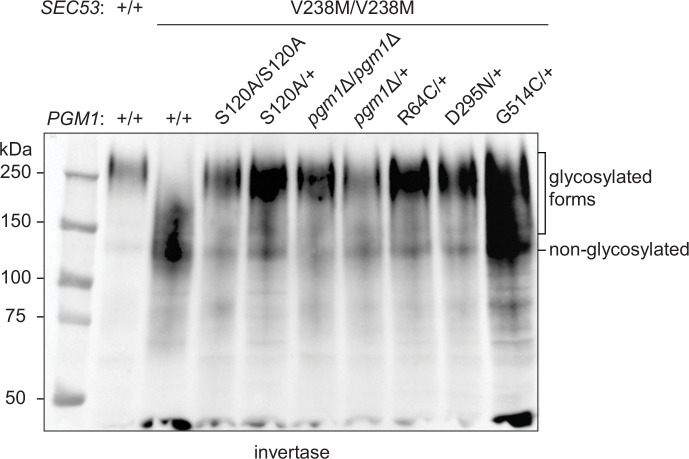
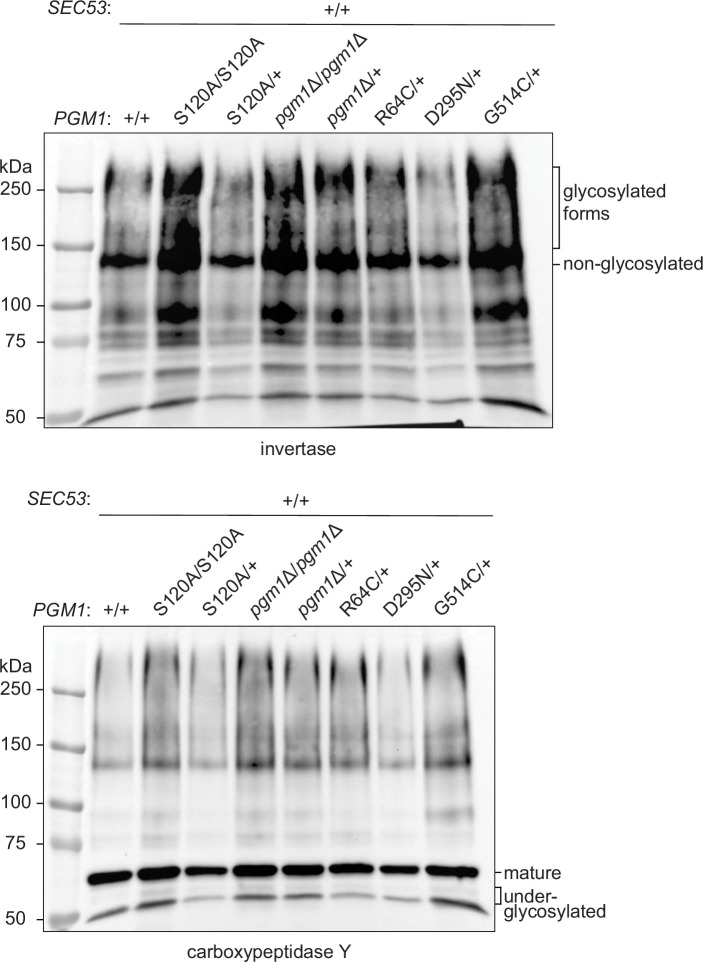
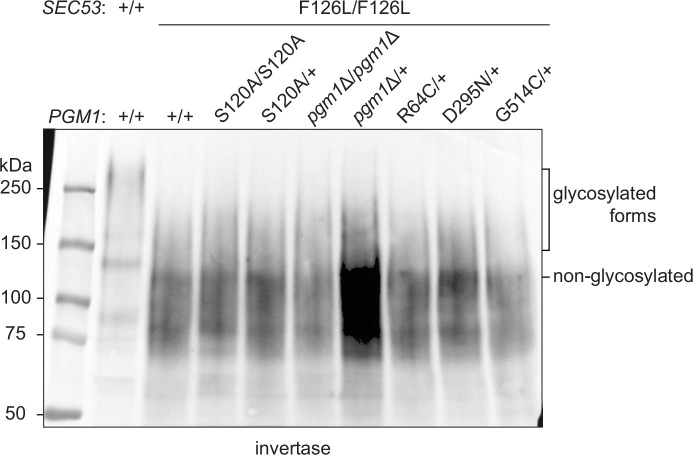
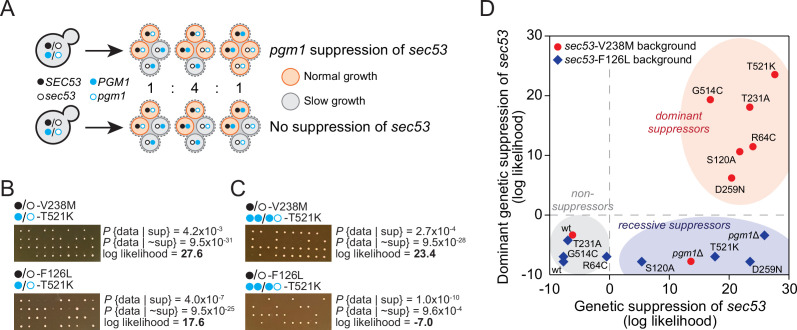
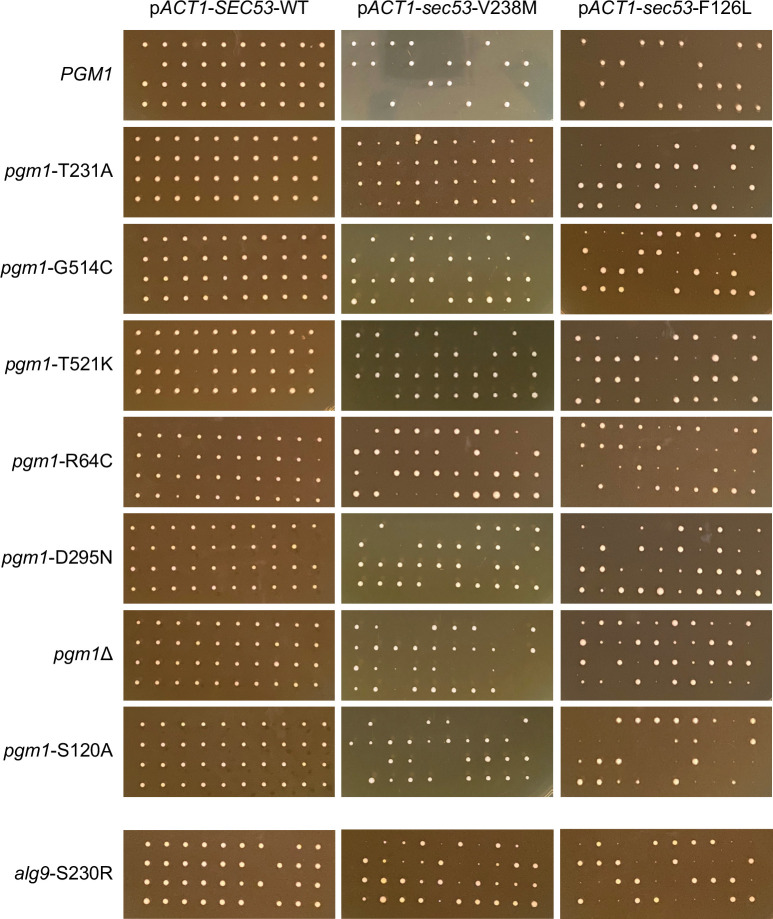
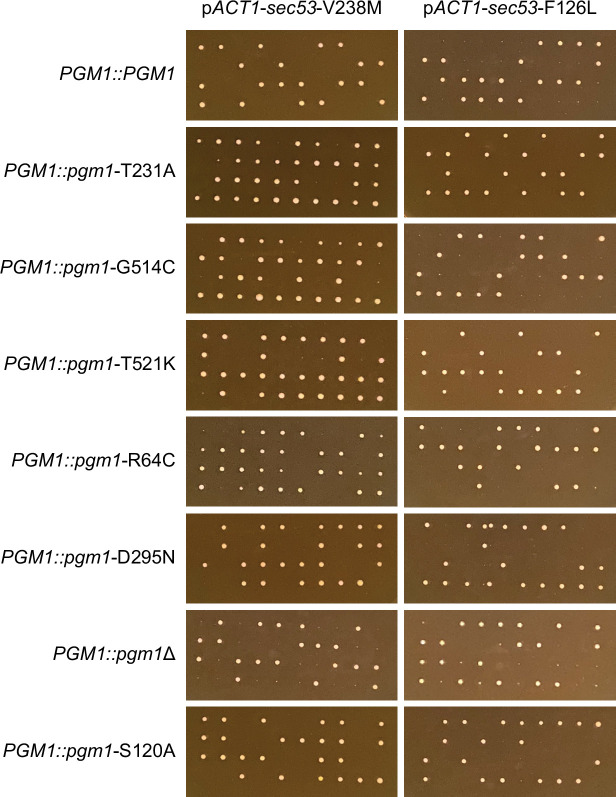
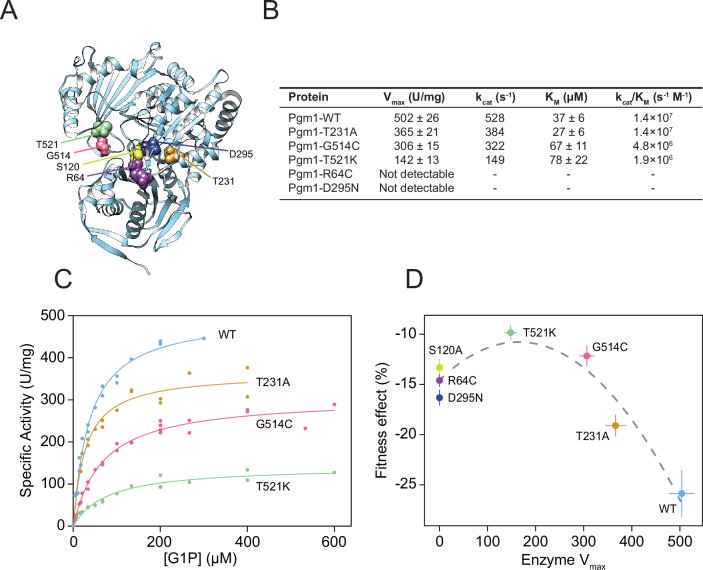
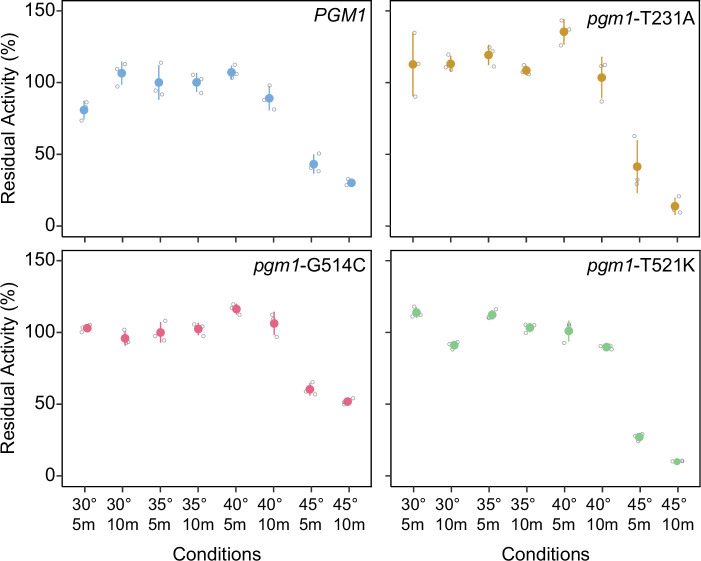
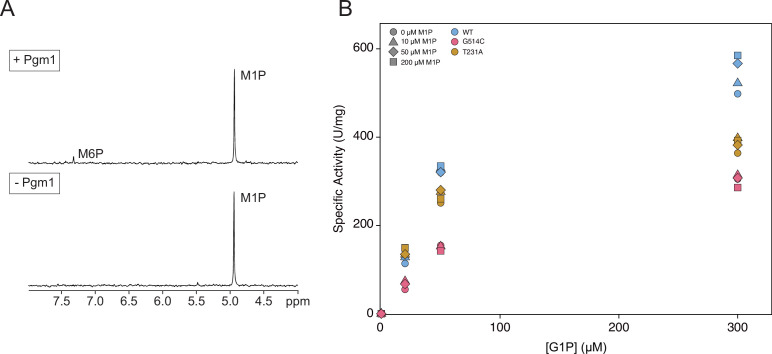
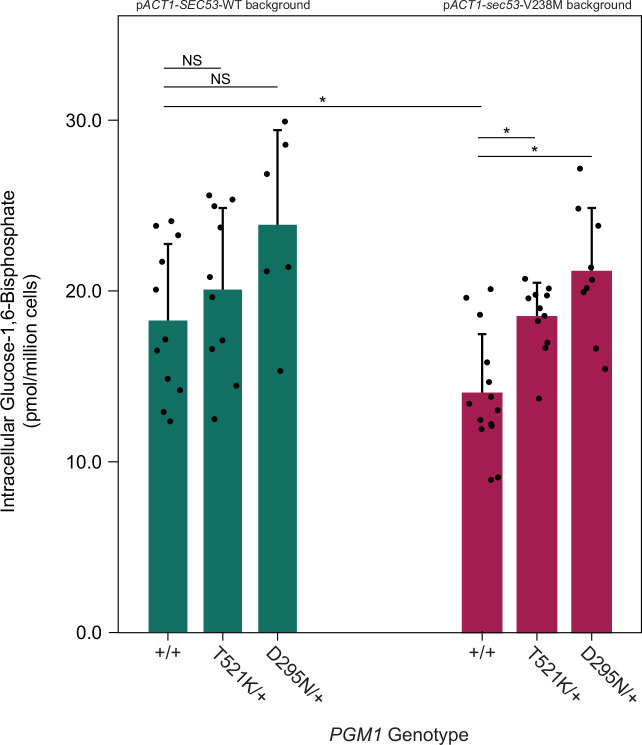
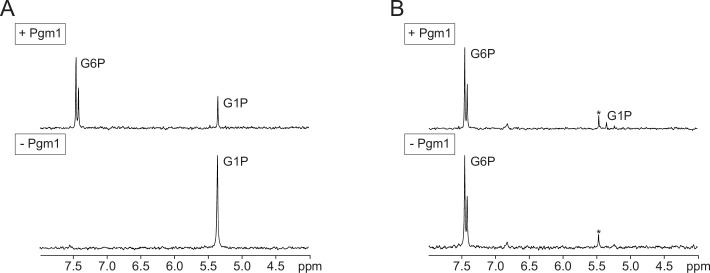
The most common cause of human congenital disorders of glycosylation (CDG) are mutations in the phosphomannomutase gene PMM2, which affect protein N-linked glycosylation. The yeast gene SEC53 encodes a homolog of human PMM2. We evolved 384 populations of yeast harboring one of two human-disease-associated alleles, sec53-V238M and sec53-F126L, or wild-type SEC53. We find that after 1000 generations, most populations compensate for the slow-growth phenotype associated with the sec53 human-disease-associated alleles. Through whole-genome sequencing we identify compensatory mutations, including known SEC53 genetic interactors. We observe an enrichment of compensatory mutations in other genes whose human homologs are associated with Type 1 CDG, including PGM1, which encodes the minor isoform of phosphoglucomutase in yeast. By genetic reconstruction, we show that evolved pgm1 mutations are dominant and allele-specific genetic interactors that restore both protein glycosylation and growth of yeast harboring the sec53-V238M allele. Finally, we characterize the enzymatic activity of purified Pgm1 mutant proteins. We find that reduction, but not elimination, of Pgm1 activity best compensates for the deleterious phenotypes associated with the sec53-V238M allele. Broadly, our results demonstrate the power of experimental evolution as a tool for identifying genes and pathways that compensate for human-disease-associated alleles.

Keywords: PMM2-CDG; S. cerevisiae; congenital disorders of glycosylation; evolutionary biology; experimental evolution; genetics; genomics; humanized yeast.


Conflict of interest statement

RV, MA, MM, JN, RS, EP, GA, GL No competing interests declared

Figures

Figure 1.
Figure 1.. Experimental evolution of yeast models of congenital disorders of glycosylation.
(A) Table of the various sec53 alleles used in this study. In vitro enzymatic activities of Pmm2 are relative to wild-type Pmm2 and were previously reported (Pirard et al., 1999). Relative growth rates of yeast carrying various SEC53 alleles were previously reported (Lao et al., 2019). (B) Diagram of the evolution experiment. Yeast carrying sec53 mutations implicated in human disease were used to initiate replicate populations in 96-well plates: 96 populations of each mutant genotype and 48 populations of each wild-type genotype. Populations were propagated in rich glucose media, unshaken, for 1000 generations. (C) Single time-point OD600 readings of populations were taken every 50 generations during the evolution experiment as a measure of growth rate. Each line represents one population.
Figure 1—figure supplement 1.
Figure 1—figure supplement 1.. OD600 readings of each population.
Single time-point OD600 readings of populations over the course of the evolution experiment. Every 50 generations, following daily transfer, populations were resuspended and OD was measured. Each line represents one population.
Figure 2.
Figure 2.. Mutations in Type 1 congenital disorders of glycosylation (CDG) homologs are enriched in sec53-V238M populations.
(A) Heatmap showing the number of nonsynonymous mutations per gene that arose in the evolution experiment. Genes with two or more unique nonsynonymous mutations (and each Type 1 CDG homolog with at least one mutation) are shown. pSEC53-SEC53-WT and pACT1-SEC53-WT are grouped as ‘SEC53-WT’. For comparison, we show data from previously reported evolution experiments where the experimental conditions were identical to the conditions used here, aside from strain background and experiment duration (bottom three rows). Commonly mutated pathways are grouped for clarity. Asterisks (*) indicate previously known SEC53 genetic interactors (Costanzo et al., 2016; Kuzmin et al., 2018). (B) Binomial test for enrichment or depletion of mutations in Type 1 CDG homologs based on the number of nonsynonymous mutations observed in each experiment, the total number of yeast genes (5906), and the number of genes that are Type 1 CDG homologs (24). ‘Combined WT’ includes the SEC53-WT populations as well as three additional datasets: Lang et al., 2013, Fisher et al., 2018, and Johnson et al., 2021.
Figure 2—figure supplement 1.
Figure 2—figure supplement 1.. The number of de novo mutations per SEC53 genotype.
Each circle represents the number of SNPs and small indels present in a sequenced clone (Supplementary file 1). pSEC53-SEC53-WT and pACT1-SEC53-WT are grouped as ‘SEC53-WT’. Distribution of points are shown as violin plots. Only statistically significant differences shown (p < 0.05) with bars and astersisks (*). pACT1-sec53-V238M versus SEC53-WT (p = 0.326), pACT1-sec53-V238M versus pACT1-sec53-F126L (p > 0.0001), pACT1-sec53-F126L versus SEC53-WT (p = 0.0234) (df = 167, F = 9.67, one-way analysis of variance [ANOVA] with Tukey post hoc test).
Figure 3.
Figure 3.. Evolved mutations rescue fitness and protein glycosylation defects of pACT1-sec53-V238M.
(A) Average fitness effects and standard deviations of reconstructed heterozygous pgm1 mutations. Fitness effects were determined by competitive fitness assays against a fluorescently labeled version of the diploid pACT1-SEC53-WT ancestor. Replicate measurements are plotted as gray circles. Pairs of pgm1 fitness effects with non-statistically significant differences: R64C-D295N, R64C-pgm1Δ, R64C-S120A, D295N-pgm1Δ, G514C-T521K, G514C-S120A, and pgm1Δ-S120A (df = 194, F = 208.1, each p > 0.05, one-way analysis of variance [ANOVA] with Tukey post hoc test). (B) Western blots of invertase (left) and carboxypeptidase Y (right) from ancestral and reconstructed strains. In panels A and B, plus signs (+) indicate wild-type alleles. Genotypes are either homozygous wild-type (+/+), homozygous mutant (mutation/mutation), or heterozygous (mutation/+).
Figure 3—figure supplement 1.
Figure 3—figure supplement 1.. Fitness effects of reconstructed mutations and evolved clones containing those same mutations.
Average fitness effects and standard deviations of reconstructed heterozygous pgm1 and alg9 mutations (closed circles) compared to evolved clones containing those mutations plus three to nine additional mutations (open circles). Replicate measurements are plotted as gray circles. Note there are two clones from different populations with an alg9-S230R mutation. Asterisks (*) represent statically significant differences between fitness effects of evolved clones and fitness effects of reconstructed clones (Welch’s modified t-test): pgm1-T231A (p < 0.0001, t = 36.1, df = 28.9); pgm1-G514C (p < 0.0001, t = 11.8, df = 18.4); pgm1-T521K (p < 0.0001, t = 33.8, df = 27.3); pgm1-R64C (p < 0.0001, t = 52.9, df = 24.3); pgm1-D295N (p = 0.05, t = 2.10, df = 19.9); alg9-S230R (left) (p < 0.0001, t = 53.7, df = 49.7); alg9-S230R (right) (p < 0.0001, t = 44.1, df = 46.1).
Figure 3—figure supplement 2.
Figure 3—figure supplement 2.. Fitness effects of pgm1 mutations in the SEC53-WT background.
Average fitness effects and standard deviations of reconstructed pgm1 mutations in the diploid pACT1-SEC53-WT background. Replicate measurements are plotted as gray circles. Plus signs (+) indicate wild-type alleles.
Figure 3—figure supplement 3.
Figure 3—figure supplement 3.. Fitness effects of homozygous pgm1 mutations.
Average fitness effects and standard deviations of reconstructed pgm1 mutations in the diploid pACT1-sec53-V238M background as heterozygous (mutation/+) or homozygous (mutation/mutation) alleles. Replicate measurements are plotted as gray circles. Comparison of heterozygous and homozygous allele fitness effects (Welch’s modified t-test): pgm1-T231A (p = 0.002, t = 3.35, df = 38.6); pgm1-G514C (p = 0.008, t = 2.85, df = 27.8); pgm1-T521K (p = 0.996, t = 0.005, df = 34.0); pgm1-R64C (p = 0.219, t = 1.24, df = 45.7); pgm1-T231A (p = 0.077, t = 1.84, df = 36.4); pgm1Δ (p = 0.003, t = 3.12, df = 45.7); pgm1-S120A (p < 0.0001, t = 4.45, df = 38.6).
Figure 3—figure supplement 4.
Figure 3—figure supplement 4.. Effects of pgm1 mutations on invertase glycosylation in the pACT1-sec53-V238M background.
Western blot of invertase from reconstructed sec53/pgm1 strains.
Figure 3—figure supplement 5.
Figure 3—figure supplement 5.. Effects of pgm1 mutations on invertase and carboxypeptidase Y (CPY) glycosylation in the pACT1-SEC53-WT background.
Western blots of invertase and CPY from constructed SEC53/pgm1 strains.
Figure 3—figure supplement 6.
Figure 3—figure supplement 6.. Effects of pgm1 mutations on invertase glycosylation in the pACT1-sec53-F126L background.
Western blot of invertase from reconstructed sec53/pgm1 strains.
Figure 4.
Figure 4.. pgm1 mutations are dominant suppressors of sec53-V238M.
(A) Diagram of possible spore genotypes in the tetrad dissections. Heterozygous (e.g., SEC53/sec53 PGM1/pgm1) diploid strains could produce one of three tetrad genotypes based on allele segregation. (B) Example of pgm1-T521K dissections in a sec53-V238M background (top) and a sec53-F126L background (bottom). Listed are the probability and log likelihood of suppression, based on the ratio of normal growth (large colonies) to slow growth (no colonies or small colonies). (C) Example of PGM1::pgm1-T521K dissections in a sec53-V238M background (top) and a sec53-F126L background (bottom). (D) Plot of recessive suppression versus dominant suppression of the pgm1 mutations in the sec53-V238M background (red circles) and sec53-F126L background (blue diamonds), based on the tetrad dissections.
Figure 4—figure supplement 1.
Figure 4—figure supplement 1.. Tetrad dissections of PGM1/pgm1 and ALG9/alg9 strains.
Ten tetrads were dissected for each strain. Spores from the same tetrad are grouped vertically. The parental diploid strains contained heterozygous SEC53/sec53 alleles and heterozygous PGM1/pgm1 or ALG9/alg9 alleles.
Figure 4—figure supplement 2.
Figure 4—figure supplement 2.. Tetrad dissections of PGM1-linked strains.
Ten tetrads were dissected for each strain. Spores from the same tetrad are grouped vertically. The parental diploid strains contained heterozygous SEC53/sec53 alleles and four copies of PGM1; a wild-type copy of PGM1 was introduced next to the endogenous PGM1 ORF. Each haploid spore, then, contained either two wild-type copies (PGM1::PGM1) or a wild-type and mutant copy (PGM1::pgm1).
Figure 5.
Figure 5.. Complete loss of Pgm1 activity overshoots a fitness optimum.
(A) AlphaFold structure of S. cerevisiae Pgm1 (Jumper et al., 2021). Mutated residues shown as spheres. (B) Kinetic parameters of recombinant Pgm1 enzymes as determined by a coupled enzymatic assay. Values ± 95% confidence intervals. (C) Michaelis–Menten curves of wild-type and mutant Pgm1. Replicate measurements are plotted as circles. (D) Pgm1 enzyme Vmax versus the corresponding allele’s fitness effect in the diploid pACT1-sec53-V238M background (as shown in Figure 3A). Horizontal and vertical error bars represent 95% confidence intervals. Best fit regression shown as a dashed curve (y = 14.583 + 0.04613x − 0.00014x2, R2 = 0.907, df = 4, F = 37.34, p = 0.0258, analysis of variance [ANOVA]). Note that we did not measure Pgm1-S120A activity and assume null activity.
Figure 5—figure supplement 1.
Figure 5—figure supplement 1.. Enzymatic assays.
Diagrams of the enzymatic reactions assayed in this study.
Figure 5—figure supplement 2.
Figure 5—figure supplement 2.. Thermostabilities of mutant Pgm1.
Average residual activity and standard deviations of recombinant Pgm1 enzymes determined after incubation at the conditions described on the x-axis. Replicate measurements plotted as gray circles. Proteins were incubated in the presence bovine serum albumin (BSA; 0.1 mg/ml).
Figure 5—figure supplement 3.
Figure 5—figure supplement 3.. Phosphomannomutase activity of mutant Pgm1.
(A) Representative phosphomannomutase assay by 31P-NMR spectroscopy. Pgm1 was incubated with 1 mM mannose-1-phosphate (M1P) and 20 μM glucose-1,6-bisphosphate (G16P) for 0 or 60 min. The amount of M1P or M6P was measured by integrating the area of the signals and comparing them to creatine phosphate, added as an internal standard. (B) Spectrophotometric phosphoglucomutase assays were conducted at different concentrations of glucose-1-phosphate (G1P) and M1P. Shapes indicate varying concentrations of M1P and colors indicate Pgm1 variants.
Figure 5—figure supplement 4.
Figure 5—figure supplement 4.. pgm1 mutations increase glucose-1,6-bisphosphate (G16P) levels in the pACT1-sec53-V238M background.
Average abundance and standard deviations of G16P in SEC53-WT and sec53-V238M strains following metabolite extraction. Plus signs (+) indicate wild-type alleles. Replicate measurements plotted as circles. Asterisks (*) represent statistically significant differences (Mann–Whitney U-test, p < 0.01).
Figure 5—figure supplement 5.
Figure 5—figure supplement 5.. Representative forward/reverse phosphoglucomutase assay.
Equal amounts of Pgm1 were incubated with glucose-1-phosphate (G1P) (A) or G6P (B) in the presence of glucose-1,6-bisphosphate (G16P) for 0, 5, 10, or 15 min. The amount of the substrates and products was measured by integrating the area of the signals and comparing them to creatine phosphate, added as an internal standard. Asterisks (*) indicate Pi contaminants.

References

    1. Aebi M, Helenius A, Schenk B, Barone R, Fiumara A, Berger EG, Hennet T, Imbach T, Stutz A, Bjursell C, Uller A, Wahlström JG, Briones P, Cardo E, Clayton P, Winchester B, Cormier-Dalre V, de Lonlay P, Cuer M, Dupré T, Seta N, de Koning T, Dorland L, de Loos F, Kupers L. Carbohydrate-deficient glycoprotein syndromes become congenital disorders of glycosylation: an updated nomenclature for CDG first international workshop on cdgs. Glycoconjugate Journal. 1999;16:669–671. doi: 10.1023/a:1017249723165. - DOI - PubMed
    1. Andreotti G, Monti MC, Citro V, Cubellis MV. Heterodimerization of two pathological mutants enhances the activity of human phosphomannomutase2. PLOS ONE. 2015;10:e0139882. doi: 10.1371/journal.pone.0139882. - DOI - PMC - PubMed
    1. Arlow T, Scott K, Wagenseller A, Gammie A. Proteasome inhibition rescues clinically significant unstable variants of the mismatch repair protein MSH2. PNAS. 2013;110:246–251. doi: 10.1073/pnas.1215510110. - DOI - PMC - PubMed
    1. Barnes G, Hansen WJ, Holcomb CL, Rine J. Asparagine-Linked glycosylation in Saccharomyces cerevisiae: genetic analysis of an early step. Molecular and Cellular Biology. 1984;4:2381–2388. doi: 10.1128/mcb.4.11.2381-2388.1984. - DOI - PMC - PubMed
    1. Beamer LJ. Mutations in hereditary phosphoglucomutase 1 deficiency map to key regions of enzyme structure and function. Journal of Inherited Metabolic Disease. 2015;38:243–256. doi: 10.1007/s10545-014-9757-9. - DOI - PubMed

Publication types

MeSH terms