. 2022 Oct 19;70(41):13200-13211.
doi: 10.1021/acs.jafc.2c03143. Epub 2022 Oct 10.

Supplementation with the Prebiotic High-Esterified Pectin Improves Blood Pressure and Cardiovascular Risk Biomarker Profile, Counteracting Metabolic Malprogramming

Affiliations

Supplementation with the Prebiotic High-Esterified Pectin Improves Blood Pressure and Cardiovascular Risk Biomarker Profile, Counteracting Metabolic Malprogramming

Francisco García-Carrizo et al. J Agric Food Chem. .

Abstract

Supplementation with the prebiotic pectin is associated with beneficial health effects. We aimed to characterize the cardioprotective actions of chronic high-esterified pectin (HEP) supplementation (10%) in a model of metabolic malprogramming in rats, prone to obesity and associated disorders: the progeny of mild calorie-restricted dams during the first half of pregnancy. Results show that pectin supplementation reverses metabolic malprogramming associated with gestational undernutrition. In this sense, HEP supplementation improved blood pressure, reduced heart lipid content, and regulated cardiac gene expression of atrial natriuretic peptide and lipid metabolism-related genes. Moreover, it caused an elevation in circulating levels of fibroblast growth factor 21 and a higher expression of its co-receptor β-klotho in the heart. Most effects are correlated with the gut levels of beneficial bacteria promoted by HEP. Therefore, chronic HEP supplementation shows cardioprotective actions, and hence, it is worth considering as a strategy to prevent programmed cardiometabolic alterations.

Keywords: cardiovascular health; high-esterified pectin; microbiota; perinatal malprogramming; prebiotics.


Conflict of interest statement

The authors declare no competing financial interest.

Figures

Figure 1
Figure 1
(A) Systolic blood pressure (SBP), (B) diastolic blood pressure (DBP), (C) heart rate in beats per minute (BPM), (D) the percentage of heart weight with respect to total body weight, (E) total heart lipid content, and (F) heart triglyceride (TG) content. SBP, DBP, and heart rate were measured at 5 months of age; heart weight, lipid content, and TG were measured after sacrifice (at 6 months of age). Results are expressed as the mean ± SEM of six to eight animals per group. C, offspring of control dams; CR, offspring of dams subjected to calorie restriction during the first 12 days of pregnancy; CRP, CR rats supplemented with high-esterified pectin between days 21 and 180 of life. SD, standard diet; HS, high-sucrose diet (supplemented between days 135 and 180 of life). Statistics: two-way ANOVA was performed to analyze the effects of Treatment (T) and Diet (D), with LSD post hoc analysis (AB). In case of a significant interaction (T×D), one-way ANOVA was performed, with LSD post hoc analysis, splitting individuals with standard diet (ab) and HS diet (xy). Specific differences between individual groups were assessed by Mann–Whitney U test (p < 0.05): *HS versus SD, $CR or CRP group versus C group (same diet). n.s., non-significant.
Figure 2
Figure 2
Heart mRNA expression levels of genes coding for natriuretic peptides A (Nppa) (A), B (Nppb) (B), C (Nppc) (C), myocardin (Myocd) (D), and myostatin (Mstn) (E) at 6 months of age. PBMC expression levels of Nppa at 4 (F) and 6 months (G) and of Mstn at 6 months of age (H). Results are expressed as a percentage of the mean value of the control group, mean ± SEM of 6 to 10 animals per group. C, offspring of control dams; CR, offspring of dams subjected to calorie restriction during the first 12 days of pregnancy; CRP, CR rats supplemented with high-esterified pectin between days 21 and 180. SD, standard diet; HS, high-sucrose diet (supplemented between days 135 and 180 of life). Statistics: ANOVA and post hoc as explained in Figure 1 legend, AB, xy, Mann–Whitney U test (p < 0.05): *HS versus SD, $CR or CRP group versus C group (same diet), #HS versus SD at the p < 0.1 level. n.s., non-significant.
Figure 3
Figure 3
Heart mRNA and protein levels of genes related to lipid oxidation and the control at 6 months of age. (A–E) mRNA levels of the genes Prkaa2 (coding for the AMP-activated protein kinase (AMPK) α subunit), Ppara (for peroxisome proliferator-activated receptor (PPAR) α), Ppargc1a (for PPARγ co-activator 1 α), Cpt1b (for carnitine palmitoyltransferase 1b (CPT1B)), and Fasn (for fatty acid synthase). (F–J) Protein levels of phosphorylated AMPK, phosphorylated AKT, adipose triglyceride lipase (ATGL), CPT1B, and cytochrome c oxidase subunit 4 (COX4). Below the (F)–(J) graphs, representative Western blot images of the corresponding bands are shown: pAMPK 63 kDa, pAKT 60–62 kDa, ATGL 54 kDa, CPT1B 75–85 kDa, COX4 19 kDa, and ACTB 42 kDa. Results are expressed as a percentage of the mean value of the control group, mean ± SEM of 6 to 10 animals per group. C, offspring of control dams; CR, offspring of dams subjected to calorie restriction during the first 12 days of pregnancy; CRP, CR rats supplemented with high-esterified pectin between days 21 and 180. SD, standard diet; HS, high-sucrose diet (supplemented between days 135 and 180 of life). Statistics: ANOVA and post-hoc as explained in Figure 1 legend, AB, ab, xy. Mann–Whitney U test (p < 0.05): *HS versus SD, $CR or CRP group versus C group (same diet), #HS versus SD at the p < 0.1 level. n.s., non-significant.
Figure 4
Figure 4
FGF21 and its receptor and co-receptor expression. (A, B) Levels of mRNA of Fgfr1 and Klb in the heart, (C) circulating FGF21 protein, and (D) Fgf21 mRNA in the liver (6 months of age) of the C, CR, and CRP groups under SD or HS diet. Results are expressed as a percentage of the mean value of the control group, mean ± SEM of 6 to 10 animals per group. C, offspring of control dams; CR, offspring of dams subjected to calorie restriction during the first 12 days of pregnancy; CRP, CR rats supplemented with high-esterified pectin between days 21 and 180. SD, standard diet; HS, high-sucrose diet (supplemented between days 135 and 180 of life). Statistics: ANOVA and post-hoc as explained in Figure 1 legend, AB. Mann–Whitney U test (p < 0.05): *HS versus SD, $CR or CRP group versus C group (same diet), #HS versus SD at the p < 0.1 level. n.s., non-significant.
Figure 5
Figure 5
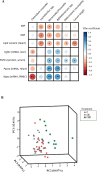
Analyses of correlation analysis and PCA (principal component analysis). (A) Spearman correlation map between the relative abundance of selected health-relevant bacteria (see Materials and Methods section), cecum length, and the cardiovascular health-related parameters studied in the present work. Positive correlations are indicated in blue and negative in red. *Spearman correlation p-value <0.05 **p-value <0.01. (B) PCA involves 39 different variables, including the health-related parameters of the present work, the relative abundance of selected health-relevant bacteria, cecum length, and peripheral blood concentration of SCFAs (acetate, propionate, and butyrate). Plots are colored according to the received treatment. The highest positive and negative contributors for PC2 are detailed in the main text (see results section). All data were normalized for PCA performance. Variability explained of PC1, 2, and 3 are indicated next to each axis. Abbreviations: SBP, systolic blood pressure; DBP, diastolic blood pressure; Fgf21, fibroblast growth factor 21; Ppara, peroxisome proliferator-activated receptor alpha; Nppa, natriuretic peptide A.
Figure 6
Figure 6
Summary of suggested mechanisms involved in the cardiovascular improvement in gestational calorie-restricted animals, associated with high-esterified pectin (HEP) chronic supplementation. HEP supplementation promotes the modulation of the gut microbiota by favoring the increase in the relative abundance of beneficial species. The changes may indirectly impact critical organs, such as the heart and the liver, modulating gene expression and increasing FGF21 circulating levels. Although the liver is the main productor of FGF21, from our results we cannot distinguish whether the elevated blood levels are caused by increased hepatic secretion or by other tissue/s. FGF21, via its specific receptor FGFR1 and co-receptor β-Klotho, might be partly responsible for the improvements observed in the heart, such as the increase in lipid oxidation capacity and in Nppa expression, which in turn would improve blood pressure. Overall, HEP supplementation reverses the increased cardiovascular risk factors caused by gestational calorie restriction and allows the recovery, or even improvement, of metabolic flexibility.

Similar articles

Cited by

References

    1. World Health Organization . Cardiovascular diseases (CVDs); https://www.who.int/news-room/fact-sheets/detail/cardiovascular-diseases-(cvds) (accessed 2021-06-30).
    1. Witkowski M.; Weeks T. L.; Hazen S. L. Gut Microbiota and Cardiovascular Disease. Circ. Res. 2020, 127, 553–570. 10.1161/CIRCRESAHA.120.316242. - DOI - PMC - PubMed
    1. Vernocchi P.; Del Chierico F.; Putignani L. Gut Microbiota Metabolism and Interaction with Food Components. Int. J. Mol. Sci. 2020, 21, 3688.10.3390/ijms21103688. - DOI - PMC - PubMed
    1. Adam C. L.; Williams P. A.; Garden K. E.; Thomson L. M.; Ross A. W. Dose-Dependent Effects of a Soluble Dietary Fibre (Pectin) on Food Intake, Adiposity, Gut Hypertrophy and Gut Satiety Hormone Secretion in Rats. PLoS One 2015, 10, e011543810.1371/journal.pone.0115438. - DOI - PMC - PubMed
    1. Muñoz-Almagro N.; Montilla A.; Villamiel M. Role of Pectin in the Current Trends towards Low-Glycaemic Food Consumption. Food Res. Int. 2021, 140, 10985110.1016/j.foodres.2020.109851. - DOI - PubMed