

Activation of autophagy triggers mitochondrial loss and changes acetylation profile relevant for mechanotransduction in bladder cancer cells
- PMID: 36214828
- PMCID: PMC9816236
- DOI: 10.1007/s00204-022-03375-2
Activation of autophagy triggers mitochondrial loss and changes acetylation profile relevant for mechanotransduction in bladder cancer cells
Abstract
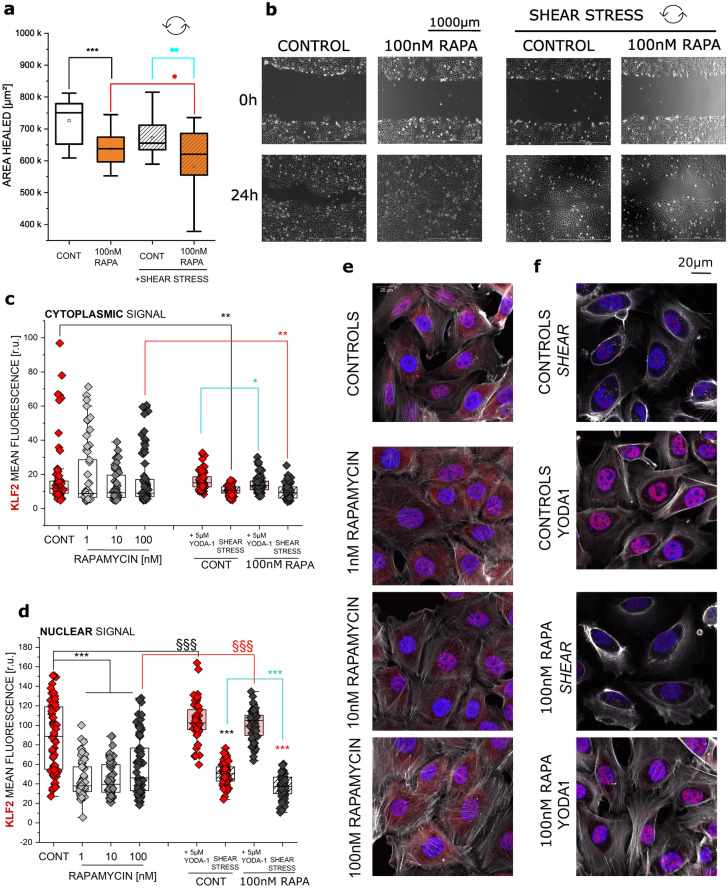
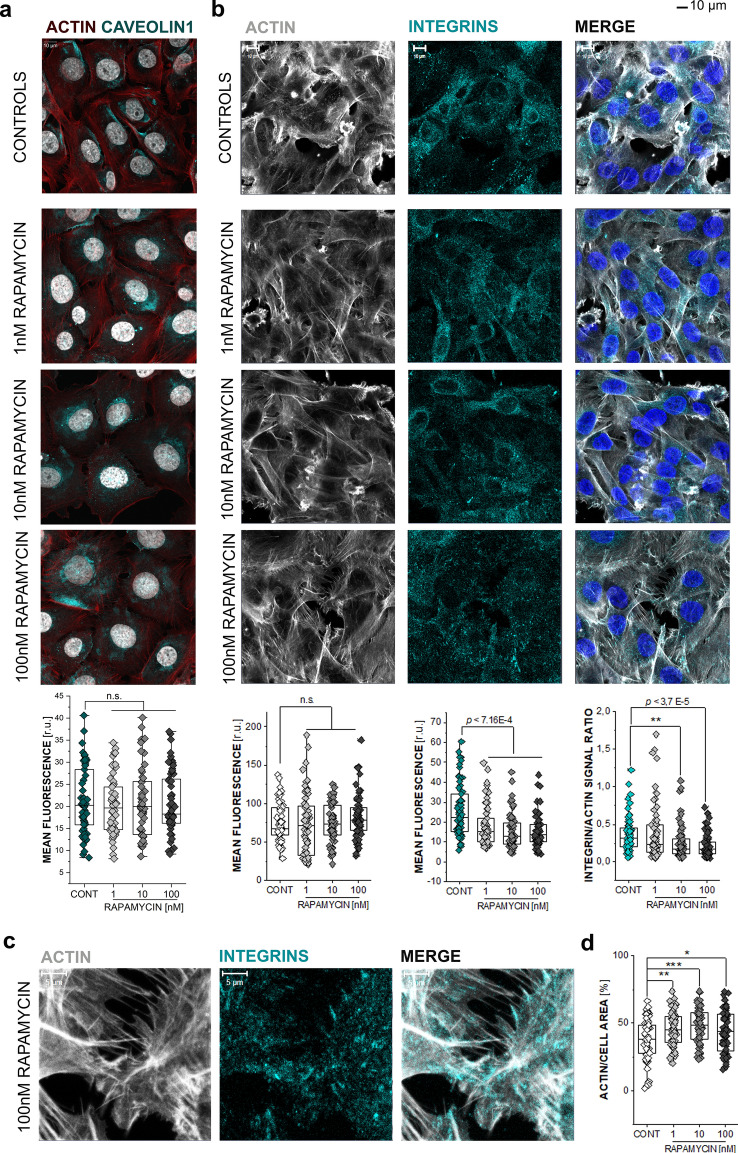
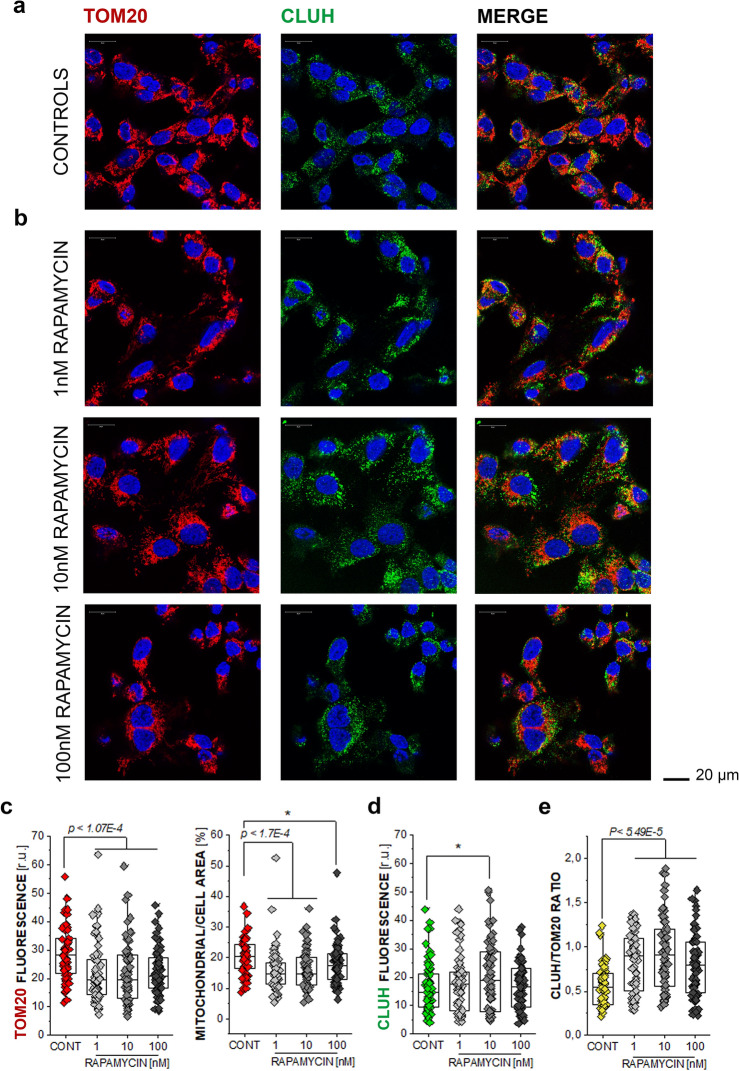
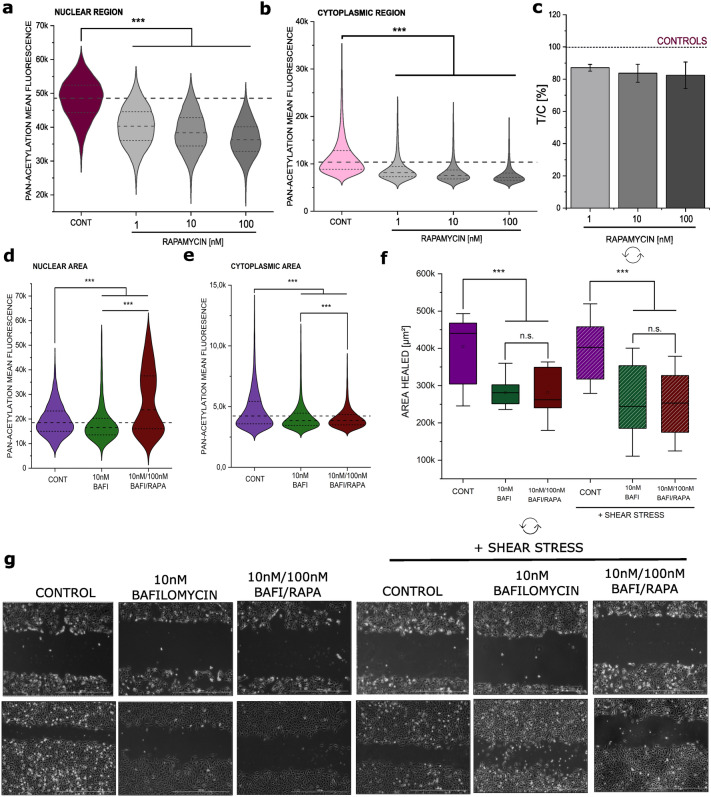
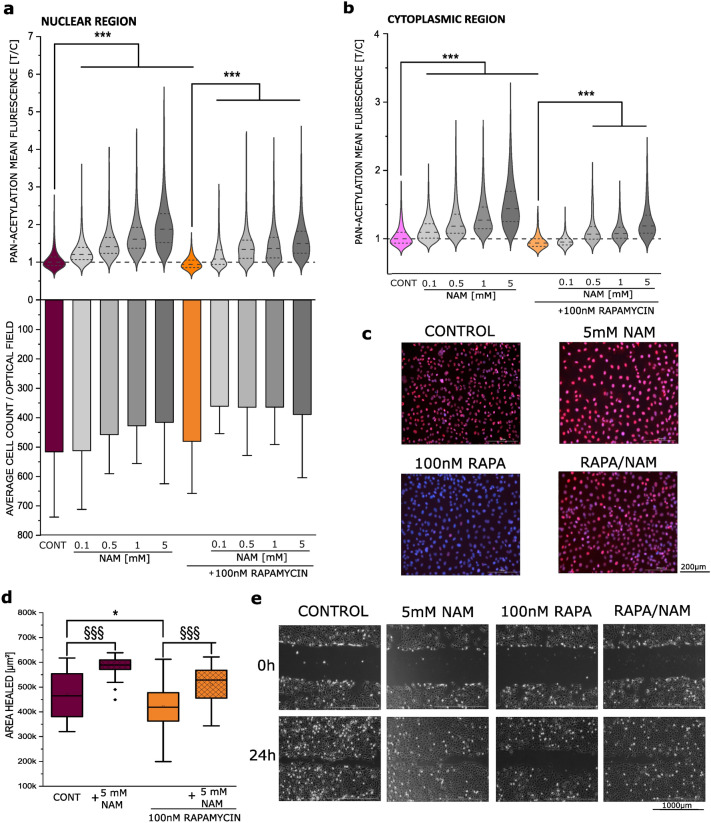
Bladder cells are constantly exposed to multiple xenobiotics and bioactive metabolites. In addition to this challenging chemical environment, they are also exposed to shear stress originating from urine and interstitial fluids. Hence, physiological function of bladder cells relies on a high biochemical and biomechanical adaptive competence, which, in turn, is largely supported via autophagy-related mechanisms. As a negative side of this plasticity, bladder cancer cells are known to adapt readily to chemotherapeutic programs. At the molecular level, autophagy was described to support resistance against pharmacological treatments and to contribute to the maintenance of cell structure and metabolic competence. In this study, we enhanced autophagy with rapamycin (1-100 nM) and assessed its effects on the motility of bladder cells, as well as the capability to respond to shear stress. We observed that rapamycin reduced cell migration and the mechanical-induced translocation potential of Krüppel-like transcription factor 2 (KLF2). These effects were accompanied by a rearrangement of cytoskeletal elements and mitochondrial loss. In parallel, intracellular acetylation levels were decreased. Mechanistically, inhibition of the NAD + -dependent deacetylase sirtuin-1 (SIRT1) with nicotinamide (NAM; 0.1-5 mM) restored acetylation levels hampered by rapamycin and cell motility. Taken together, we described the effects of rapamycin on cytoskeletal elements crucial for mechanotransduction and the dependency of these changes on the mitochondrial turnover caused by autophagy activation. Additionally, we could show that targeted metabolic intervention could revert the outcome of autophagy activation, reinforcing the idea that bladder cells can easily adapt to multiple xenobiotics and circumvent in this way the effects of single chemicals.
Keywords: Acetylation; Migration; Mitophagy; Rapamycin; Shear stress (fluid); T24 bladder cancer cells.
© 2022. The Author(s).
Conflict of interest statement
The authors declare that the research was conducted in the absence of any commercial or financial relationships that could be construed as a potential conflict of interest.
Figures

Similar articles
-
Endoplasmic Reticulum Adaptation and Autophagic Competence Shape Response to Fluid Shear Stress in T24 Bladder Cancer Cells.Front Pharmacol. 2021 May 3;12:647350. doi: 10.3389/fphar.2021.647350. eCollection 2021. Front Pharmacol. 2021. PMID: 34012396 Free PMC article.
-
Autophagy modulation changes mechano-chemical sensitivity of T24 bladder cancer cells.Biomed Pharmacother. 2024 Jan;170:115942. doi: 10.1016/j.biopha.2023.115942. Epub 2023 Dec 2. Biomed Pharmacother. 2024. PMID: 38042111
-
Laminar flow inhibits the Hippo/YAP pathway via autophagy and SIRT1-mediated deacetylation against atherosclerosis.Cell Death Dis. 2020 Feb 21;11(2):141. doi: 10.1038/s41419-020-2343-1. Cell Death Dis. 2020. PMID: 32081881 Free PMC article.
-
Shear stress regulates endothelial cell autophagy via redox regulation and Sirt1 expression.Cell Death Dis. 2015 Jul 16;6(7):e1827. doi: 10.1038/cddis.2015.193. Cell Death Dis. 2015. PMID: 26181207 Free PMC article.
-
[Research Progress in Mechanotransduction Process of Mechanical-Stress-Induced Autophagy].Sichuan Da Xue Xue Bao Yi Xue Ban. 2021 Nov;52(6):929-935. doi: 10.12182/20211160102. Sichuan Da Xue Xue Bao Yi Xue Ban. 2021. PMID: 34841756 Free PMC article. Review. Chinese.
Cited by
-
MANNosylation of Mesoporous Silica Nanoparticles Modifies TLR4 Localization and NF-κB Translocation in T24 Bladder Cancer Cells.Adv Healthc Mater. 2024 Jul;13(17):e2304150. doi: 10.1002/adhm.202304150. Epub 2024 Mar 30. Adv Healthc Mater. 2024. PMID: 38554019 Free PMC article.
-
The role of E3 ubiquitin ligases and deubiquitinases in bladder cancer development and immunotherapy.Front Immunol. 2023 May 5;14:1202633. doi: 10.3389/fimmu.2023.1202633. eCollection 2023. Front Immunol. 2023. PMID: 37215134 Free PMC article. Review.
-
Mechanical cues rewire lipid metabolism and support chemoresistance in epithelial ovarian cancer cell lines OVCAR3 and SKOV3.Cell Commun Signal. 2025 Apr 22;23(1):193. doi: 10.1186/s12964-025-02144-9. Cell Commun Signal. 2025. PMID: 40264231 Free PMC article.
-
Intracellular remodeling associated with endoplasmic reticulum stress modifies biomechanical compliance of bladder cells.Cell Commun Signal. 2023 Oct 30;21(1):307. doi: 10.1186/s12964-023-01295-x. Cell Commun Signal. 2023. PMID: 37904178 Free PMC article.
-
The Metabolic Basis for Nervous System Dysfunction in Alzheimer's Disease, Parkinson's Disease, and Huntington's Disease.Curr Neurovasc Res. 2023;20(3):314-333. doi: 10.2174/1567202620666230721122957. Curr Neurovasc Res. 2023. PMID: 37488757 Free PMC article.
References
MeSH terms
Substances
LinkOut - more resources
Full Text Sources
Medical
Research Materials
