. 2022 Dec;23(6):859-873.
doi: 10.1007/s10162-022-00872-0. Epub 2022 Oct 10.

The Effects of Middle-ear Stiffness on the Auditory Brainstem Neural Encoding of Phase

Affiliations

The Effects of Middle-ear Stiffness on the Auditory Brainstem Neural Encoding of Phase

Jordan M Racca et al. J Assoc Res Otolaryngol. 2022 Dec.

Abstract

The middle-ear system relies on a balance of mass and stiffness characteristics for transmitting sound from the external environment to the cochlea and auditory neural pathway. Phase is one aspect of sound that, when transmitted and encoded by both ears, contributes to binaural cue sensitivity and spatial hearing. The study aims were (i) to investigate the effects of middle-ear stiffness on the auditory brainstem neural encoding of phase in human adults with normal pure-tone thresholds and (ii) to investigate the relationships between middle-ear stiffness-induced changes in wideband acoustic immittance and neural encoding of phase. The auditory brainstem neural encoding of phase was measured using the auditory steady-state response (ASSR) with and without middle-ear stiffness elicited via contralateral activation of the middle-ear muscle reflex (MEMR). Middle-ear stiffness was quantified using a wideband acoustic immittance assay of acoustic absorbance. Statistical analyses demonstrated decreased ASSR phase lag and decreased acoustic absorbance with contralateral activation of the MEMR, consistent with increased middle-ear stiffness changing the auditory brainstem neural encoding of phase. There were no statistically significant correlations between stiffness-induced changes in wideband acoustic absorbance and ASSR phase. The findings of this study may have important implications for understanding binaural cue sensitivity and horizontal plane sound localization in audiologic and otologic clinical populations that demonstrate changes in middle-ear stiffness, including cochlear implant recipients who use combined electric and binaural acoustic hearing and otosclerosis patients.

Keywords: auditory brainstem; auditory steady-state response; middle-ear stiffness; phase.


Conflict of interest statement

René H. Gifford is a consultant for Advanced Bionics, Cochlear Limited, Akouos, and Frequency Therapeutics. Linda J. Hood is a consultant for Akouos and Pfizer. These consultant roles are not in conflict with the work reported here. Rafael E. Delgado is employed by and a stock holder of Intelligent Hearing Systems. There are no other conflicts of interest, financial or otherwise, to disclose.

Figures

Fig. 1
Fig. 1
Comparison of the toneburst repetition rate ASSR acquisition paradigm (a) to the toneburst sequence ASSR acquisition paradigm (b). The toneburst repetition rate illustration represents 60 tonebursts presented at a constant rate of 78.125 Hz. ASSR phase and amplitude measures are acquired at the repetition rate of all 60 tonebursts. The toneburst sequence acquisition illustration represents 4 toneburst sequences containing 15 tonebursts in each sequence. The tonebursts in each sequence are presented at a rate of 78.125 Hz with an inter-stimulus interval (ISI; 12.8 ms) between each sequence. ASSR phase and amplitude are measured at the 78.125-Hz toneburst repetition rate for each toneburst sequence, and the responses from each sequence are averaged together. Representation of the ASSR elicited by the toneburst sequence paradigm analyzed in the temporal domain (c) and spectral domain (d) is shown for 1 representative participant (ME_Phase x0HOaA). Blue arrow heads in c highlight the 15 distinct peaks in the temporal waveform elicited by the 15 tonebursts in the toneburst sequence
Fig. 2
Fig. 2
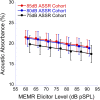
Line plots with linear regression lines showing group mean (± 1 standard error, SE) acoustic absorbance as a function of MEMR elicitor levels. The slope of the robust linear regression line for each individual participant was the dependent variable used for one-sample t test statistical analyses. Twenty-eight participants were included in the 85-dB ASSR stimulus level cohort (red circles); 24 participants were included in the 80-dB ASSR stimulus level cohort (blue circles); and 20 participants were included in the 75-dB ASSR stimulus level cohort (black circles)
Fig. 3
Fig. 3
Bar plots showing group mean (error bars show SE) contralateral MOCR strength elicited by BBN (orange bars) and 20/s click stimuli (blue bars). One-sample t tests were used to determine whether TEOAE amplitude reduction differed from zero indicating an MOCR. Twenty-eight participants were included in the 85-dB ASSR stimulus level cohort (a), 24 participants were included in the 80-dB ASSR stimulus level cohort (b), and 20 participants were included in the 75-dB ASSR stimulus level cohort (c)
Fig. 4
Fig. 4
Line plots showing group mean (± 1 SE) ASSR SNR across ASSR stimulus levels and MEMR elicitor levels. Data plotted at 55 dB represent the no contralateral MEMR elicitor condition. Twenty-eight participants were included in the 85-dB ASSR stimulus level cohort (red circles), 24 participants were included in the 80-dB ASSR stimulus level cohort (blue squares), and 20 participants were included in the 75-dB ASSR stimulus level cohort (black diamonds)
Fig. 5
Fig. 5
(a) Scatter plots with linear regression lines showing group mean (± 1 SE) ASSR phase across MEMR elicitor levels. The slope of the robust linear regression lines for each individual participant was the dependent variable used for one-sample t test statistical analyses. Twenty-eight participants were included in the 85-dB ASSR stimulus level cohort (red circles); 24 participants were included in the 80-dB ASSR stimulus level cohort (blue circles); and 20 participants were included in the 75-dB ASSR stimulus level cohort (black circles). Group mean data (± 1 SE) for ASSR phase without contralateral activation of the MEMR are shown by the square data points to the left of the plot. (b) Group mean (± 1 SE) ASSR phase shifts across MEMR elicitor levels for the 3 ASSR stimulus level cohorts. One-sample t tests were used to determine whether ASSR phase shifts differed significantly from zero. (c) Corresponding group mean (± 1 SE) temporal delays across MEMR elicitor levels for all cohorts calculated based on ASSR phase shifts
Fig. 6
Fig. 6
Scatter plots showing within-participant comparison (group mean ± 1 SE) of ASSR phase across MEMR elicitor levels for the group of 19 participants with ASSR phase data at all 3 ASSR stimulus levels (85-dB ASSR stimulus level shown by blue circles, 80-dB ASSR stimulus level shown by orange squares, and 75-dB ASSR stimulus level shown by black diamonds). Linear regression lines are fit to the data for each ASSR stimulus level. A one-way repeated measures ANOVA was used to determine differences in ASSR phase slope among ASSR stimulus levels
Fig. 7
Fig. 7
Scatter plots with linear regression lines showing the effects of age on ASSR phase slope across ASSR stimulus level cohorts (ac). Pearson correlation coefficients were used to investigate the linear relationship between variables for each cohort. Twenty-eight participants were included in the 85-dB ASSR stimulus level cohort (a), 24 participants were included in the 80-dB ASSR stimulus level cohort (b), and 20 participants were included in the 75-dB ASSR stimulus level cohort (c)
Fig. 8
Fig. 8
(a) Scatter plots with linear regression lines showing group mean (± 1 SE) ASSR amplitude as a function of MEMR elicitor levels. The slope of the robust linear regression lines for each individual participant was the dependent variable used for one-sample t-test statistical analyses. Twenty-eight participants were included in the 85-dB ASSR stimulus level cohort (red circles); 24 participants were included in the 80-dB ASSR stimulus level cohort (blue circles); and 20 participants were included in the 75-dB ASSR stimulus level cohort (black circles). (b) Group mean (± 1 SE) ASSR amplitude shifts vs. MEMR elicitor levels for the 3 ASSR stimulus level cohorts. One-sample t tests were used to determine whether ASSR amplitude shifts differed significantly from zero
Fig. 9
Fig. 9
Scatter plots with linear regression lines showing the relationship between ASSR phase slope and acoustic absorbance slope for the 3 ASSR stimulus level cohorts (ac). Pearson correlation coefficients were used to investigate the linear relationship between variables for each cohort. Twenty-eight participants were included in the 85-dB ASSR stimulus level cohort (a), 24 participants were included in the 80-dB ASSR stimulus level cohort (b), and 20 participants were included in the 75-dB ASSR stimulus level cohort (c)
Fig. 10
Fig. 10
Scatter plots with linear regression lines showing the relationship between ASSR phase slope and power transmittance slope for the 3 ASSR stimulus level cohorts (ac). Pearson correlation coefficients were used to investigate the linear relationship between variables for each cohort. Twenty-eight participants were included in the 85-dB ASSR stimulus level cohort (a), 24 participants were included in the 80-dB ASSR stimulus level cohort (b), and 20 participants were included in the 75-dB ASSR stimulus level cohort (c)

Similar articles

References

    1. Merchant SN, Rosowski JJ (2003) Auditory physiology. Surg Ear 59–82
    1. O’Connor KN, Cai H, Puria S. The effects of varying tympanic-membrane material properties on human middle-ear sound transmission in a three-dimensional finite-element model. The Journal of the Acoustical Society of America. 2017;142(5):2836–2853. doi: 10.1121/1.5008741. - DOI - PMC - PubMed
    1. Avan P, Büki B, Maat B, Dordain M, Wit HP (2000) Middle ear influence on otoacoustic emissions. I: noninvasive investigation of the human transmission apparatus and comparison with model results. Hear Res 140(1–2):189–201 - PubMed
    1. Büki B, Wit HP, Avan P (2000) Olivocochlear efferent vs. middle-ear contributions to the alteration of otoacoustic emissions by contralateral noise. Brain Res 852(1):140–150 - PubMed
    1. Sun XM. Contralateral suppression of distortion product otoacoustic emissions and the middle-ear muscle reflex in human ears. Hear Res. 2008;237(1–2):66–75. doi: 10.1016/j.heares.2007.12.004. - DOI - PubMed

Publication types

LinkOut - more resources