

Understanding the association between neighbourhood socioeconomic status and grocery store alcohol sales following market liberalization in Ontario, Canada
- PMID: 36214995
- PMCID: PMC10036712
- DOI: 10.17269/s41997-022-00694-w
Understanding the association between neighbourhood socioeconomic status and grocery store alcohol sales following market liberalization in Ontario, Canada
Abstract
Objectives: In 2015, Ontario partially deregulated alcohol sales by allowing grocery stores to sell alcohol. The purpose of this study was to evaluate (1) whether neighbourhood-level socioeconomic status (SES) impacted the likelihood that a grocery store began selling alcohol, and (2) whether increases in alcohol retail availability following deregulation differed between neighbourhoods based on SES.
Methods: This was a repeated cross-sectional analysis of 1062 grocery stores in 17,096 neighbourhoods in urban Ontario. The association between neighbourhood-level SES and whether a grocery store began selling alcohol was modeled using mixed effect logistic regression. The annual change in drive-distance from a neighbourhood to the closest off-premise alcohol outlet between 2015 and 2020 was modeled using mixed effect linear regression. An interaction between time and SES was included to evaluate whether this change differed between neighbourhoods based on SES.
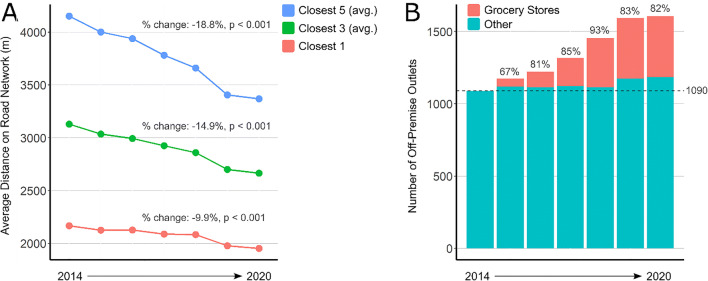
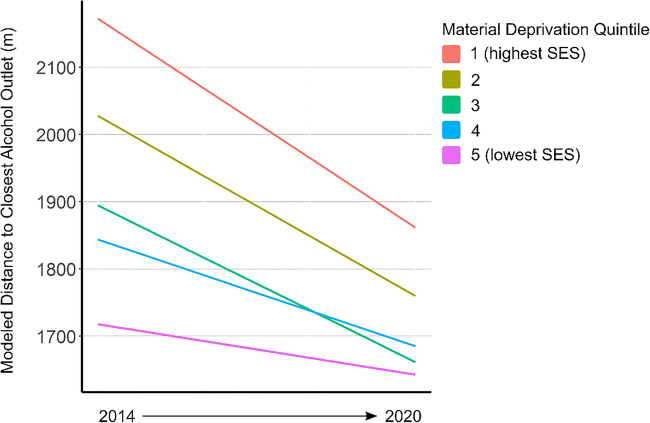
Results: Grocery stores in neighbourhoods in the lowest SES quintile were 39% less likely to start selling alcohol than grocery stores in neighbourhoods in the highest SES quintile (odds ratio (OR): 0.61, 95% confidence interval (CI): 0.39-0.94). As grocery store sales expanded, the distance to the closest off-premise alcohol outlet decreased by 51.8 m annually (95% CI: 48.8-54.9, p < 0.01). A significant interaction between year and SES was observed whereby this trend was more pronounced in high- versus low-SES neighbourhoods.
Conclusion: The expansion of grocery store alcohol sales increased alcohol availability, but this increase was proportionately larger in high- versus low-SES neighbourhoods. This reduced historic disparities in alcohol availability between low- and high-SES neighbourhoods.
RéSUMé: OBJECTIFS: En 2015, l’Ontario a partiellement déréglementé les ventes d’alcool en autorisant les épiceries à en vendre. Notre étude visait à évaluer : 1) si le statut socioéconomique (SSE) du quartier avait un effet sur la probabilité qu’une épicerie commence à vendre de l’alcool et 2) si les augmentations de l’accessibilité de l’alcool au détail après la déréglementation différaient d’un quartier à l’autre selon le SSE. MéTHODE: Il s’agissait d’une analyse transversale répétée de 1 062 épiceries dans 17 096 quartiers urbains de l’Ontario. L’association entre le SSE du quartier et le fait qu’une épicerie commence ou non à vendre de l’alcool a été modélisée par régression logistique à effets mixtes. Le changement annuel de la distance de conduite entre un quartier et le point de vente d’alcool hors site le plus proche entre 2015 et 2020 a été modélisé par régression linéaire à effets mixtes. Une interaction entre le temps et le SSE a été incluse pour évaluer si le changement différait d’un quartier à l’autre selon le SSE. RéSULTATS: Les épiceries des quartiers du quintile SSE le plus défavorisé ont été de 39 points de pourcentage moins susceptibles de commencer à vendre de l’alcool que les épiceries des quartiers du quintile SSE le plus favorisé (rapport de cotes [RC] : 0,61, intervalle de confiance de 95 % [(IC] : 0,39-0,94). Avec l’expansion des ventes des épiceries, la distance jusqu’au point de vente d’alcool hors site le plus proche a diminué de 51,8 mètres par année (IC de 95 % : 48,8-54,9, p < 0,01). Une interaction significative entre l’année et le SSE a été observée : cette tendance était plus prononcée dans les quartiers de SSE élevé que dans les quartiers de faible SSE. CONCLUSION: L’expansion des ventes d’alcool des épiceries a fait augmenter l’accessibilité de l’alcool, mais cette augmentation a été proportionnellement plus grande dans les quartiers de SSE élevé que dans les quartiers de faible SSE. Cela a réduit les disparités historiques d’accessibilité de l’alcool entre les quartiers de SSE élevé et de faible SSE.
Keywords: Alcohol availability; Alcohol harm paradox; Alcohol regulation policy; Socioeconomic factors.
© 2022. The Author(s) under exclusive license to The Canadian Public Health Association.
Conflict of interest statement
The authors declare no competing interests.
Figures
References
-
- Bates D, Sarkar D, Bates MD, Matrix L. The lme4 package. R package version. 2007;2(1):74.
-
- Brennan M, McGregor B, Buckland J. The changing structure of inner-city retail banking: Examining bank branch and payday loan outlet locations in Winnipeg, 1980-2009. Canadian Journal of Urban Research. 2011;20(1):1–32.
MeSH terms
LinkOut - more resources
Full Text Sources
Research Materials
Miscellaneous
